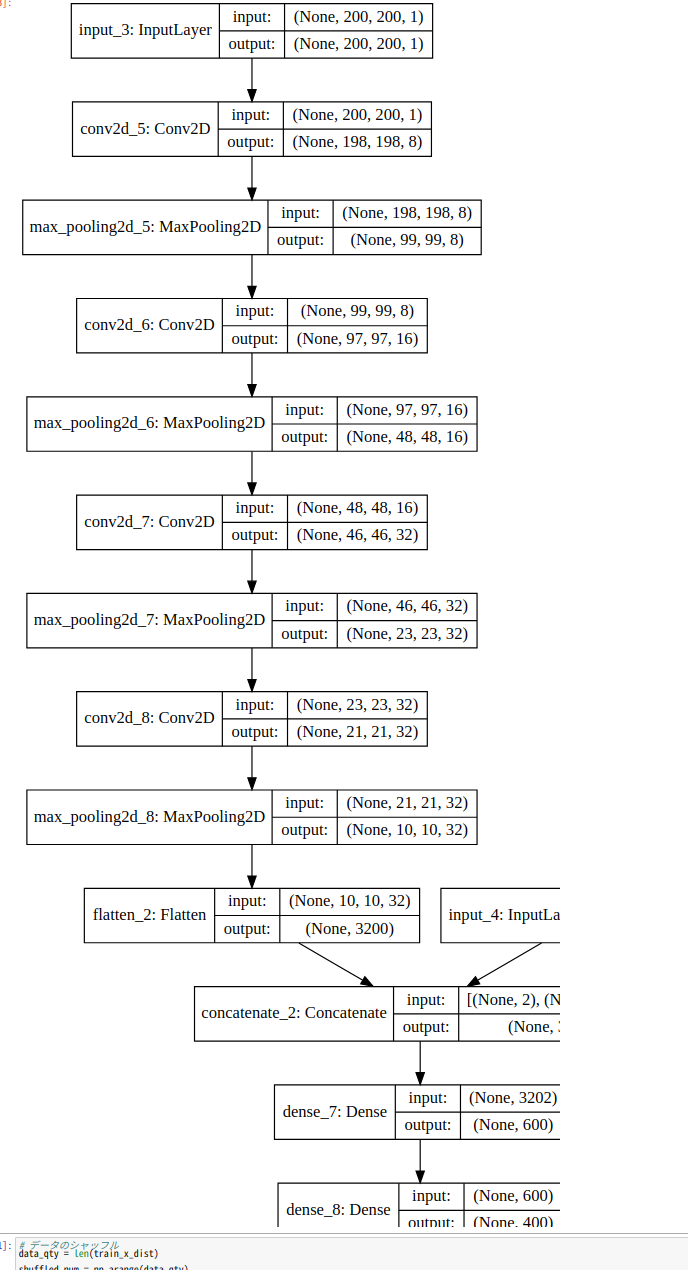
新しい開発環境で以下のようにSVGを使って深層学習のネットワーク構造をいつも通り可視化しようとしたところ、図のように表示が見切れてしまった。
from IPython.display import SVG

from keras.utils.vis_utils import model_to_dot
SVG(model_to_dot(model, show_shapes=True).create(prog='dot', format='svg'))
調べてみたところ、バージョン1.14.0以降のkerasのmodel_to_dot関数の引数にdpiが加わり、デフォルト値が96に設定されているのが問題のようです。
もともとはNoneとして扱われていたようなのでmodel_to_dotの引数にdpi=Noneを加えてあげましょう。
SVG(model_to_dot(model, show_shapes=True, dpi=None).create(prog='dot', format='svg'))
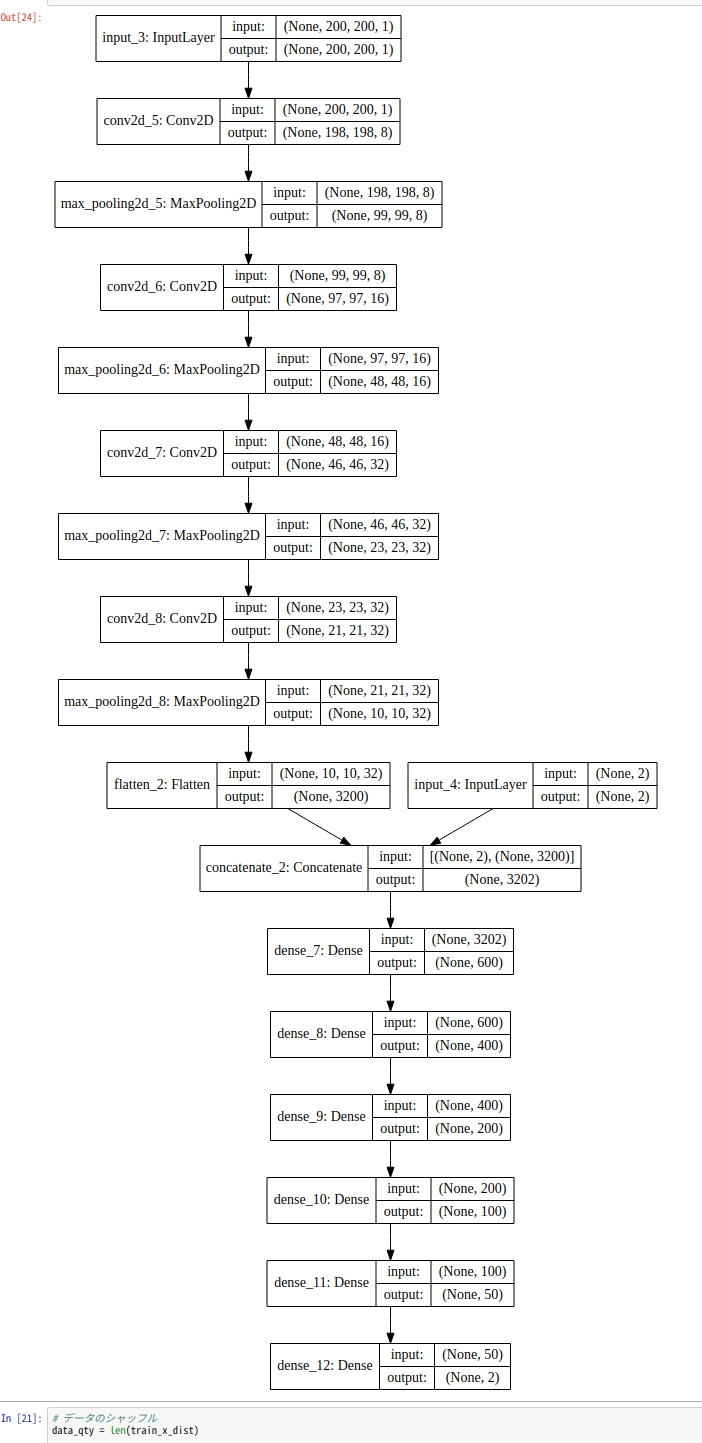
これで表示することが可能です。
なお、dpiを変えれば自由にサイズを変えることができます。