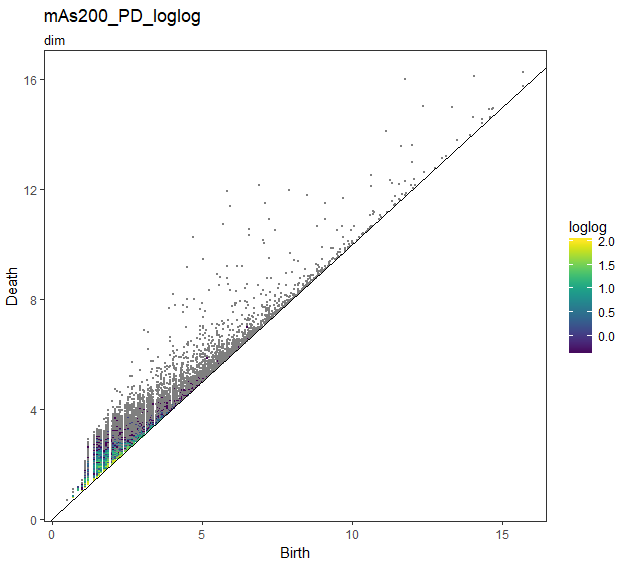
TDA(topological data analysis)で、一次元の輪、2次元の空洞を数える
パッケージ
library(TDA)
library(foreach)
library(ggplot2)
library(tidyverse)
library(readxl)
SDの計算
下の画像のようにROIをとってImageJで各ROIのStDvを取得
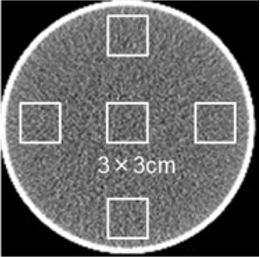
全ROIの平均値をSDとする
> read_excel("C:/Users/owner/Desktop/sd.xlsx")
 # A tibble: 55 x 3
    Area StdDev    mA
   <dbl>  <dbl> <dbl>
 1   746   25.2  50.0
 2   746   21.9  50.0
 3   746   21.8  50.0
 4   746   21.1  50.0
 5   746   24.1  50.0
 6   746   17.6 100
 7   746   14.6 100
 8   746   15.1 100
 9   746   15.0 100
10   746   17.2 100
 # ... with 45 more rows

read_excel("C:/Users/owner/Desktop/sd.xlsx") %>%
  select(-Area) %>%
  group_by(mA) %>%
  summarise(SD = mean(StdDev)) -> SD_tbl
> SD_tbl
 # A tibble: 11 x 2
      mA    SD
   <dbl> <dbl>
 1  50.0 22.8
 2 100   15.9
 3 150   13.2
 4 200   11.2
 5 250   10.1
 6 300    9.58
 7 350    8.46
 8 400    7.99
 9 450    7.68
10 500    7.32
11 550    7.13
ImageJで画像の座標を取得
Save XY Coordinatesで(x,y,z,Value)を取得

今回は管電流が50から550mAまで50mA刻みのCT水ファントム画像を用いました。だから11枚の画像
read_delim("20170930.txt",
           "\t",escape_double = FALSE,
           col_names = FALSE,
           col_types = cols(X4 = col_double()),
           trim_ws = TRUE) %>%
  rename(x = V1, y = V2, z = V3, HU = V4) %>%
  as.tbl() %>%
  dplyr::filter(HU >= 100) %>%
  group_by(z) %>%
  nest() -> dat
slice_Number <- seq_along(dat$z) ## foreachで使う

> dat$data[[1]]
# A tibble: 57,275 x 3
       x     y    HU
   <int> <int> <dbl>
 1   243   123   293
 2   244   123   302
 3   245   123   297
 4   246   123   302
 5   247   123   313
 6   248   123   268
 7   249   123   296
 8   250   123   289
 9   251   123   319
10   252   123   287
# ... with 57,265 more rows
TDA
TDA::alphashapeDiag()を使って計算
shapeDiag <- foreach(i = slice_Number) %do% alphaShapeDiag(dat$data[[i]])
パーシステント図(PD)をデータフレームに変換
mutate()でDeathとBirthの差を付け加える
shapeDiag_df <- foreach(i = slice_Number) %do% {
  tibble::tibble(
    Dimension = as.factor(shapeDiag[[i]]$diagram[,1]),
          Birth = shapeDiag[[i]]$diagram[,2],
          Death = shapeDiag[[i]]$diagram[,3]
  ) %>%
    mutate(SuvivalInterval = Death - Birth)
}
PDの座標からDimension毎に個数(holes)、生存半径区間のMax,Min,Median,Meanの集計
summarise_df <- foreach(i = slice_Number, .combine = rbind) %do% {
  shapeDiag_df[[i]] %>%
    group_by(Dimension) %>%
    summarise(.,
              holes = n(),
              Max = max(SuvivalInterval),
              Min = min(SuvivalInterval),
              Median = median(SuvivalInterval),
              Mean = mean(SuvivalInterval)
    ) %>%
    mutate(.,mAs = mAs[i])
}
生成される半径が各画像のSD以上またはSD以下で区切って集計
Birth ≦ SD
summarise_sdun_df <- foreach(i = slice_Number, .combine = rbind) %do% {
    shapeDiag_df[[i]] %>%
      dplyr::group_by(.,Dimension) %>%
      dplyr::filter(.,Birth <= SD_tbl$SD[i]) %>%
      dplyr::summarise(.,
                       holes = n(),
                       Max = max(SuvivalInterval),
                       Min = min(SuvivalInterval),
                       Median = median(SuvivalInterval),
                       Mean = mean(SuvivalInterval)
      ) %>%
    mutate(.,mAs = mAs[i])
}
Birth ≧ SD
summarise_sdov_df <- foreach(i = slice_Number, .combine = rbind) %do% {
    shapeDiag_df[[i]] %>%
      dplyr::group_by(.,Dimension) %>%
      dplyr::filter(.,Birth >= SD_tbl$SD[i]) %>%
      dplyr::summarise(.,
                       holes = n(),
                       Max = max(SuvivalInterval),
                       Min = min(SuvivalInterval),
                       Median = median(SuvivalInterval),
                       Mean = mean(SuvivalInterval)

      ) %>%
    mutate(.,mAs = mAs[i])
}
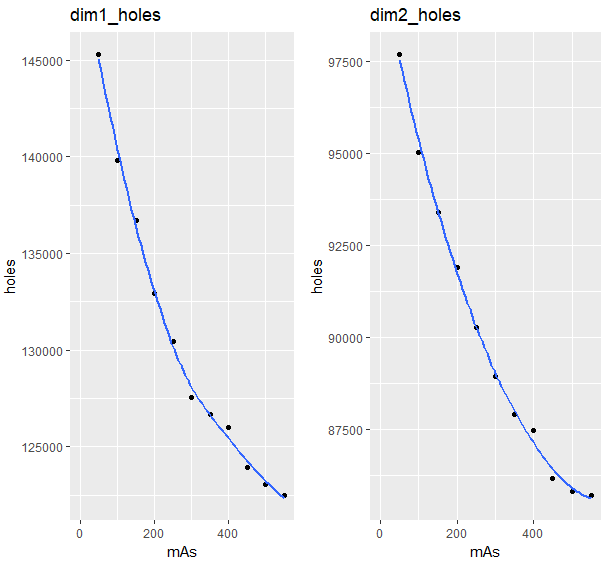
Dimension毎にネストさせてggplotでmAと穴or空洞の数(holes)の関係
## dimensionでネストさせたtbl_df
Interval_tbl <- summarise_df %>%
  group_by(Dimension) %>%
  nest()
## Birth <= SD
Interval_sdun_tbl <- summarise_sdun_df %>%
  group_by(Dimension) %>%
  nest()
## Birth >= SD
Interval_sdov_tbl <- summarise_sdov_df %>%
  group_by(Dimension) %>%
  nest()

dim <- seq_along(Interval_tbl$Dimension)

## ggplot_穴の数
gg_dimk_holes <- foreach(k = dim) %do% {
  ggplot(Interval_tbl$data[[k]],aes(x = mAs,y = holes))+
    xlim(0,550)+
    geom_point()+
    geom_smooth(se = FALSE,method = "loess") +
    ggtitle(str_c("dim", sep = k-1, "_holes"))
}


gg_dimk_holes_sdun <- foreach(k = dim) %do% {
  ggplot(Interval_sdun_tbl$data[[k]],aes(x = mAs,y = holes))+
    xlim(0,550)+
    geom_point()+
    geom_smooth(se = FALSE,method = "loess") +
    ggtitle(str_c("dim", sep = k-1, "_holes"),subtitle = "<= under_sd")
}

gg_dimk_holes_sdov <- foreach(k = seq_along(Interval_sdov_tbl$Dimension)) %do% {
  ggplot(Interval_sdov_tbl$data[[k]],aes(x = mAs,y = holes))+
    xlim(0,550)+
    geom_point()+
    geom_smooth(se = FALSE,method = "loess") +
    ggtitle(str_c("dim", sep = k, "_holes"),subtitle = "over_sd")
}
各次元(Dimension)でbirth,Death が一致した行の個数(holes)を算出することでPD作成
PD_df <- foreach(i = slice_Number) %do% {
  shapeDiag_df[[i]] %>%
    group_by(Dimension,Birth,Death) %>%
    summarise(holes = n(),
              log =  log(n()),
              loglog = log(log(n()))
    ) %>%
    ungroup()
}

PD_df_nest <- foreach(i = slice_Number) %do% {
  shapeDiag_df[[i]] %>%
    group_by(Dimension,Birth,Death) %>%
    summarise(holes = n(),
              log =  log(n()),
              loglog = log(log(n()))
    ) %>%
    group_by(Dimension) %>%
    nest()
}
重複した点があると、ggplotではPDを書くのが遅くなる。重複が7000を超える座標が多く存在するため
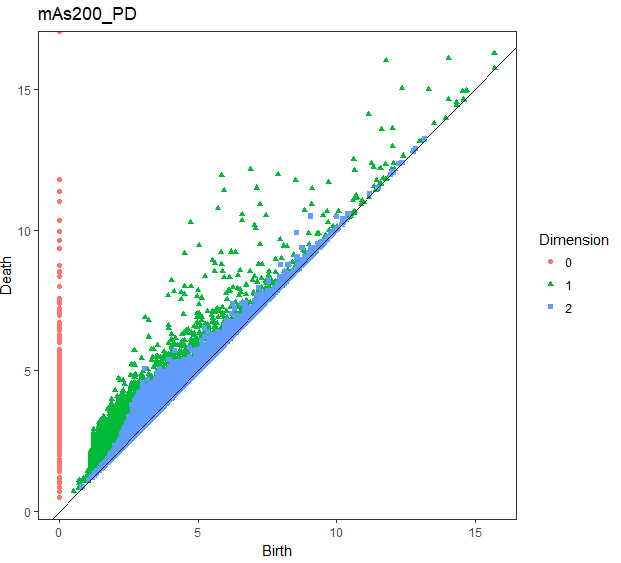
PDのプロット
## PD
gg_PD <- foreach(i = slice_Number) %do% {
  PD_df[[i]] %$%
    ggplot(.,aes(x = Birth, y = Death, shape = Dimension, colour = Dimension)) +
    geom_point() +
    geom_abline(slope = 1) +
    theme_bw() +
    theme(panel.grid.major = element_blank(),
          panel.grid.minor = element_blank()
          ) +
    ggtitle(str_c("mAs",sep = i*50,"_PD"))
}

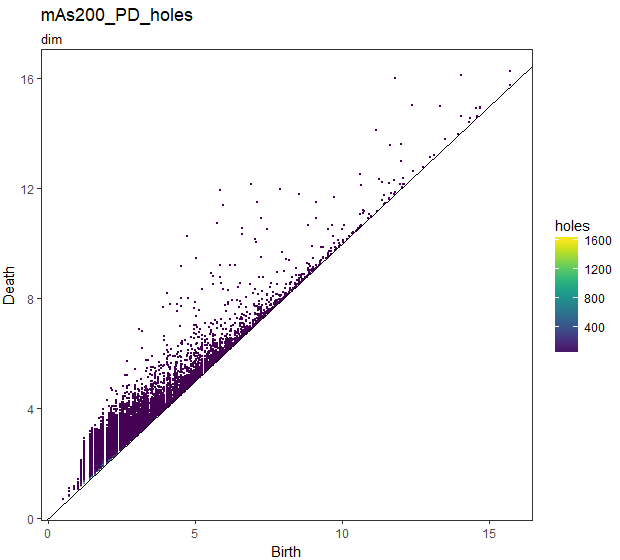
## holesは重複度が線形スケール

gg_PD_holes <- foreach(i = slice_Number) %do% {
  foreach(k = dim) %do% {
    PD_df_nest[[i]]$data[[k]] %$%
      ggplot(.,aes(x = Birth, y = Death, colour = holes)) +
      geom_point(size = rel(0.2)) +
      geom_abline(slope = 1) +
      theme_bw() +
      theme(panel.grid.major = element_blank(),
            panel.grid.minor = element_blank()
      ) +
      viridis::scale_colour_viridis() +
      ggtitle(str_c("mAs",sep = i*50,"_PD_holes"),subtitle = str_c("dim",sep = k))
  }
}

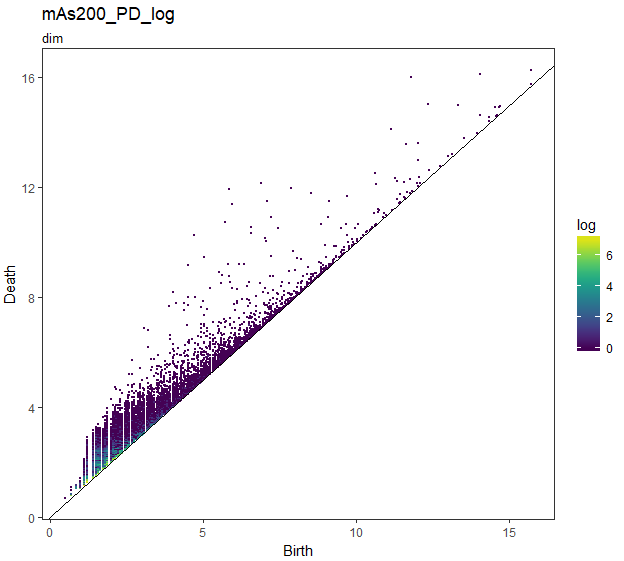
## logは重複度がlog()スケール
gg_PD_log <- foreach(i = slice_Number) %do% {
  foreach(k = dim) %do% {
    PD_df_nest[[i]]$data[[k]] %$%
      ggplot(.,aes(x = Birth, y = Death, colour = log)) +
      geom_point(size = rel(0.1)) +
      geom_abline(slope = 1) +
      theme_bw() +
      theme(panel.grid.major = element_blank(),
            panel.grid.minor = element_blank()
      ) +
      viridis::scale_colour_viridis() +
      ggtitle(str_c("mAs",sep = i*50,"_PD_log"),subtitle = str_c("dim",sep = k))
  }
}


## loglogは重複度loglogスケール
gg_PD_loglog <- foreach(i = slice_Number) %do% {
  foreach(k = dim) %do% {
    PD_df_nest[[i]]$data[[k]] %$%
      ggplot(.,aes(x = Birth, y = Death, colour = loglog)) +
      geom_point(size = rel(0.1)) +
      geom_abline(slope = 1) +
      theme_bw() +
      theme(panel.grid.major = element_blank(),
            panel.grid.minor = element_blank()
      ) +
      viridis::scale_colour_viridis() +
      ggtitle(str_c("mAs",sep = i*50,"_PD_loglog"),subtitle = str_c("dim",sep = k))
  }
}
loglogスケールでは、log1 = 0 なので log(log(1)) = Inf になりInfの部分、すなわち重複していないPDの点はグレーで表示されます
