使用するデータについて
今回は北海道のとある河川の水位をVotingを使用して予測してみました。期間は2023/8/1 1:00 ~ 2023/8/18 0:00です。
目的変数(河川水位)は以下より取得しました。
説明変数(降水量、湿度、etc.)は以下より取得しました。
今回はテストデータとトレーニングデータは同一のものとしています(クローズドテスト)。使用するcsvファイルの中身は以下の通りです。河川水位(m)は"A"、その他の変数は"B"~"K"の任意の変数を割り当てています。
date     A     B    C     D     E   F       G    H    I     J     K
0      2023/8/1 1:00  5.69  23.0  0.0  24.7  20.9  88  1010.8  0.0  0.8  0.00  1007.8
1      2023/8/1 2:00  5.70  22.5  0.0  25.1  21.1  92  1010.9  0.0  0.3  0.00  1007.9
2      2023/8/1 3:00  5.74  22.6  0.0  24.7  20.9  90  1011.0  0.0  0.2  0.00  1008.0
3      2023/8/1 4:00  5.72  22.1  0.0  23.7  20.2  89  1011.1  0.0  1.2  0.00  1008.1
4      2023/8/1 5:00  5.70  21.6  0.0  23.0  19.7  89  1011.4  0.0  1.0  0.03  1008.4
..               ...   ...   ...  ...   ...   ...  ..     ...  ...  ...   ...     ...
403  2023/8/17 20:00  5.69  26.5  0.0  22.5  19.4  65  1006.4  0.0  5.8  0.00  1003.4
404  2023/8/17 21:00  5.69  26.4  0.0  22.4  19.3  65  1007.3  0.0  1.5  0.00  1004.3
405  2023/8/17 22:00  5.68  25.8  0.0  22.9  19.7  69  1008.0  0.0  0.2  0.00  1005.0
406  2023/8/17 23:00  5.68  25.4  0.0  23.4  20.0  72  1008.4  0.0  3.2  0.00  1005.4
407   2023/8/18 0:00  5.68  25.0  0.0  23.8  20.3  75  1008.5  0.0  2.3  0.00  1005.5

[408 rows x 12 columns]
VotingRegressorについて
複数の予測モデルの平均であるVotingRegressorの予測結果を出力したいと思います。
使用する予測モデルは以下です。
- Random Forest
- Gradient Boosting
- Linear Regression
- Elastic Net
実装コード
# モジュール
import os
import numpy as np
import pandas as pd

# バージョンチェック
import sys
print('python', sys.version)
import sklearn
print('sklearn', sklearn.__version__)

# 機械学習系ライブラリ
import xgboost as xgb
from sklearn.ensemble import GradientBoostingRegressor
from sklearn.ensemble import RandomForestRegressor
from sklearn.linear_model import LinearRegression
from sklearn.linear_model import ElasticNetCV

# VotingRegressor
from sklearn.ensemble import VotingRegressor

#ハイパーパラメータ探索
from functools import partial

# 精度評価用ライブラリ
from sklearn.metrics import r2_score

# RMSE(Root Mean Squared Error)
from sklearn.metrics import mean_squared_error

# グラフ描画系ライブラリ
import matplotlib.pyplot as plt
出力
python 3.11.0 (main, Oct 24 2022, 18:26:48) [MSC v.1933 64 bit (AMD64)]
sklearn 1.1.3
# データの準備
class Data():
    def __init__(self, CV_data, test_data):
        self.CV_data = CV_data
        self.test_data = test_data
    # 標準化
    def standard(self, df, df_train):
        train_mean = df_train.mean()
        train_std = df_train.std()
        return (df - train_mean)/train_std
    # 予測する変数の分離
    def variable(self, data, target_index):
        return data.drop(target_index, axis=1)
    # dateの分離
    def sep_date(self, AA_data):
        return AA_data.date, AA_data.drop('date', axis=1)
    # データの処理
    def create_data(self, obj_path, std_path):
        obj_data = pd.read_csv(obj_path, encoding='shift-jis')
        CV_data = pd.read_csv(std_path, encoding='shift-jis')
        # 日付の保存
        test_date = Data.sep_date(self, obj_data)[0]
        # dateの分離
        obj_data = Data.sep_date(self, obj_data)[1]
        CV_data = Data.sep_date(self, CV_data)[1]
        # AA_data = sep_date(AA_data)[1].astype('int')
        # 目的変数の指定
        target_index = ['A']
        obj_target = obj_data[target_index]
        CV_target = CV_data[target_index]
        # 説明変数の指定
        obj_exp = Data.variable(self, obj_data, target_index)
        CV_exp = Data.variable(self, CV_data, target_index)
        # 標準化
        std_exp, std_target = Data.standard(self, obj_exp, CV_exp), Data.standard(self, obj_target, CV_target)
        return test_date, std_exp, std_target
    # 学習データ
    def cv_create(self, CV_data):
        CV_date, CV_exp, CV_target = Data.create_data(self, os.getcwd() + os.sep + 'data.csv', os.getcwd() + os.sep + 'data.csv')
        return CV_date, CV_exp, CV_target
    # テストデータ
    def test_create(self, CV_data, test_data):
        test_date, test_exp, test_target = Data.create_data(self, os.getcwd() + os.sep + 'data.csv', os.getcwd() + os.sep + 'data.csv')
        return test_date, test_exp, test_target
# Voting
class MachineMethods():
    def __init__(self, result, p_flag=True, n_trials=10):
        self.result = result
        self.p_flag = p_flag
        self.n_trials = n_trials
    def voting(self):
        estimators = []
        model1 = GradientBoostingRegressor(random_state=1, n_estimators=10) ; estimators.append(('gb', model1))
        model2 = RandomForestRegressor(random_state=1, n_estimators=10) ; estimators.append(('rf', model2))
        model3 = LinearRegression(normalize=True) ; estimators.append(('lr', model3))
        model4 = ElasticNetCV(l1_ratio=0.5, cv=5, positive=True) ; estimators.append(('en', model4))
        pred1 = model1.fit(test_exp, test_target).predict(test_exp)
        pred2 = model2.fit(test_exp, test_target).predict(test_exp)
        pred3 = model3.fit(test_exp, test_target).predict(test_exp)
        pred4 = model4.fit(test_exp, test_target).predict(test_exp)
        # 分類器を学習する
        ereg = VotingRegressor(estimators)
        pred_voting = ereg.fit(test_exp, test_target).predict(test_exp)
        return pred1, pred2, pred3, pred4, pred_voting
    def drawing(self):
        plt.figure(figsize=(12, 6))
        plt.plot(test_date, test_target, label='observed')
        plt.plot(test_date, pred1, label='gb')
        plt.plot(test_date, pred2, label='rf')
        plt.plot(test_date, pred3, label='lr')
        plt.plot(test_date, pred4, label='en')
        plt.plot(test_date, pred_voting, label='voting')
        plt.legend()
        plt.savefig("result.png")
        plt.show()
data1 = Data('data', 'data')
CV_date, CV_exp, CV_target = data1.cv_create('data')
test_date, test_exp, test_target = data1.test_create('data', 'data')
result1 = MachineMethods('data')
pred1, pred2, pred3, pred4, pred_voting = result1.voting()
result1.drawing()
予測結果
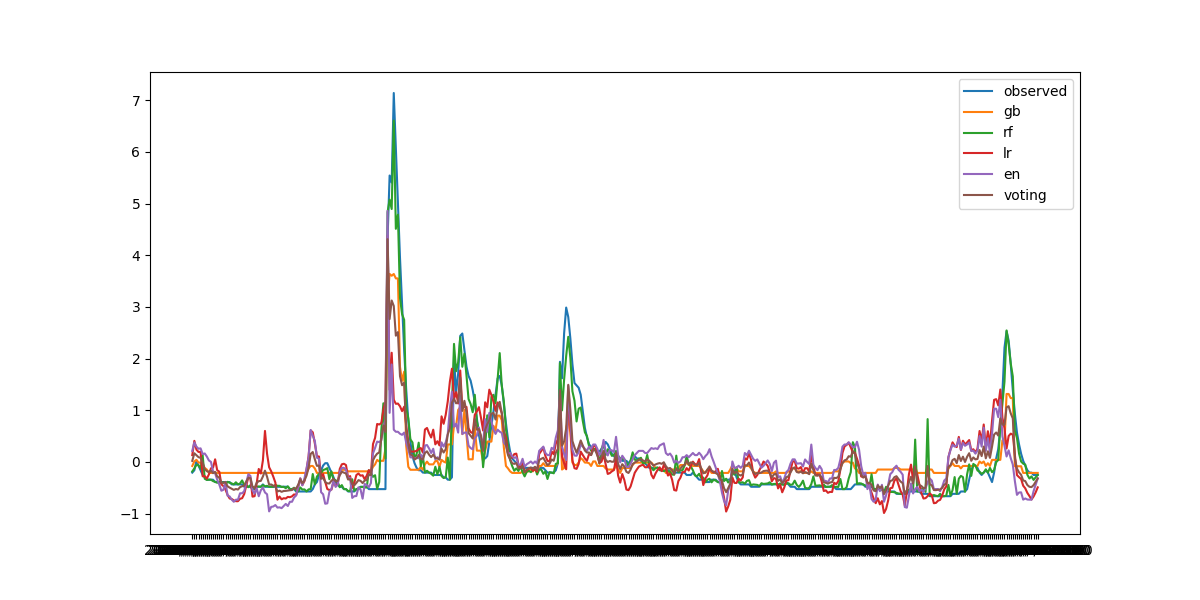
コードが汚いなあと思いながら、学生時代に書いたコードなのでご愛敬。クローズドテストということもありランダムフォレストによる予測結果が一番良さそう?
もちろん予測結果は全く参考になりません。各モデルのパラメータのチューニングを実施しているわけではないので...
今回は気象データから河川水位を複数の機械学習法で予測し、votingの実装まで至ることが出来ました。各予測モデルのアルゴリズムについては完全に理解できていないものあるので、そのうち勉強しようと思います。
参考
