はじめに
matplotの凡例はほとんどの場合自動作成で事足りると思いますが、イレギュラーが発生したので手動で設定する方法をメモしておきます。
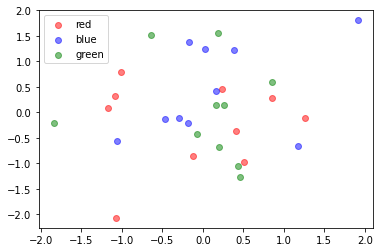
普通のプロット
おそらくほとんどの場合これで十分で、これができるようにデータをまとめればいいと思います。
import numpy as np
from matplotlib import pyplot as plt

red_x, red_y = np.random.randn(10), np.random.randn(10)
blue_x, blue_y = np.random.randn(10), np.random.randn(10)
green_x, green_y = np.random.randn(10), np.random.randn(10)

plt.scatter(red_x, red_y, c="r", alpha=0.5, label="red")
plt.scatter(blue_x, blue_y, c="b", alpha=0.5, label="blue")
plt.scatter(green_x, green_y, c="g", alpha=0.5, label="green")

plt.legend()
plt.show()
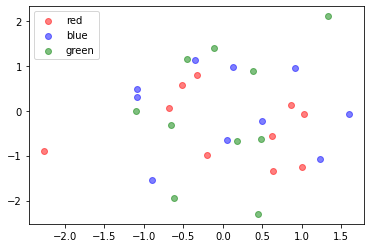
手動で設定する
特殊な状況、特殊なデータを扱っていて上のコードにできない、もしくはコードが汚くなってしまうときは以下のようにして手動で設定できます。
import numpy as np
from matplotlib import pyplot as plt

red_x, red_y = np.random.randn(10), np.random.randn(10)
blue_x, blue_y = np.random.randn(10), np.random.randn(10)
green_x, green_y = np.random.randn(10), np.random.randn(10)

# データの部分からlabelを取っ払う
plt.scatter(red_x, red_y, c="r", alpha=0.5)
plt.scatter(blue_x, blue_y, c="b", alpha=0.5)
plt.scatter(green_x, green_y, c="g", alpha=0.5)

# 凡例用に空のデータをlabel付でプロットする(実際はなにもプロットしてない)
plt.scatter([], [], c="r", alpha=0.5, label="red")
plt.scatter([], [], c="b", alpha=0.5, label="blue")
plt.scatter([], [], c="g", alpha=0.5, label="green")

plt.legend()
plt.show()
おわりに
凡例の部分だけ透明度や点の大きさを変えるなどのときにも使用できそうな感じです。