前提
VScodeをインストールし、PlantUMLを入れましょう。
plantUML とは
PlantUML は、ダイアグラムを素早く作成するためのコンポーネントである。
内容
ガンチャート
@startuml
language ja

<style>
ganttDiagram {
	task {
		FontName Helvetica
		FontColor red
		FontSize 12
		FontStyle bold
		BackGroundColor GreenYellow
		LineColor blue
	}
	milestone {
		FontColor blue
		FontSize 25
		FontStyle italic
		BackGroundColor yellow
		LineColor red
	}
	note {
		FontColor DarkGreen
		FontSize 10
		LineColor OrangeRed
	}
	arrow {
		FontName Helvetica
		FontColor red
		FontSize 18
		FontStyle bold
		BackGroundColor GreenYellow
		LineColor blue
		LineStyle 8.0;13.0
		LineThickness 3.0
	}
	separator {
		BackgroundColor lightGreen
		LineStyle 8.0;3.0
		LineColor red
		LineThickness 1.0
		FontSize 16
		FontStyle bold
		FontColor purple
		Margin 5
		Padding 20
	}
	timeline {
	    BackgroundColor Bisque
	}
	closed {
		BackgroundColor pink
		FontColor red
	}
}
</style>

Project starts 2022-07-01
saturday are closed
sunday are closed

2022/07/18 is colored in salmon
2022/08/11 is colored in salmon

[Aパッケージを設計] starts 2022-07-01
[Aパッケージを製造] starts 2022-07-19
note bottom
ここにテキスト
end note
[Aパッケージをテスト] starts 2022-08-01
[Aパッケージを設計] ends 2022-07-15
[Aパッケージをテスト] ends 2022-08-12
[Aパッケージを製造] ends 2022-07-29
[Bパッケージを設計] starts 2022-07-01
[Bパッケージを製造] starts 2022-07-19
[Bパッケージをテスト] starts 2022-08-01
note bottom
ここにテキスト
end note
[Bパッケージを設計] ends 2022-07-15
[Bパッケージをテスト] ends 2022-08-12
[Bパッケージを製造] ends 2022-07-29

@enduml
alt + D でプレビュー表示される。

シーケンス図
@startuml
title シーケンス図
autonumber 1.1
JSP --> Controller: request
autonumber inc A
Controller -> Service: request
Service --> Controller: response
Controller -> Service: request
autonumber inc A
Service  --> Repository: request
autonumber inc A
Repository --> Database: request
autonumber inc A
Database --> Repository: responce
Repository --> Service: responce
Service --> Controller: response
Controller --> JSP: responce
@enduml
alt + D でプレビュー表示される。

他ダイアグラムとして
ユースケース図
クラス図
オブジェクト図
アクティビティ図
コンポーネント図
配置図
状態遷移図(ステートマシン図)
タイミング図
UML以外として使えるもの
JSON data
YAML data
Network diagram (nwdiag)
ワイヤーフレームによるグラフィカルインターフェース、UIモックアップ(salt)
アーキテクチャ図
仕様及び記述言語 (SDL)
Ditaa
ガントチャート
マインドマップ
WBS図(作業分解図)
AsciiMath や JLaTeXMath による、数学的記法
ER図
画像としてエクスポート
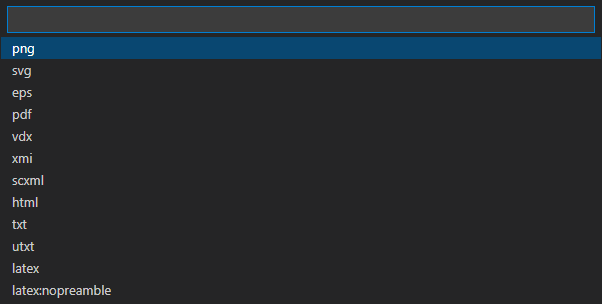
ファイル内のダイアグラムをエクスポートを選択
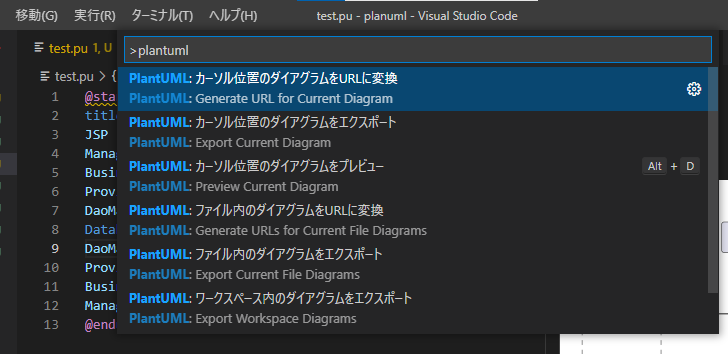
PNG を選択
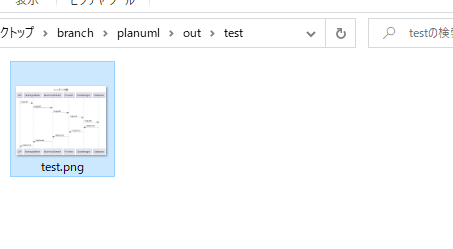
しばらくすると、以下の通知が出てくる。
実際のディレクトリには画像として保存してあるので、これをExcel等で説明資料や設計資料として扱えます。