tags: rBasicLearning
Summary()の使い方
使用するデータ
今回は, データとしてirisを使う.
library(datasets)
iris
Summary()を使う場合
Summary()は, データの概観を数値で見たい時に使う.
質的データのSummary()
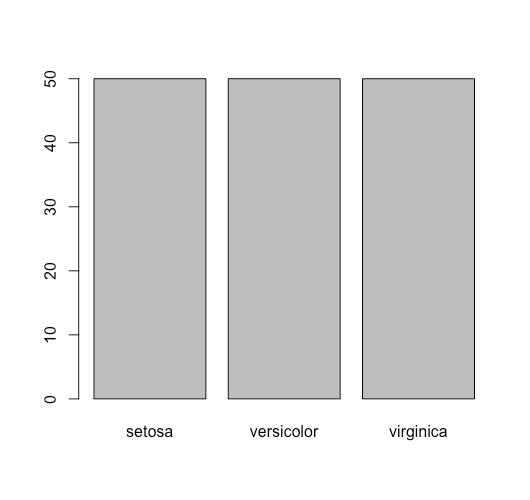
質的データのSummary()は, その変数ごとにどれくらいの度数が入っているかを数値で見ることができる.
視覚的に見たい時は, 棒グラフ(barplot)を使う.
summary(iris$Species)       # Categorical variable

> summary(iris$Species)       # Categorical variable
    setosa versicolor  virginica
        50         50         50
irisSpecies <- table(iris$Species)
barplot(irisSpecies)
量的データのSummary()
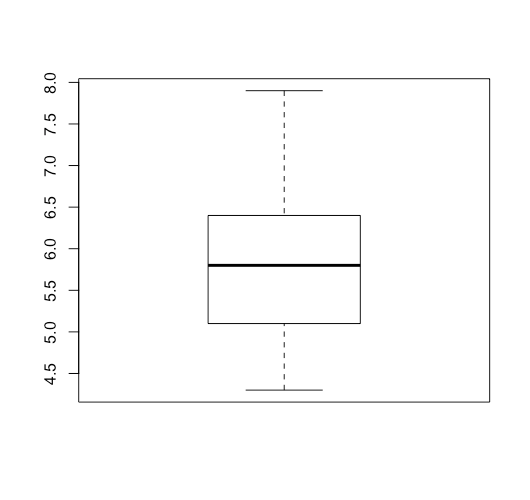
量的データのSummary()は, 最大値, 最小値, メジアン, 四分位数, 平均の数値を見ることができる.
これを視覚的に見たい時は, 箱ひげ図(boxplot)を使う.
summary(iris$Sepal.Length)  # Quantitative variable

> summary(iris$Sepal.Length)  # Quantitative variable
   Min. 1st Qu.  Median    Mean 3rd Qu.    Max.
  4.300   5.100   5.800   5.843   6.400   7.900
boxplot(iris$Sepal.Length)
全体のSummary()
全体でSummary()を見ると, 以下のようになる.
今回は, 最大値, 最小値, メジアン, 四分位数, 平均の数値を見ることができる.
summary(iris)               # Entire data frame
> summary(iris)               # Entire data frame
  Sepal.Length    Sepal.Width     Petal.Length    Petal.Width          Species
 Min.   :4.300   Min.   :2.000   Min.   :1.000   Min.   :0.100   setosa    :50
 1st Qu.:5.100   1st Qu.:2.800   1st Qu.:1.600   1st Qu.:0.300   versicolor:50
 Median :5.800   Median :3.000   Median :4.350   Median :1.300   virginica :50
 Mean   :5.843   Mean   :3.057   Mean   :3.758   Mean   :1.199
 3rd Qu.:6.400   3rd Qu.:3.300   3rd Qu.:5.100   3rd Qu.:1.800
 Max.   :7.900   Max.   :4.400   Max.   :6.900   Max.   :2.500