tags: rBasicLearning Rplot Beginner 初心者向け
Rのplot()について
Rのplot()についてまとめました!
宜しければ, 使ってください!
plot()は, データの種類ごとに異なった図を表示する.
使用するデータセット
今回は, irisのデータセットを使用します.
library(datasets)
iris
質的データ
質的変数は以下のような棒グラフのような図が表示される.
plot(iris$Species) # Categorical variable

量的データ
量的変数は以下のような散布図が表示される.
plot(iris$Petal.Length) # Quantitative variable

質的データと量的データ
質的データをx軸量的データをy軸に置くと, 以下のような図になる.
plot(iris$Species, iris$Petal.Width) # Cat x quant

両方量的データ
両方量的データの場合は, 以下のような散布図になる.
plot(iris$Petal.Length, iris$Petal.Width) # Quant pairquant

plot(x)だけ
plot(x)だけの時は, 変数ごとの全体のグラフの概観をみれる.
plot(iris) # Entire data framepairquant

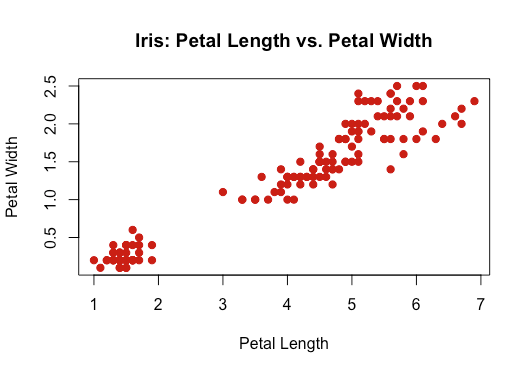
グラフを整える
点の色, 点の大きさ, グラフのタイトル, x軸ラベル, y軸ラベルは, 以下のように指定する.
# Plot with options
plot(iris$Petal.Length, iris$Petal.Width,
  col = "#cc0000",  # Hex code for datalab.cc red
  pch = 19,         # Use solid circles for points
  main = "Iris: Petal Length vs. Petal Width",
  xlab = "Petal Length",
  ylab = "Petal Width")
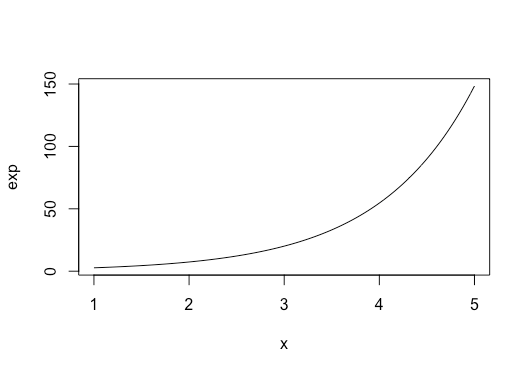
数式の公式も範囲指定でプロット
数式も範囲指定でプロットすることができる.
今回は, コサイン・exp・正規分布のグラフをプロットした.
plot(cos, 0, 2*pi)
plot(exp, 1, 5)
plot(dnorm, -3, +3)


正規分布で出力
正規分布でラインに色をつけ, 太さも太くして, プロットしてみた.
# Formula plot with options
plot(dnorm, -3, +3,
  col = "#cc0000",
  lwd = 5,
  main = "Standard Normal Distribution",
  xlab = "z-scores",
  ylab = "Density")
