現場では、Charjsを使用して、グラフを描いています。
勉強ノードをメモします。
Chart.jsの公式サイト:https://www.chartjs.org/
Chartjsを導入する方法:
- CDNで
<script src="https://cdnjs.cloudflare.com/ajax/libs/Chart.js/2.7.1/Chart.min.js"></script>
- インストール
開発ディレクトリ内、npmで下記のコマンドでインストールする。
(スタンドアロン版、バンドル版両方インストールされる)
$ npm install chart.js --save
下記のnode_modulesモジュールとpacage-lock.jsonパッケージが生成される
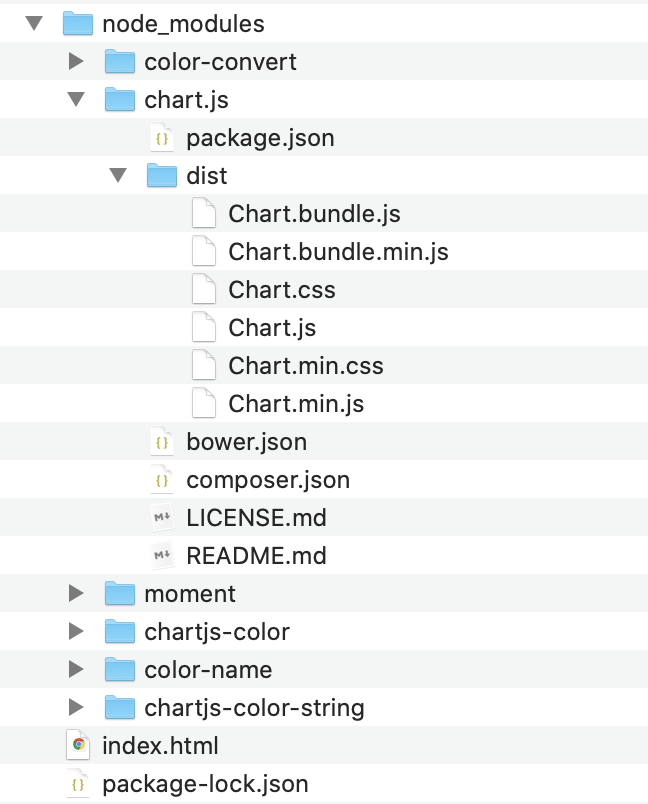
スタンドアロン版とバンドル版
スタンドアロン版
ファイル:
dist/Chart.js
dist/Chart.min.js
(時間軸を使用したい場合は、Moment.jsをインストールする必要)
バンドル版(時間軸を使用可。Moment.jsインストール不要。)
ファイル:
dist/Chart.bundle.js
dist/Chart.bundle.min.js
必要に応じて、pathを確認、index.htmlファイルに導入する。例えば:Chart.js
<script src="node_modules/chart.js/dist/Chart.js"></script>
以上の設定は準備でしたら、例のコードを練習します。
index.html
<!DOCTYPE html>
<html lang="en">
<head>
    <meta charset="UTF-8">
    <meta name="viewport" content="width=device-width, initial-scale=1.0">
    <title>Document</title>
    <!-- 外部スクリプト方法 -->
    <!-- <script src="https://cdnjs.cloudflare.com/ajax/libs/Chart.js/2.7.1/Chart.min.js"></script> -->
    <!-- インストール方法 -->
    <script src="node_modules/chart.js/dist/Chart.js"></script>
</head>
<body>
    <p>chart_</p>
    <!-- canvas要素を設置 -->
    <canvas id="myChart" width="400" height="400"></canvas>
    <script>
        // 要素またはコンテキストを取得
        var ctx = document.getElementById("myChart");
        // チャートタイプをインスタンスかする
        var myChart = new Chart(ctx, {
            // 棒グラフ
            type: 'bar',
            // データを設置
            data: {
                // データのラベル
                labels: ["Red", "Blue", "Yellow", "Green", "Purple", "Orange"],
                datasets: [{
                    // 凡例
                    label: '# of Votes',
                    // データの量
                    data: [12, 19, 3, 5, 2, 3],
                    // 各データの色
                    backgroundColor: [
                        'rgba(255, 99, 132, 0.2)',
                        'rgba(54, 162, 235, 0.2)',
                        'rgba(255, 206, 86, 0.2)',
                        'rgba(75, 192, 192, 0.2)',
                        'rgba(153, 102, 255, 0.2)',
                        'rgba(255, 159, 64, 0.2)'
                    ],
                    // 棒枠色
                    borderColor: [
                        'rgba(255,99,132,1)',
                        'rgba(54, 162, 235, 1)',
                        'rgba(255, 206, 86, 1)',
                        'rgba(75, 192, 192, 1)',
                        'rgba(153, 102, 255, 1)',
                        'rgba(255, 159, 64, 1)'
                    ],
                    // 棒枠線の厚さ
                    borderWidth: 1
                }]
            },
            // オプション
            options: {
                // スケール設定
                scales: {
                    // 縦スケールを設定
                    yAxes: [{
                        ticks: {
                            // ゼロから表示
                            beginAtZero:true
                        }
                    }]
                }
            }
        });
        </script>
</body>
</html>