やりたいこと
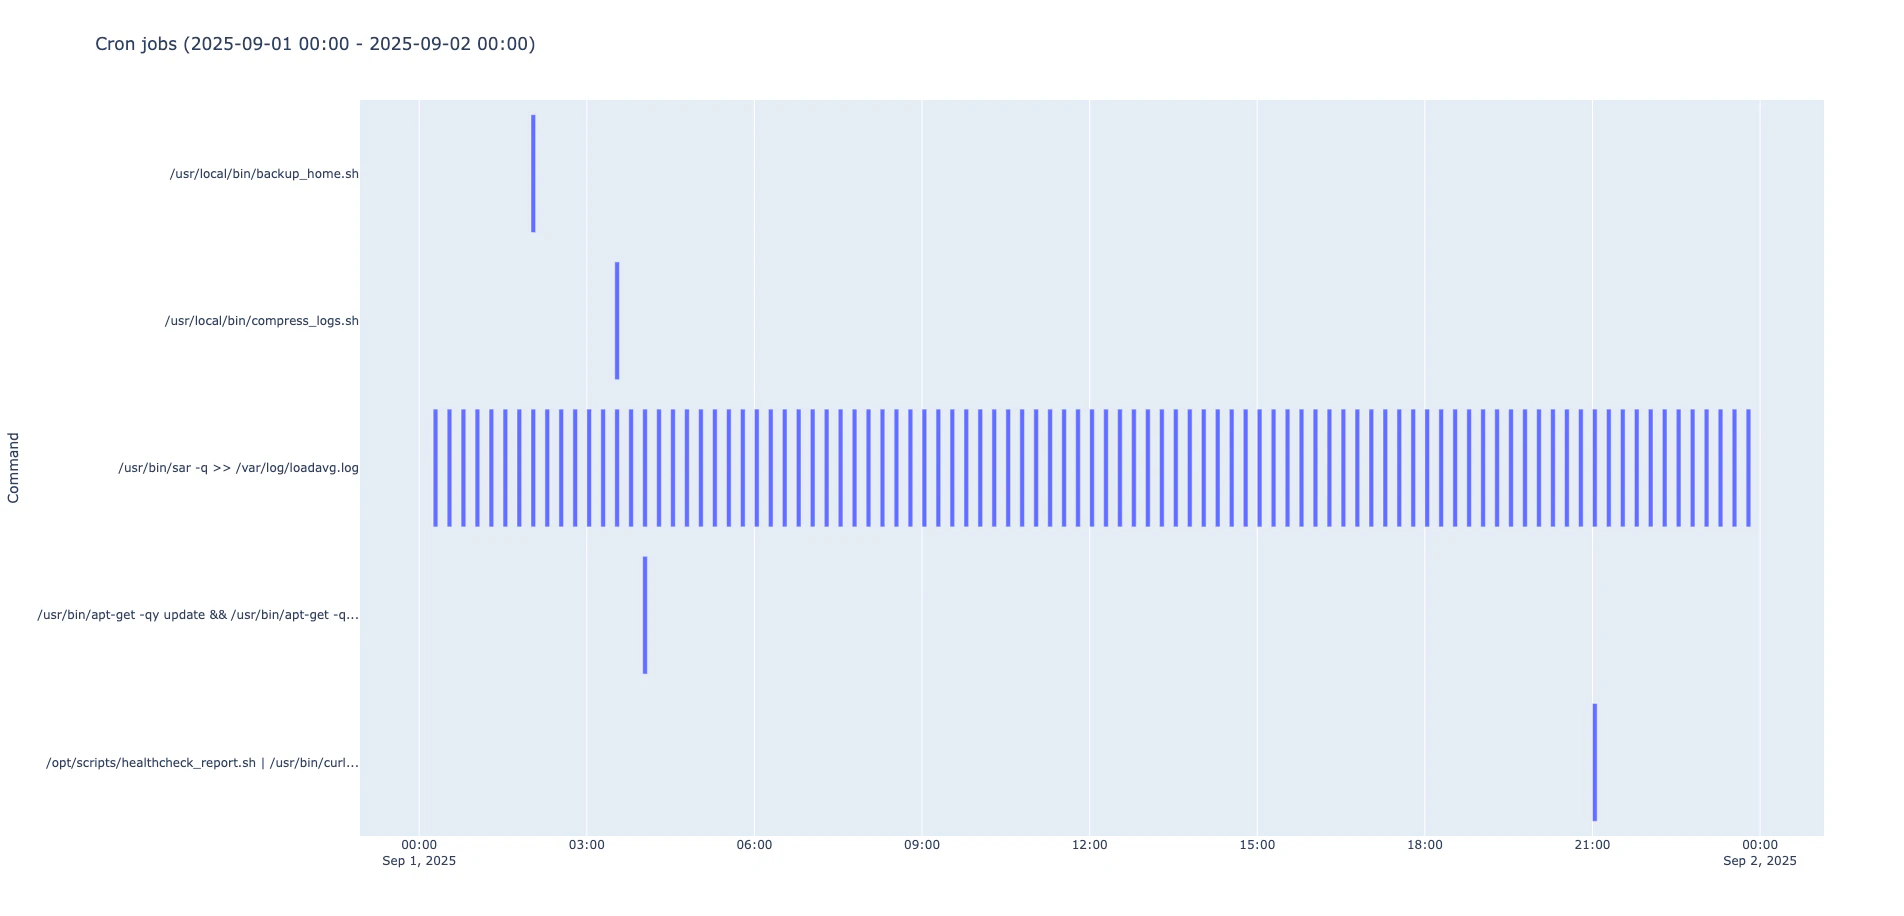
以下のような crontab ファイルがあるとします。この cron のスケジュールをガントチャートのような図で可視化したいです。
crontab -l
@reboot /usr/local/bin/reboot.sh
0 2 * * *     /usr/local/bin/backup_home.sh
30 3 * * 1    /usr/local/bin/compress_logs.sh
*/15 * * * *  /usr/bin/sar -q >> /var/log/loadavg.log
0 4 1 * *     /usr/bin/apt-get -qy update && /usr/bin/apt-get -qy upgrade
0 21 * * *    /opt/scripts/healthcheck_report.sh | \\
              /usr/bin/curl -X POST -d @- https://hooks.slack.com/services/XXXX/YYYY/ZZZ
方法
croniter を使って cron の記述を解釈し、pandas および plotly.py を使って図を描画します。
$ python --version
Python 3.13.4
$ pip install pandas plotly croniter
show_cron.py
import shlex
import subprocess
from datetime import datetime, timedelta
from typing import List, Tuple
from zoneinfo import ZoneInfo

import dateutil
import pandas as pd
import plotly.express as px
from croniter import croniter


def read_crontab() -> str:
    try:
        content = subprocess.check_output(["crontab", "-l"], text=True)

        return content
    except subprocess.CalledProcessError as e:
        # crontab が空の場合。
        if e.returncode == 1:
            return None
        else:
            raise


def parse_crontab(text: str) -> List[Tuple[str, str]]:
    cron_jobs, buf = [], ""

    for raw in text.splitlines():
        line = raw.rstrip()

        # 改行する場合。
        if line.endswith("\\"):
            buf += line[:-1].rstrip() + " "
            continue
        line = buf + line
        buf = ""

        # 空行をスキップする。
        if not line:
            continue

        # コメント行をスキップする。
        if line.lstrip().startswith("#"):
            continue

        # 環境変数を設定する行をスキップする。
        if "=" in line.split()[0]:
            continue

        parts = shlex.split(line, posix=True)

        # @reboot, @hourly などを考慮する。
        if parts[0].startswith("@"):
            schedule, command = parts[0], " ".join(parts[1:])
        else:
            schedule, command = " ".join(parts[:5]), " ".join(parts[5:])

        cron_jobs.append((schedule, command))

    return cron_jobs


def truncate(string: str, length: int, ellipsis: str = "...") -> str:
    return string[:length] + (ellipsis if string[length:] else "")


def convert_cron_jobs_to_df(
    cron_jobs: List[Tuple[str, str]],
    start_dt: datetime,
    end_dt: datetime,
    execution_min_time: int,
) -> pd.DataFrame:
    records = []
    for expr, command in cron_jobs:
        # @reboot, @hourly などは無視する。
        if expr.startswith("@"):
            continue

        itr = croniter(expr, start_dt)
        while True:
            run = itr.get_next(datetime)
            if run >= end_dt:
                break
            records.append(
                dict(
                    Command=truncate(command, 50),
                    Start=run,
                    Finish=run + timedelta(minutes=execution_min_time),
                )
            )

    return pd.DataFrame(records)


def show_figure(df: pd.DataFrame, start_dt: datetime, end_dt: datetime) -> None:
    fig = px.timeline(
        df,
        x_start="Start",
        x_end="Finish",
        y="Command",
        title=f"Cron jobs ({start_dt.strftime('%Y-%m-%d %H:%M')} - {end_dt.strftime('%Y-%m-%d %H:%M')})",
    )
    fig.update_yaxes(autorange="reversed")
    fig.show()


if __name__ == "__main__":
    HOURS = 24
    EXECUTION_MIN_TIME = 5
    START_DT = "2025-09-01"  # 月曜日 (1)

    crontab = read_crontab()
    cron_jobs = parse_crontab(crontab)
    start_dt = dateutil.parser.parse(START_DT).replace(tzinfo=ZoneInfo("Asia/Tokyo"))
    end_dt = start_dt + timedelta(hours=HOURS)
    df = convert_cron_jobs_to_df(cron_jobs, start_dt, end_dt, EXECUTION_MIN_TIME)
    show_figure(df, start_dt, end_dt)