個人メモ
xy平面に存在する、fittingしたいデータにエラーバーが存在する場合のエラーバーフィッティングのやり方をメモ程度に(Gnuplot.jlの文献がわかりずらかったので記述する).
参考URL:https://riptutorial.com/gnuplot/example/27491/fitting-data-with-errors
使用するものは
Julia 1.5.0
Gnuplot.jl
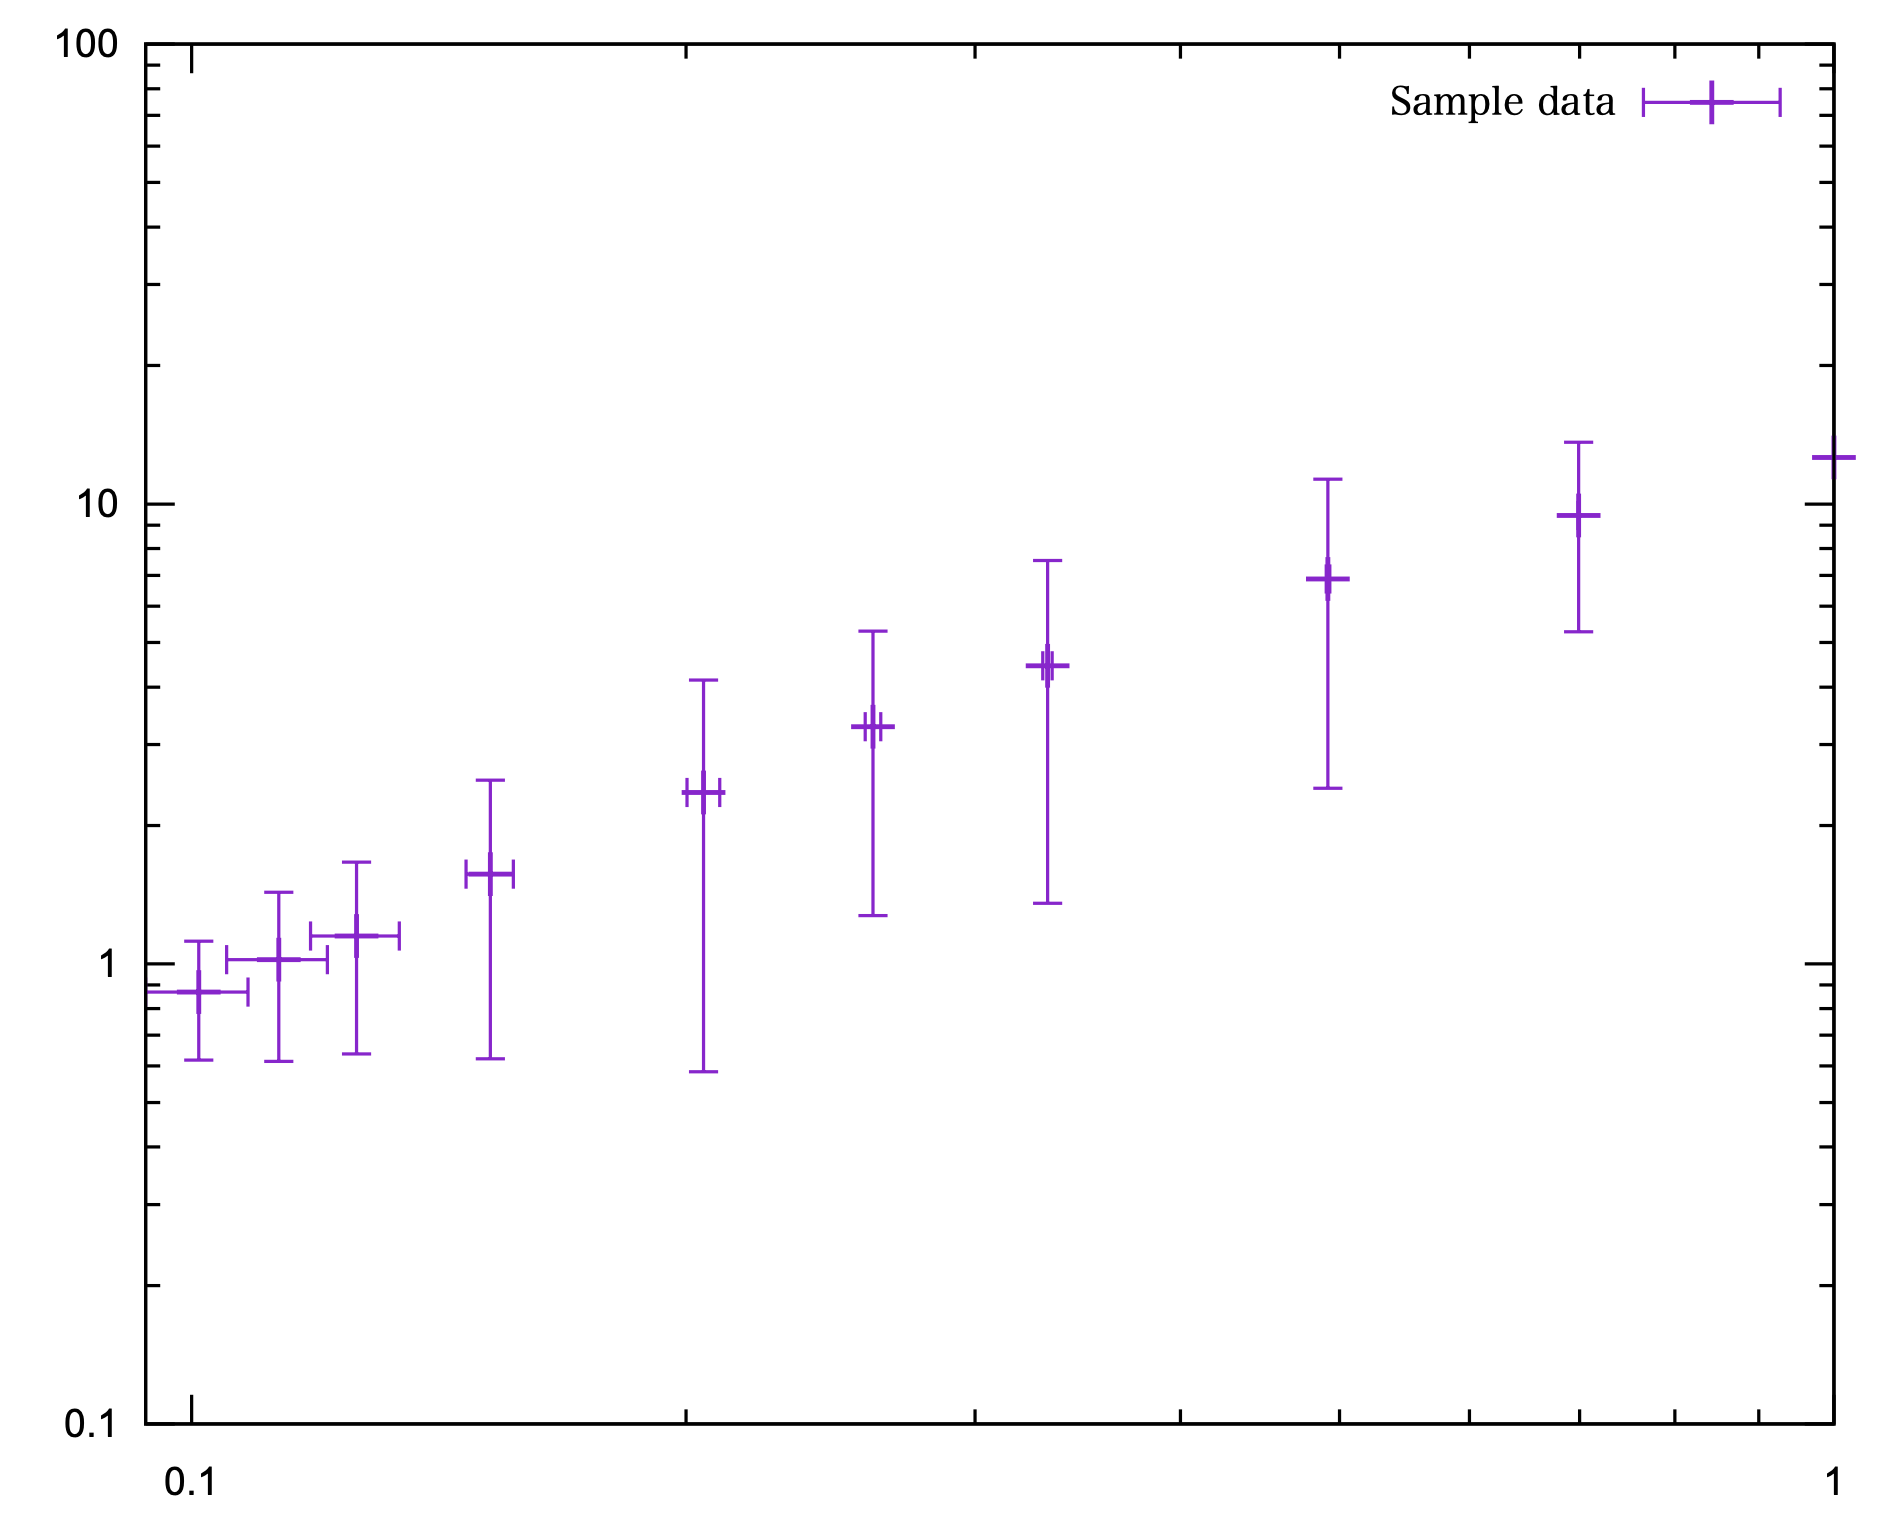
以下のサンプルデータがあったとして
qiita.jl
x = [1.0, 0.699, 0.492, 0.332, 0.26, 0.205, 0.152, 0.126, 0.113, 0.101]
y = [12.629999999999997, 9.446833333333332, 6.870000000000003, 4.446666666666669, 3.2823333333333338, 2.3615, 1.5669999999999997, 1.1508333333333334, 1.0224999999999997, 0.8695000000000002]
xerr = [0.0, 0.0006042022055027993, 0.0011512517321786886, 0.002247965322632335, 0.0028503588298436655, 0.004671390455855099, 0.005048214501530516, 0.007837345552787455, 0.007954572277127921, 0.00723438424981115]
yerr = [2.0e-5, 4.169928653076862, 4.45897153149065, 3.092209273657006, 2.007596983888329, 1.7789611327582189, 0.9446893489934641, 0.5132322521361732, 0.4083804308132142, 0.2517309567301392]
qiita.jl
using Gnuplot
@gp x y xerr yerr "w xyerrorbars ps 1.5 t '{/Latex Sample data}'"
@gp :- "set logscale x"
@gp :- "set logscale y"
従来のfitting
qiita.jl
name = "\$ samplingdata"
@gp    "f(x) = a*x**b"      # define an analytical model
@gp :-   "a=1" "b=1"     # set parameter initial values
@gp :- name=>(x, y)             # define a named dataset
@gp :- "fit f(x) $name via a,b;"    # fit the data
*******************************************************************************
Fri Oct 23 02:37:30 2020


FIT:    data read from $ c3scaling
        format = z
        #datapoints = 10
        residuals are weighted equally (unit weight)

function used for fitting: f(x)
	f(x) = a*x**b
fitted parameters initialized with current variable values

iter      chisq       delta/lim  lambda   a             b
   0 2.8764613569e+02   0.00e+00  3.76e-01    1.000000e+00   1.000000e+00
   6 1.3060759013e+00  -2.93e-02  3.76e-07    1.307892e+01   1.031668e+00

After 6 iterations the fit converged.
final sum of squares of residuals : 1.30608
rel. change during last iteration : -2.93426e-07

degrees of freedom    (FIT_NDF)                        : 8
rms of residuals      (FIT_STDFIT) = sqrt(WSSR/ndf)    : 0.404054
variance of residuals (reduced chisquare) = WSSR/ndf   : 0.163259

Final set of parameters            Asymptotic Standard Error
=======================            ==========================
a               = 13.0789          +/- 0.3547       (2.712%)
b               = 1.03167          +/- 0.04416      (4.28%)

correlation matrix of the fit parameters:
                a      b
a               1.000
b               0.583  1.000
エラーバーつきfitting
qiita.jl
name = "\$ samplingdata"
@gp    "f(x) = a*x**b"      # define an analytical model
@gp :-   "a=1" "b=1"     # set parameter initial values
@gp :- name=>(x, y, xerr, yerr)             # define a named dataset
@gp :- "fit f(x) $name xyerrors via a,b;"    # fit the data
*******************************************************************************
Fri Oct 23 02:36:19 2020


FIT:    data read from $ c3scaling xyerrors
        format = z:s
        #datapoints = 10
function used for fitting: f(x)
	f(x) = a*x**b
fitted parameters initialized with current variable values

iter      chisq       delta/lim  lambda   a             b
   0 3.3814225003e+11   0.00e+00  1.12e+04    1.000000e+00   1.000000e+00
   7 3.8514486446e-01  -8.32e-02  1.12e-03    1.263000e+01   1.144262e+00

After 7 iterations the fit converged.
final sum of squares of residuals : 0.385145
rel. change during last iteration : -8.31863e-07

degrees of freedom    (FIT_NDF)                        : 8
rms of residuals      (FIT_STDFIT) = sqrt(WSSR/ndf)    : 0.219415
variance of residuals (reduced chisquare) = WSSR/ndf   : 0.0481431
p-value of the Chisq distribution (FIT_P)              : 0.999951

Final set of parameters            Asymptotic Standard Error
=======================            ==========================
a               = 12.63            +/- 4.388e-06    (3.475e-05%)
b               = 1.14426          +/- 0.01899      (1.66%)

correlation matrix of the fit parameters:
                a      b
a               1.000
b               0.000  1.000

エラーを考慮したフィッティング大事