きっかけと概要
数学を教えるときに、
S =\int_{0}^{3}\{f(x)-g(x)\}dx
とか積分して面積を求めることがありますが、
これをなんとか可視化できんかいな?
って思ってやってみました。備忘録です。
ソースコード
python3
import numpy as np
import matplotlib.pyplot as plt

# y = x**2
def mkdata(n):
  np.random.seed(0)
  px = []
  py = []
  for i in range(n):
    x = np.random.random()
    y = np.random.random()

    # y = x**2 未満の時プロット
    if y < x**2:
      px.append(x)
      py.append(y)

  return px, py

### 散布図を描く ###
# 発生させる乱数の個数:10000
# 点の大きさ:1
plt.scatter(*mkdata(10000), s=1, c="red")

# y = x**2のグラフを重ねて描く
xrange = np.arange(0, 1, 0.01)
plt.plot(xrange, xrange**2)

plt.show()
散布図グラフ描画
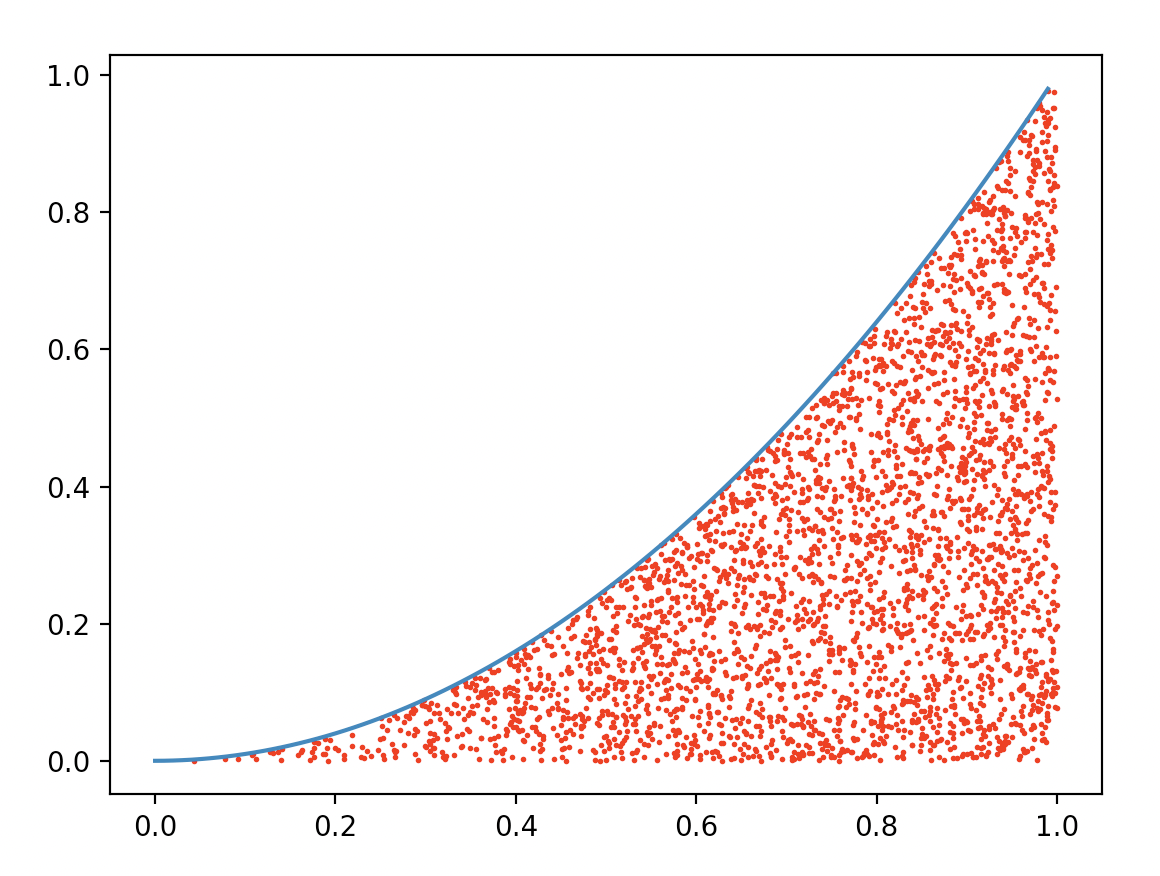
ハイ、こんな感じで面積がわかりまーす。