とりあえず2次元描画
( x, y ) 座標で平面ベクトルを表示してみた
ソースコード
python3
import numpy as np
import matplotlib.pyplot as plt

# 座標設定関数
def coordinate(axes, range_x, range_y, grid = True,
               xyline = True, xlabel = "x", ylabel = "y"):
    axes.set_xlabel(xlabel, fontsize = 16)
    axes.set_ylabel(ylabel, fontsize = 16)
    axes.set_xlim(range_x[0], range_x[1])
    axes.set_ylim(range_y[0], range_y[1])
    if grid == True:
        axes.grid()
    if xyline == True:
        axes.axhline(0, color = "gray")
        axes.axvline(0, color = "gray")

# ベクトル描画関数
def visual_vector(axes, loc, vector, color = "red"):
    axes.quiver(loc[0], loc[1],
              vector[0], vector[1], color = color,
              angles = 'xy', scale_units = 'xy', scale = 1)

# FigureとAxes
fig = plt.figure(figsize = (5, 5))
ax = fig.add_subplot(111)

# 座標を設定
coordinate(ax, [-3, 3], [-3, 3])

# ベクトルv,wを定義
v = np.array([2, 1])
w = np.array([-1, 1])

# [0,0]を始点にvを描画(赤)
visual_vector(ax, [0, 0], v, "red")

# vの終点を始点にwを描画(青)
visual_vector(ax, v, w, "blue")

# [0,0]を始点にv+wを描画(ベクトルの和=緑)
visual_vector(ax, [0, 0], v + w, "green")

plt.show()
描画結果
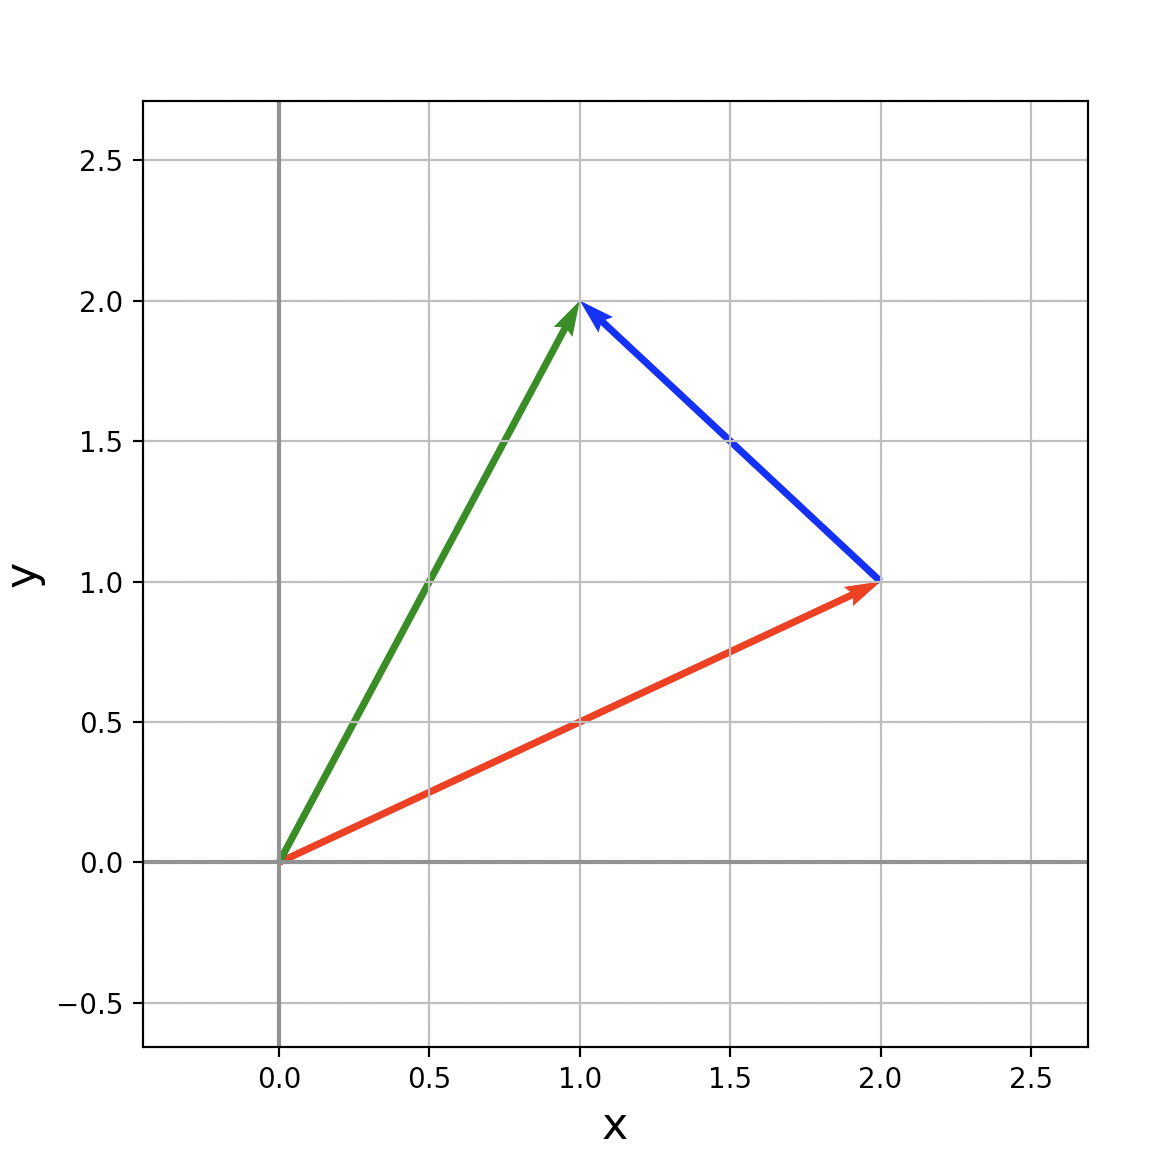
\vec{a} + \vec{b} = \vec{c} \\

\left(\!
    \begin{array}{c}
      2 \\
      0
    \end{array}
  \!\right) +
\left(\!
    \begin{array}{c}
      -1 \\
      1
    \end{array}
  \!\right) =
\left(\!
    \begin{array}{c}
      1 \\
      1
    \end{array}
  \!\right)
こんな感じに描画できました。
そこで、3次元にも挑戦!!!
3次元ベクトル
ソースコード
python3
import numpy as np
import matplotlib.pyplot as plt

# 3D座標設定関数
def coordinate_3d(axes, range_x, range_y, range_z, grid = True):
    axes.set_xlabel("x", fontsize = 16)
    axes.set_ylabel("y", fontsize = 16)
    axes.set_zlabel("z", fontsize = 16)
    axes.set_xlim(range_x[0], range_x[1])
    axes.set_ylim(range_y[0], range_y[1])
    axes.set_zlim(range_z[0], range_z[1])
    if grid == True:
        axes.grid()

# 3Dベクトル描画関数
def visual_vector_3d(axes, loc, vector, color = "red"):
    axes.quiver(loc[0], loc[1], loc[2],
              vector[0], vector[1], vector[2],
              color = color, length = 1,
              arrow_length_ratio = 0.2)

# FigureとAxes
fig = plt.figure(figsize = (10, 10))
ax = fig.add_subplot(111, projection='3d')

# 3D座標を設定
coordinate_3d(ax, [-10, 10], [-10, 10], [-10, 10], grid = True)

# 始点を設定
loc = [-7.5, -7.5, -10.0]

# 3Dベクトルを定義
v = [14.5, 15.5, 18.0]

# 3Dベクトルを配置
visual_vector_3d(ax, loc, v, "red")
plt.show()
じゃ描画結果

始点を
\left(\!
    \begin{array}{c}
      -7.5 \\
      -7.5 \\
      -10.0
    \end{array}
  \!\right)
ベクトルは
\left(\!
    \begin{array}{c}
      14.5 \\
      15.5 \\
      18.0
    \end{array}
  \!\right)
終点を
\left(\!
    \begin{array}{c}
      7.0 \\
      8.0 \\
      8.0
    \end{array}
  \!\right)
にしてみました。なんかそれっぽくなりました。