平面座標で円を描く
X-Y平面上に点をプロットすることはできますが、円を描くことはどうでしょうか。
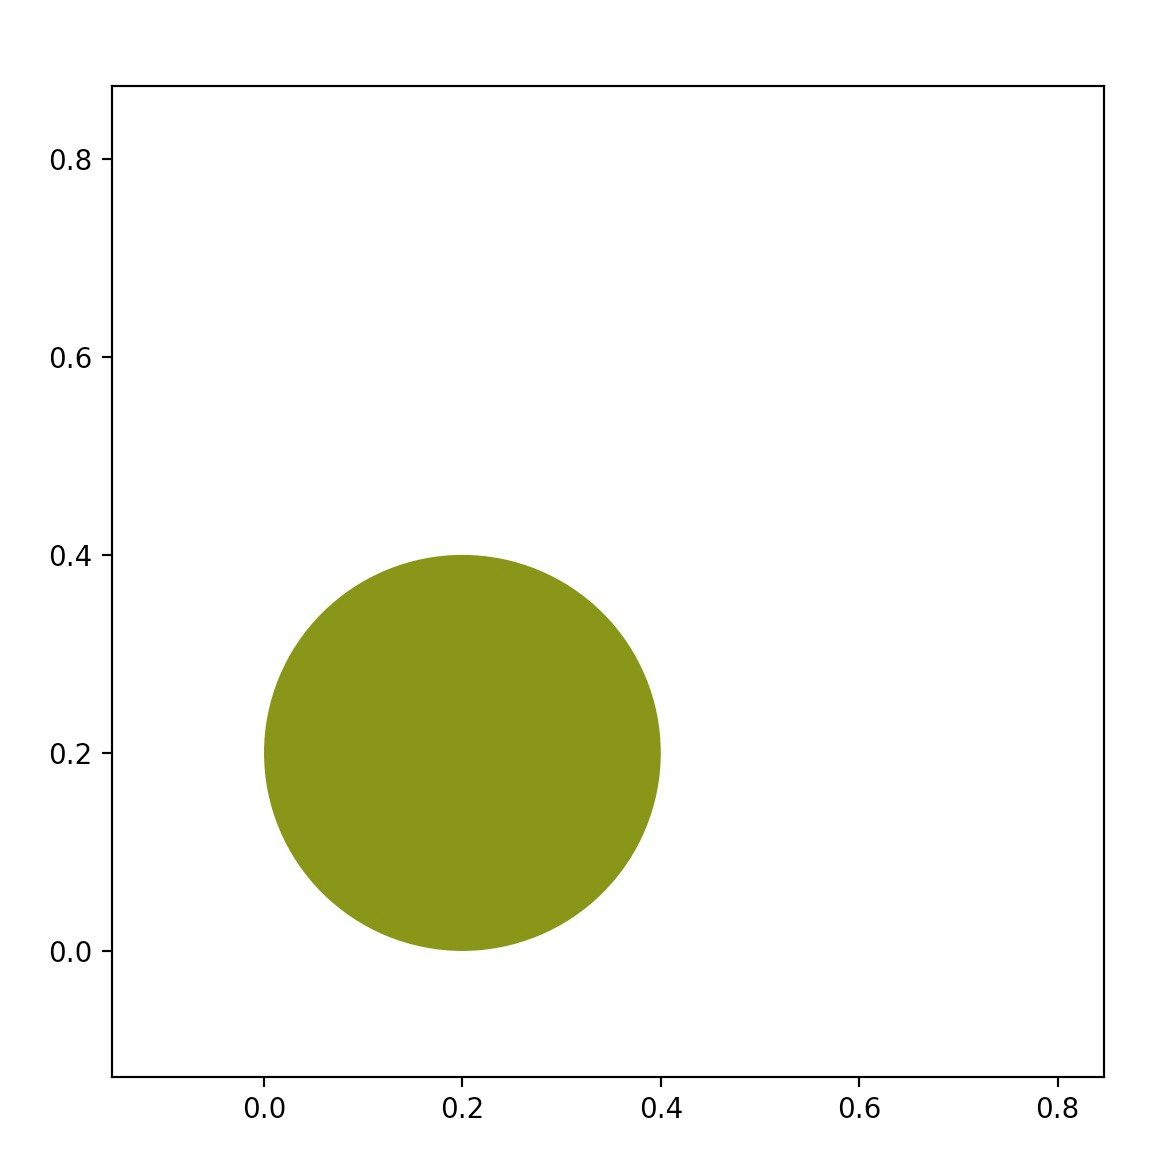
こんなふうに円の描画をすることができます。
matplotlibを使用して描いてみます。
xyPlotCircle.py
import matplotlib
import matplotlib.pyplot as plt

fig = plt.figure()
ax = fig.add_subplot(1,1,1)

# 中心を (x, y) = (0.2, 0.2)に設定
#  半径0.2の円を描画
circle = plt.Circle((0.2, 0.2), 0.2, fc="#778800")
ax.add_patch(circle)

plt.show()
以上です。
・参考サイト
matplotlib.pyplot について[英文]