1
1

Delete article

Deleted articles cannot be recovered.

Draft of this article would be also deleted.

Are you sure you want to delete this article?

More than 3 years have passed since last update.

PyCharmでmatplotlibのグラフ出力

Posted at

PyCharmで散布図の描画

PythonのIDE(統合開発環境)である
PyCharmを使ってmatplotlibのグラフを出力します。
そのために最後にplt.show()メソッドを実行します。
これがなければ出力はされませんのでお気をつけください。

(PyCharmのインストール等の情報はページ下へございます)
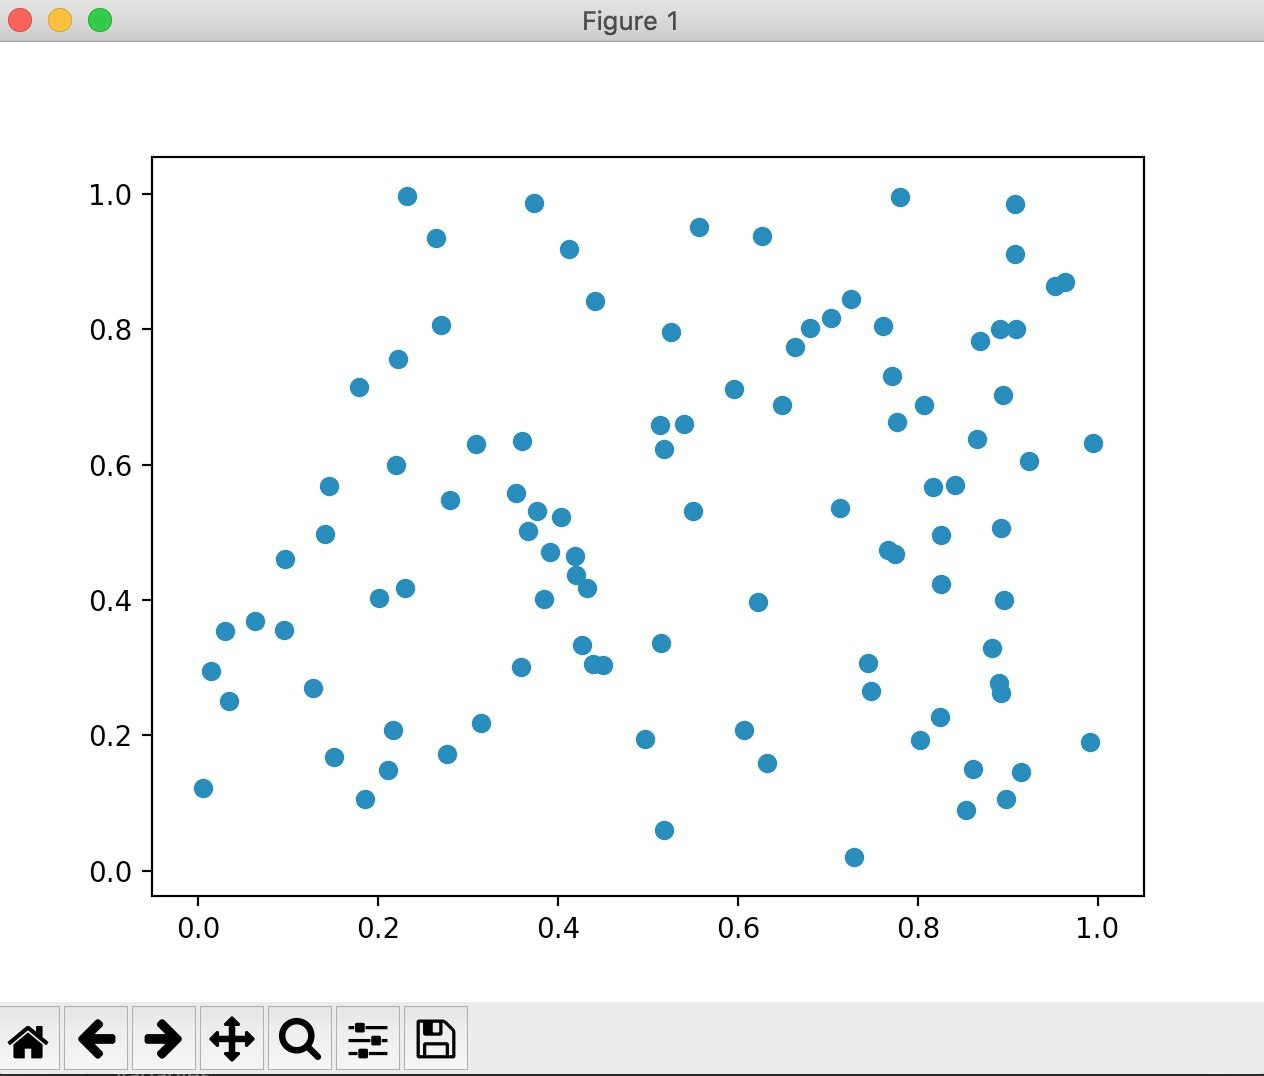
スクリーンショット 2020-06-13 23.33.06.jpg

Python サンプルコード
plotShow.py
import numpy as np
import matplotlib.pyplot as plt

# 乱数を発生させる
x = np.random.rand(100)
y = np.random.rand(100)

# 散布図を描画
plt.scatter(x,y)
plt.show()
1
1
0

Register as a new user and use Qiita more conveniently

  1. You get articles that match your needs
  2. You can efficiently read back useful information
  3. You can use dark theme
What you can do with signing up
1
1

Delete article

Deleted articles cannot be recovered.

Draft of this article would be also deleted.

Are you sure you want to delete this article?