FUN(X[[i]], ...) で: 強制変換により NA が生成されました
状況:qPCRの結果をグラフで描画しようとしている。
エラー:FUN(X[[i]], ...) で: 強制変換により NA が生成されました
wrong code
# グラフの大元
p <- ggplot()  +
    theme(
          axis.title = element_text( size = 15),
          axis.text = element_text(size = 15),
          panel.grid.major.x = element_blank(),
          panel.grid.minor.x = element_blank()
        )

# 描画します
p +
  ggtitle("title")  + #タイトル
  geom_point(
    data = df, #使用するデータフレーム (列名:temperature, cps_mL, time)
    aes(x=as.numeric(temperature), y = as.numeric("cps_[mL]"), #ここにバグ
        color = time)
  ) +
  scale_y_log10(limits = c(10^5,100000000), labels = label_log(digits = 2), minor_breaks = minor_breaks_log)
原因:列名を間違えて記載していた。
データフレームの列名を"cps_mL"に変更したのを忘れて、前の列名(" 'cps_[mL]' ")のままにしていた。
修正
p + ... +
  geom_point(
    aes(x=as.numeric(temperature), y = as.numeric(cps_mL), #ここにバグ
        color = time)
  ) + ...
グラフのエラーバーがなぜか表示されない
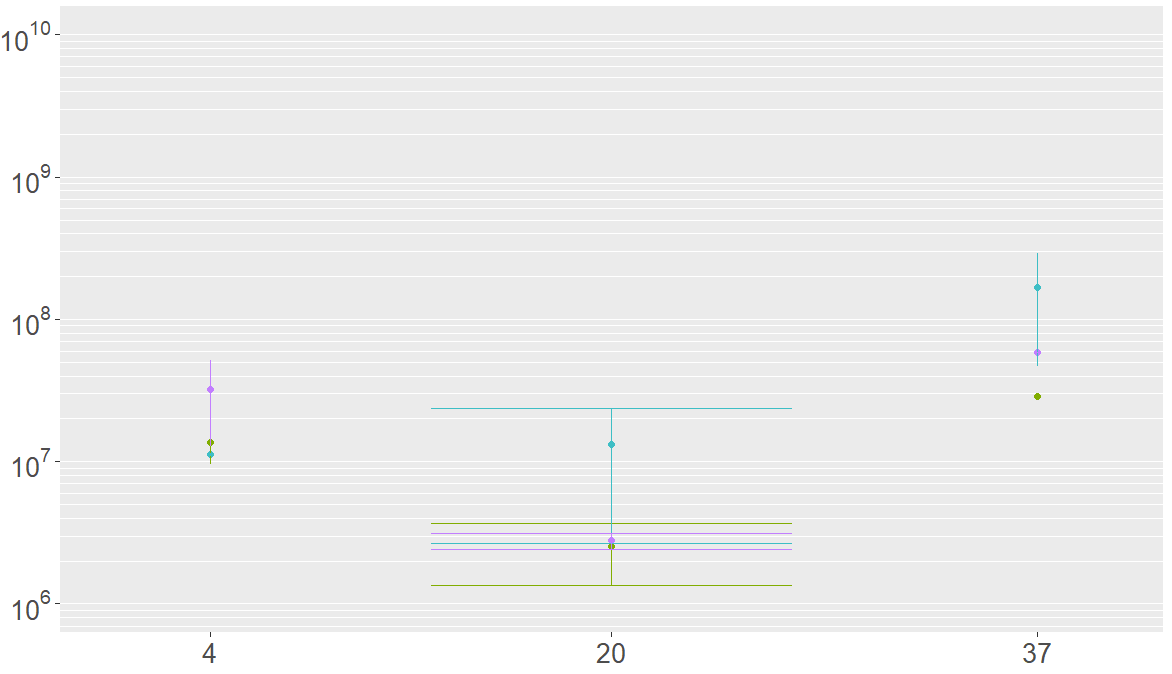
困りごと:本来は真ん中のようにエラーバーが表示されるはずだ。しかし、左右のプロット(x=4, 37)に対してエラーバーの横棒が表示されていない。縦棒だけになっている。
原因:グラフのx軸の描画範囲(=c(0,40)) に対して、エラーバーの横棒が収まらなかったため描画されなかった。
対処:エラーバーの横幅を短くする。描画範囲を広くすることも可能だが、そもそもエラーバーの幅が広すぎると感じたので横幅を短くする方法を選んだ。
元凶のコード:
bad
ggplot()  +
  # グラフの設定
  theme(
    axis.title = element_text( size = 15),
    axis.text = element_text(size = 15),
    panel.grid.major.x = element_blank(),
    panel.grid.minor.x = element_blank()
  )+
  #### 元凶部分 (limits = c(0,40)) ####
  scale_x_continuous(limits = c(0, 40), breaks=c(4,20,37),minor_breaks = seq(0,40,5), labels=c(4,20,37)) +
  ####################################
  scale_y_log10( ... ) +

  # 散布図
  geom_point(
    data = df,
    aes(x=as.numeric(temperature), y = as.numeric(cps_mL), color = time)
  ) +
  # エラーバー
  geom_errorbar(
    data = df,
    aes(
      x=as.numeric(temperature),
      y = as.numeric(cps_mL),
      ymin=ymin,
      ymax =ymax,
      color = time)
    )
修正コード:
修正
ggplot()  +
  # グラフの設定
  theme( ... )+
  #### 元凶部分だけど残す ####
  scale_x_continuous(limits = c(0, 40), breaks=c(4,20,37),minor_breaks = seq(0,40,5), labels=c(4,20,37)) +
  ###########################

  scale_y_log10( ... ) +

  # 散布図
  geom_point( ... ) +
  # エラーバー
  geom_errorbar(
    data = df,
    aes(
      x=as.numeric(temperature),
      y = as.numeric(cps_mL),
      ymin=ymin,
      ymax =ymax,
      color = time,
      width = 0.7) ##### この行を追加 #####
    )
修正結果:ちゃんと表示されるようになりましたとさ。
