About
・学習結果をグラフとして表示
・指数移動平均を利用してなめらかな曲線に
学習
history = model.fit_generator(
      train_generator,
      steps_per_epoch=200,
      epochs=100,
      validation_data=validation_generator,
      validation_steps=40)
学習結果
Epoch 1/100
200/200 [==============================] - 649s 4s/step - loss: 0.6224 - acc: 0.6493 - val_loss: 0.6120 - val_acc: 0.6680
Epoch 2/100
200/200 [==============================] - 617s 3s/step - loss: 0.6214 - acc: 0.6542 - val_loss: 0.6594 - val_acc: 0.6135
Epoch 3/100
200/200 [==============================] - 612s 3s/step - loss: 0.6179 - acc: 0.6478 - val_loss: 0.6103 - val_acc: 0.6630
Epoch 4/100
200/200 [==============================] - 617s 3s/step - loss: 0.6155 - acc: 0.6584 - val_loss: 0.5985 - val_acc: 0.6845
Epoch 5/100
200/200 [==============================] - 610s 3s/step - loss: 0.6146 - acc: 0.6579 - val_loss: 0.6276 - val_acc: 0.6480
.
.
.
Epoch 96/100
200/200 [==============================] - 630s 4s/step - loss: 0.4625 - acc: 0.7782 - val_loss: 0.4746 - val_acc: 0.7675
Epoch 97/100
200/200 [==============================] - 630s 4s/step - loss: 0.4638 - acc: 0.7726 - val_loss: 0.4666 - val_acc: 0.7750
Epoch 98/100
200/200 [==============================] - 629s 4s/step - loss: 0.4592 - acc: 0.7822 - val_loss: 0.4817 - val_acc: 0.7580
Epoch 99/100
200/200 [==============================] - 642s 4s/step - loss: 0.4638 - acc: 0.7792 - val_loss: 0.4694 - val_acc: 0.7705
Epoch 100/100
200/200 [==============================] - 646s 4s/step - loss: 0.4593 - acc: 0.7762 - val_loss: 0.4908 - val_acc: 0.7510
グラフ化
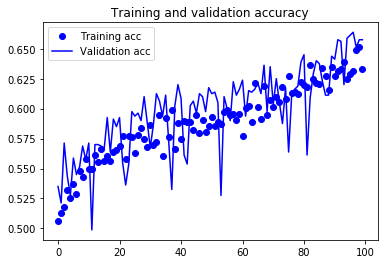
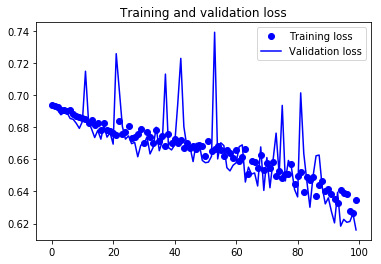
上記の学習の場合をグラフ化してみる
import matplotlib.pyplot as plt

acc = history.history['acc']
val_acc = history.history['val_acc']
loss = history.history['loss']
val_loss = history.history['val_loss']

epochs = range(len(acc))

plt.plot(epochs, acc, 'bo', label='Training acc')
plt.plot(epochs, val_acc, 'b', label='Validation acc')
plt.title('Training and validation accuracy')
plt.legend()

plt.figure()

plt.plot(epochs, loss, 'bo', label='Training loss')
plt.plot(epochs, val_loss, 'b', label='Validation loss')
plt.title('Training and validation loss')
plt.legend()
history
history には辞書型で 'val_loss'、'val_acc'、'loss'、'acc' が入っている
print(history.history)
上記のようにhistoryを表示させると下記のように損失と精度がわかる
{'val_loss': [0.6830029487609863], 'val_acc': [0.550000011920929], 'loss': [0.6909741759300232], 'acc': [0.75]}
グラフの色と形の指定
'b' 青の直線
'bo' 青のドット
'r' 赤の直線
'ro' 赤のドット
グラフ表示
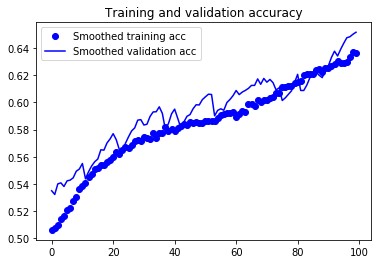
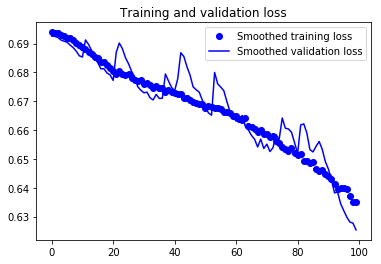
エポック数が多いとごちゃごちゃしやすい
もっとなめらかになるようには次のコードを使う
指数移動平均を使ったグラフ表示
指数移動平均とは?
簡単に言うと、直近のデータにより比重を置いて描画すること
def smooth_curve(points, factor=0.8):
  smoothed_points = []
  for point in points:
    if smoothed_points:
      previous = smoothed_points[-1]
      smoothed_points.append(previous * factor + point * (1 - factor))
    else:
      smoothed_points.append(point)
  return smoothed_points

plt.plot(epochs,
         smooth_curve(acc), 'bo', label='Smoothed training acc')
plt.plot(epochs,
         smooth_curve(val_acc), 'b', label='Smoothed validation acc')
plt.title('Training and validation accuracy')
plt.legend()

plt.figure()

plt.plot(epochs,
         smooth_curve(loss), 'bo', label='Smoothed training loss')
plt.plot(epochs,
         smooth_curve(val_loss), 'b', label='Smoothed validation loss')
plt.title('Training and validation loss')
plt.legend()

plt.show()
追加された部分はdef smooth_curveのところだけ
この関数は何をやっているか上から順番に説明します
for point in points: 観測した点を一つずつ出す
if smoothed_points: リストsmoothed_pointsに観測点があるなら
previous = smoothed_points[-1] 最後の観測点をpreviousと名付ける
smoothed_points.append(previous * factor + point * (1 - factor)) 指数移動平均で計算
else:
smoothed_points.append(point) リストsmoothed_pointsが空っぽなら観測点を追加
なめらかなグラフ
見比べてみると、方向性がわかりやすくなっている
factorの数値を変えてみるとグラフも変化するので個々で調整


