#はじめに
HTMLで数式をグラフに表示させるライブラリを探してましたが、使い勝手がいいものがなかったので自分用に作成しました。
手っ取り早く数式をHTMLに表示させたい人にはいいかもしれません。
数式を表示するのが目的ですので、plotly.jsがデフォルトで備えている機能でも使えないようにしているものもあります。
plotly.jsのラッパーですので、当然ビュー操作(拡大縮小、平行移動、回転(3Dのみ))も可能です。
#導入方法
1: 本ライブラリはplotly.jsをラップしたものですので、まずはこちらよりplotly-latest.min.jsをダウンロードしてください。
2: 次にこちらより本ライブラリをダウンロードします。
3: plotly-latest.min.jsとplotlynf.jsとplotly.cssを読み込みます。
<script src="plotly-latest.min.js"></script>
<script src="plotlynf.js"></script>
<link rel="stylesheet" type="text/css" href="plotlynf.css">
4: グラフを表示する為の<div>を作成します。
<div id="scatter"></div>
これで準備の完了です。
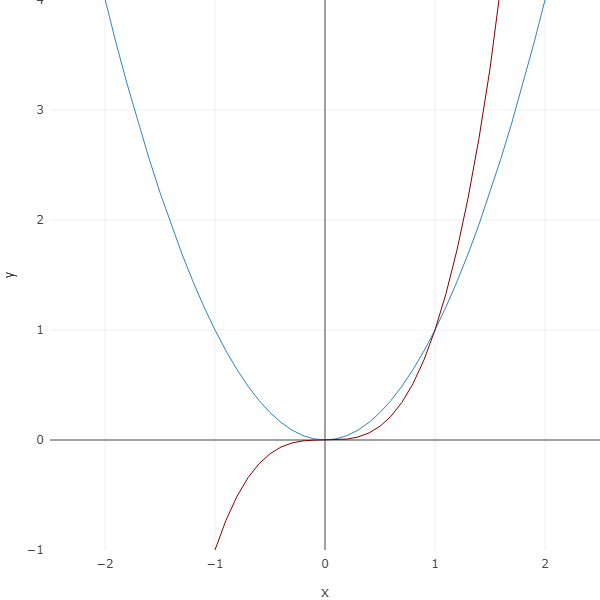
#2Dのサンプルプログラム
描画する関数は\\
y=x^2,y=x^3\\
とする。
// 初期設定
Plotlynf.config({
	id: 'scatter2d',	// <div>のid
	dragmode: 'pan',	// ドラッグの動作(デフォルト値: 'zoom', 省略可能) 'zoom' | 'pan' | 'orbit' | 'turntable'
	width: 600,			// <div>の幅(デフォルト値: 500, 省略可能)
	height: 600,		// <div>の高さ(デフォルト値: 500, 省略可能)
	keepaspect: true,	// アスペクト比を維持するか(デフォルト値: true, 省略可能)
	ranges: [			// 表示範囲(デフォルト値: null, 省略可能)
		{
			min: -2,	// 表示範囲のXの最小値
			max: 2,		// 表示範囲のXの最大値
		},
		{
			min: -1,	// 表示範囲のYの最小値
			max: 4,		// 表示範囲のYの最大値
		},
	],
});

// x * x の描画
Plotlynf.plot2d({
	func: x => x * x, 	// 関数 f(x) | f(y)
	variable: 'x',		// 変数 'x' | 'y', デフォルト値: 'x', 省略可能
	plots:[
		{
			min: -3, 	// 変数をplotする変数の最小値
			max: 3,		// 変数をplotする変数の最大値
			step: 0.1,	// 変数をplotするピッチ
		},
	],
});

// x * x * x の描画
Plotlynf.plot2d({
	func: x > x * x * x, 	// 関数 f(x) | f(y)
	variable: 'x',		// 変数 'x' | 'y', デフォルト値: 'x', 省略可能
	plots:[
		{
			min: -3, 	// 変数をplotする変数の最小値
			max: 3,		// 変数をplotする変数の最大値
			step: 0.1,	// 変数をplotするピッチ
		},
	],
	line: {
		color: 'rgb(128, 0, 0)',	// 線の色
		width: 1				// 線の幅
	}
});
###2Dのサンプルプログラムの説明
基本的にプログラムのコメントをお読みください。
まず、Plotlynf.config()を呼んで、設定を行います。
id以外は省略可能です。
rangesで初期表示範囲を決定します。rangesを省略すると、描画した範囲が初期表示範囲になります。
次に、Plotlynf.plot()を呼んで、グラフに関数を表示させます。
※y=3のようにXが変化しない関数は、variableに'y'を指定します。
※直線を描画する場合は、stepはmax-minにするとよいです。
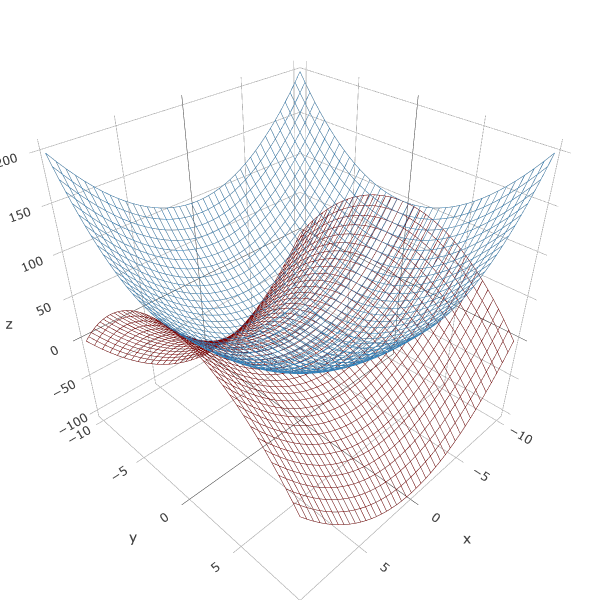
#3Dのサンプルプログラム
描画する関数は\\
z=x^2+y^2,z=x^2-y^2\\
とする。
Plotlynf.config({
	id: 'scatter',	// <div>のid
	dragmode: 'orbit',	// ドラッグの動作(デフォルト値: 'zoom', 省略可能) 'zoom' | 'pan' | 'orbit' | 'turntable'
	width: 600,			// <div>の幅(デフォルト値: 500, 省略可能)
	height: 600,		// <div>の高さ(デフォルト値: 500, 省略可能)
	keepaspect: false,	// アスペクト比を維持するか(デフォルト値: false, 省略可能)
});

Plotlynf.plot3d({
	func: (x, y) => x * x + y * y, 	// 関数 f(x, y) | f(x, z) | f(y, x) | f(y, z) | f(z, x) | f(z, y)
	variable: 'xy',		// 変数 'xy' | 'xz' | 'yx' | 'yz' | 'zx' | 'zy', デフォルト値: 'xy', 省略可能
	plots:[
		{
			min: -10, 	// 1番目の変数をplotする変数の最小値
			max: 10,	// 1番目の変数をplotする変数の最大値
			step: 0.5,	// 1番目の変数をplotするピッチ
		},
		{
			min: -10, 	// 2番目の変数をplotする変数の最小値
			max: 10,	// 2番目の変数をplotする変数の最大値
			step: 0.5,	// 2番目の変数をplotするピッチ
		}
	],
});

Plotlynf.plot3d({
	func: (x, y) => x * x - y * y, 	// 関数 f(x, y) | f(x, z) | f(y, x) | f(y, z) | f(z, x) | f(z, y)
	variable: 'xy',		// 変数 'xy' | 'xz' | 'yx' | 'yz' | 'zx' | 'zy', デフォルト値: 'xy', 省略可能
	plots:[
		{
			min: -10, 	// 1番目の変数をplotする変数の最小値
			max: 10,	// 1番目の変数をplotする変数の最大値
			step: 0.5,	// 1番目の変数をplotするピッチ
		},
		{
			min: -10, 	// 2番目の変数をplotする変数の最小値
			max: 10,	// 2番目の変数をplotする変数の最大値
			step: 0.5,	// 2番目の変数をplotするピッチ
		}
	],
	line: {
		color: 'rgb(128, 0, 0)',	// 線の色
	}
});
###3Dのサンプルプログラムの説明
基本的にプログラムのコメントをお読みください。
まず、Plotlynf.config()を呼んで、設定を行います。
id以外は省略可能です。2Dのサンプルプログラムと異なり、keepaspectをfalseにしています。その為Zの縮尺がX,Yとは異なります。
次に、Plotlynf.plot()を呼んで、グラフに関数を表示させます。
※y,zを変数とする場合は、variableに'yz'と指定します。
※stepは小さくしすぎると、描画が遅くなります。(max-min)/40~(max-min)/20程度がよいでしょう。
###不具合?
3Dをグラフに表示する場合、Plotlynf.config()のrangesが効きません。(私のplotly.jsの不勉強のせいだと思いますが。。。)
plotly.jsで3D表示する時に、表示範囲指定する方法をご存知の方は教えてください。
#近日中に書き直します
typeにsurfaceというのがあるんですね、近日中に書き直します。

