作ったもの
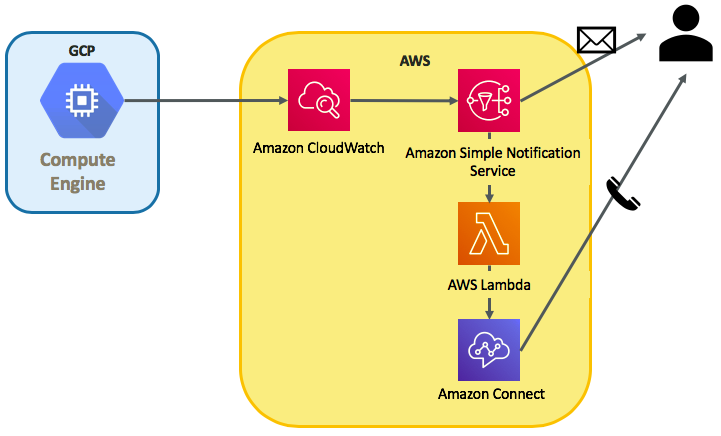
模式図は以下の通りで、GCP上のインスタンスで上がったアラートをCloudWatchで受けて、管理者にメール・電話で通知する仕組みです。
作った背景
CloudWatchにはAgentが用意されており、オンプレサーバもAWSコンソールにて一元管理できるってのを知り、試しにGCPインスタンスをCloudWatch Agentで監視して様々な方法で通知してみようと思い作ってみました。
流れ
流れとしては以下のとおりです。
・GCPインスタンスの作成
・SSMの導入
・IAM登録
・CloudWatch Agentのインストール
・Amazon Connectの設定
・Lambdaの設定
・サブスクリプションの作成
GCPインスタンス作成
outboundにInternetへの足があればOKで、特にデフォルトの設定はいじっておりません。
監視対象のサーバはGCPでなくても、オンプレサーバやIBM Cloudのサーバなどでも構わないと思います。
SSMの導入
SSMの導入はCloudWatchにて監視する上で必須ではないと思いますが、便宜上導入しています。
- EC2 System Managerのアクティベーションを作成
- SSM Agentのインストール
アクティベーション作成&SSM Agentのインストール
こちらを参考にしてアクティベーションを作成しました。
https://dev.classmethod.jp/cloud/aws/ec2-systems-manager-on-premises/
[SYSTEM MANAGER共有リソース]→[アクティベーション]→[アクティベーションの作成]にて新規アクティベーションを作成します。ここで表示されるアクティベーションコードとアクティベーションIDを用いて監視対象の紐付けを行いますので控えておきましょう。
続いて、GCPインスタンスにyumでSSM Agentをインストールします。
・SSM Agentのrpmをダウンロード
# mkdir /tmp/ssm
# curl https://amazon-ssm-ap-northeast-1.s3.amazonaws.com/latest/linux_amd64/amazon-ssm-agent.rpm -o /tmp/ssm/amazon-ssm-agent.rpm

・インストールします
# yum install -y /tmp/ssm/amazon-ssm-agent.rpm

・先程控えたアクティベーションコードを使って登録します
# systemctl stop amazon-ssm-agent
# amazon-ssm-agent -register -code "アクティベーションコード" -id "アクティベーションID" -region "自分のリージョン"

・エージェントを起動します
# systemctl start amazon-ssm-agent
これでSSMからマネージドインスタンスとして閲覧可能になります。コンピュータ名がGCPで作成したものと一致していることを確認してください。
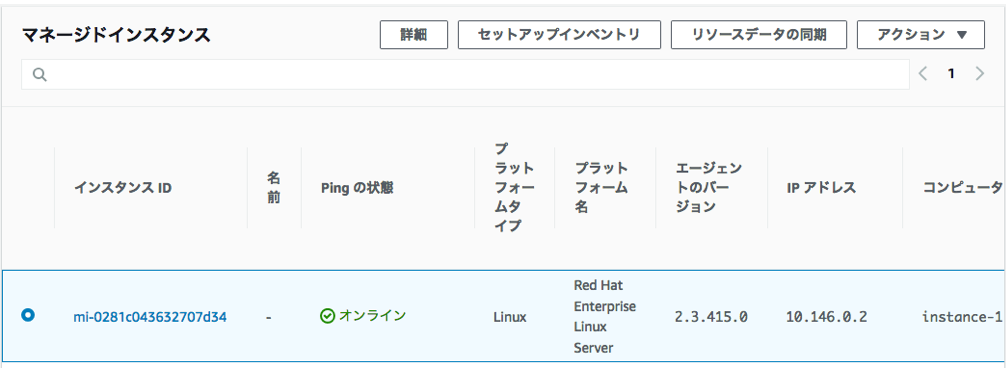
インスタンスIDはこのアカウント固有のものが新たに付与されます。
IAM登録
CloudWatch Agent用のユーザーを作成し、ポリシーは以下4つを付与してください。
AmazonEC2ReadOnlyAccess
AmazonSSMFullAccess
AmazonEC2RoleforSSM
CloudWatchAgentServerPolicy
ユーザー追加時に表示されるアクセスキーIDとシークレットアクセスキーを控えておきましょう。
CloudWatch Agentインストール
System Managerにてランコマンドを実行することで、CloudWatch Agentが導入出来ます。
[SYSTEM MANAGER アクション]→[ランコマンド]→[コマンドの実行]をクリックし、
ドキュメントのプレフィックス名AWS-ConfigureAWSPackageを選択してください。
コマンドのパラメータは以下のよう設定し、実行してください。
- Action:Install
- Name:AmazonCloudWatchAgent
- Version:latest
以下の通り、Successfully installedと出力されればOKです。
Initiating arn:aws:ssm:::package/AmazonCloudWatchAgent 1.207573.0 install
Plugin aws:runShellScript ResultStatus Success
install output: Running sh install.sh
Successfully installed arn:aws:ssm:::package/AmazonCloudWatchAgent 1.207573.0
AWS CLIインストール
続いて、CloudWatch Agentのプロファイル作成のためにAWS CLIを導入します。
・pipが入っていない場合はpipのインストール
# curl -O https://bootstrap.pypa.io/get-pip.py
# python get-pip.py
# pip --version

・pipにてAWS CLIのインストール
# pip install awscli --upgrade
# aws --version
CloudWatchAgentプロファイルの作成
作成したIAMユーザー情報のアクセスキーとシークレットアクセスキーで「AmazonCloudWatchAgent」プロファイルを設定します。
# aws configure --profile AmazonCloudWatchAgent
AWS Access Key ID [None]: ******************
AWS Secret Access Key [None]: *********************
Default region name [None]: us-west-2
Default output format [None]:
CloudWatchAgentの構成
以下コマンドを実行し、wizardを起動します。
基本はデフォルトでOKですが、自身の環境に合わせて回答を変えましょう。
[root@instance-1 ~]#  /opt/aws/amazon-cloudwatch-agent/bin/amazon-cloudwatch-agent-config-wizard
=============================================================
= Welcome to the AWS CloudWatch Agent Configuration Manager =
=============================================================
On which OS are you planning to use the agent?
1. linux
2. windows
default choice: [1]:
 1
Trying to fetch the default region based on ec2 metadata...
Are you using EC2 or On-Premises hosts?
1. EC2
2. On-Premises
default choice: [2]:
2 ←今回はEC2以外の環境に導入するため2を選択します。
Please make sure the credentials and region set correctly on your hosts.
Refer to http://docs.aws.amazon.com/cli/latest/userguide/cli-chap-getting-started.html
Do you want to turn on StatsD daemon?
1. yes
2. no
default choice: [1]:
1
Which port do you want StatsD daemon to listen to?
default choice: [8125]
8125
What is the collect interval for StatsD daemon?
1. 10s
2. 30s
3. 60s
default choice: [1]:
1
What is the aggregation interval for metrics collected by StatsD daemon?
1. Do not aggregate
2. 10s
3. 30s
4. 60s
default choice: [4]:
4
Do you want to monitor metrics from CollectD?
1. yes
2. no
default choice: [1]:
1
Do you want to monitor any host metrics? e.g. CPU, memory, etc.
1. yes
2. no
default choice: [1]:
1
Do you want to monitor cpu metrics per core? Additional CloudWatch charges may apply.
1. yes
2. no
default choice: [1]:
1
Would you like to collect your metrics at high resolution (sub-minute resolution)? This enables sub-minute resolution for all metrics, but you can customize for specific metrics in the output json file.
1. 1s
2. 10s
3. 30s
4. 60s
default choice: [4]:
4
Which default metrics config do you want?
1. Basic
2. Standard
3. Advanced
4. None
default choice: [1]:
1
Current config as follows:
{
    "metrics": {
        "metrics_collected": {
            "collectd": {
                "metrics_aggregation_interval": 60
            },
            "cpu": {
                "measurement": [
                    "cpu_usage_idle"
                ],
                "metrics_collection_interval": 60,
                "resources": [
                    "*"
                ],
                "totalcpu": true
            },
            "disk": {
                "measurement": [
                    "used_percent"
                ],
                "metrics_collection_interval": 60,
                "resources": [
                    "*"
                ]
            },
            "diskio": {
                "measurement": [
                    "write_bytes",
                    "read_bytes",
                    "writes",
                    "reads"
                ],
                "metrics_collection_interval": 60,
                "resources": [
                    "*"
                ]
            },
            "mem": {
                "measurement": [
                    "mem_used_percent"
                ],
                "metrics_collection_interval": 60
            },
            "net": {
                "measurement": [
                    "bytes_sent",
                    "bytes_recv",
                    "packets_sent",
                    "packets_recv"
                ],
                "metrics_collection_interval": 60,
                "resources": [
                    "*"
                ]
            },
            "statsd": {
                "metrics_aggregation_interval": 60,
                "metrics_collection_interval": 10,
                "service_address": ":8125"
            },
            "swap": {
                "measurement": [
                    "swap_used_percent"
                ],
                "metrics_collection_interval": 60
            }
        }
    }
}
Are you satisfied with the above config? Note: it can be manually customized after the wizard completes to add additional items.
1. yes
2. no
default choice: [1]:
1
Do you have any existing CloudWatch Log Agent (http://docs.aws.amazon.com/AmazonCloudWatch/latest/logs/AgentReference.html) configuration file to import for migration?
1. yes
2. no
default choice: [2]:
2
Do you want to monitor any log files?
1. yes
2. no
default choice: [1]:
1
Log file path:
/var/log/messages
Log group name:
default choice: [messages]

Log stream name:
default choice: [{hostname}]

Do you want to specify any additional log files to monitor?
1. yes
2. no
default choice: [1]:
2  ←他に監視対象がなければ2を選択します。
Saved config file to /opt/aws/amazon-cloudwatch-agent/bin/config.json successfully.
Current config as follows:
{
    "logs": {
        "logs_collected": {
            "files": {
                "collect_list": [
                    {
                        "file_path": "/var/log/messages",
                        "log_group_name": "messages",
                        "log_stream_name": "{hostname}"
                    }
                ]
            }
        }
    },
    "metrics": {
        "metrics_collected": {
            "collectd": {
                "metrics_aggregation_interval": 60
            },
            "cpu": {
                "measurement": [
                    "cpu_usage_idle"
                ],
                "metrics_collection_interval": 60,
                "resources": [
                    "*"
                ],
                "totalcpu": true
            },
            "disk": {
                "measurement": [
                    "used_percent"
                ],
                "metrics_collection_interval": 60,
                "resources": [
                    "*"
                ]
            },
            "diskio": {
                "measurement": [
                    "write_bytes",
                    "read_bytes",
                    "writes",
                    "reads"
                ],
                "metrics_collection_interval": 60,
                "resources": [
                    "*"
                ]
            },
            "mem": {
                "measurement": [
                    "mem_used_percent"
                ],
                "metrics_collection_interval": 60
            },
            "net": {
                "measurement": [
                    "bytes_sent",
                    "bytes_recv",
                    "packets_sent",
                    "packets_recv"
                ],
                "metrics_collection_interval": 60,
                "resources": [
                    "*"
                ]
            },
            "statsd": {
                "metrics_aggregation_interval": 60,
                "metrics_collection_interval": 10,
                "service_address": ":8125"
            },
            "swap": {
                "measurement": [
                    "swap_used_percent"
                ],
                "metrics_collection_interval": 60
            }
        }
    }
}
Please check the above content of the config.
The config file is also located at /opt/aws/amazon-cloudwatch-agent/bin/config.json.
Edit it manually if needed.
Do you want to store the config in the SSM parameter store?
1. yes
2. no
default choice: [1]:
1
What parameter store name do you want to use to store your config? (Use 'AmazonCloudWatch-' prefix if you use our managed AWS policy)
default choice: [AmazonCloudWatch-linux]

Which region do you want to store the config in the parameter store?
default choice: [us-west-2]

Which AWS credential should be used to send json config to parameter store?
1. ASIA************KO(From SDK)
2. *************(From Profile: AmazonCloudWatchAgent)
3. Other
default choice: [1]:
2  ←先ほど作成したプロファイルであることを確認し、選択します。
Successfully put config to parameter store AmazonCloudWatch-linux.
Program exits now.
CloudWatchAgent設定の配布
[SYSTEM MANAGER アクション]→[ランコマンド]→[コマンドの実行]をクリックし、
ドキュメントのプレフィックス名AmazonCloudWatch-ManageAgentを選択してください。
コマンドのパラメータは以下のよう設定し、実行してください。
- Action: configure
- Mode: onPremise
- Optional Configuration Source: ssm
- Optional Configuration Location: AmazonCloudWatch-linux
- Optional Restart: yes
ターゲットは監視対象となるインスタンスを手動で選択してください。
実行後以下のようなエラーが出たら、
======== Error Log ========
2019/02/06 09:33:29 I! AmazonCloudWatchAgent Version 1.207573.0.
2019/02/06 09:33:29 E! Error parsing /opt/aws/amazon-cloudwatch-agent/etc/amazon-cloudwatch-agent.toml, open /usr/share/collectd/types.db: no such file or directory
touchにてファイルを追加して再度ランコマンド実行してください。
mkdir /usr/share/collectd
touch /usr/share/collectd/types.db
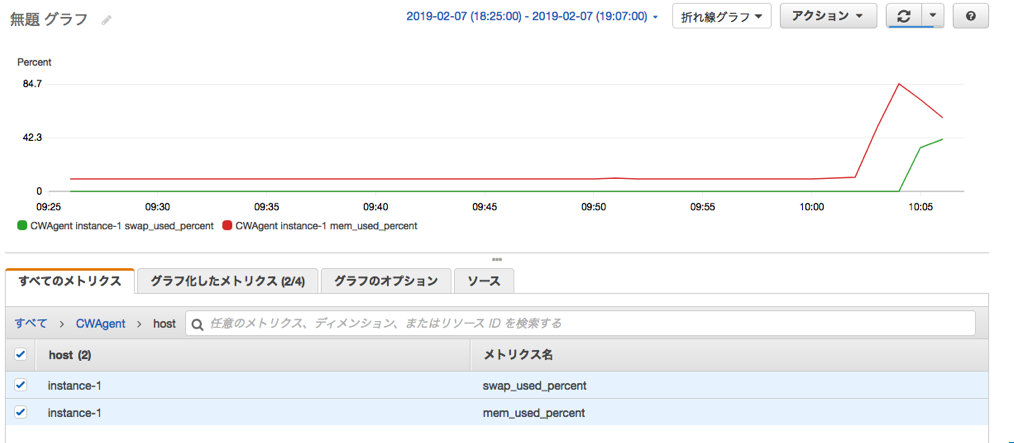
これでAWSコンソールにてGCPインスタンスの確認が出来るようになりました。
swapの負荷テストをするには、GCPのインスタンスにはデフォルトでSwap領域がないので以下サイトにて設定が必要です。
https://wannabe-jellyfish.hatenablog.com/entry/2018/02/04/170033
[root@instance-1 ~]# free -m
              total        used        free      shared  buff/cache   available
Mem:           3537         103        3327           1         106        3252
Swap:           511         128         383
[root@instance-1 ~]# date
Thu Feb  7 10:08:07 UTC 2019
[root@instance-1 ~]#
Amazon Connectの設定
以下を参考にAmazon Connectのリソース設定及び電話番号の取得までを実施しましょう。
http://xp-cloud.jp/blog/2017/10/12/2027/
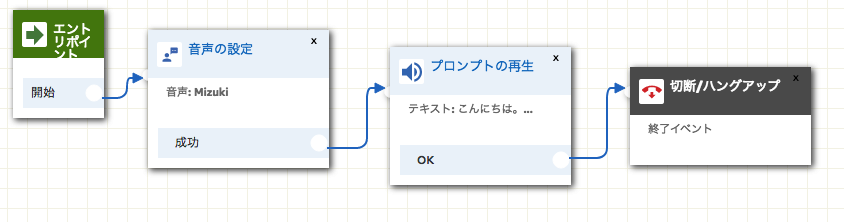
次に、問い合わせフローを作成します。
今回作成したものは、電話発信がトリガーされたら用意されたメッセージを伝えるだけのとてもシンプルなものにしています。
保存して発行を選択し、このフローのARNを確認します。
フローのARNは以下のようになっておりますが、
arn:aws:connect:us-west-2:xxxxxxxxxx:instance/72ada63f-1d31-3c5r-ad48-xxxxxxxxxx/contact-flow/08d5d895-2307-4f56-8b54-xxxxxxxxxxx
instance/以下の72ada63f-1d31-3c5r-ad48-xxxxxxxxxxインスタンスID
contact-flow/以下の08d5d895-2307-4f56-8b54-xxxxxxxxxxxがコンタクトフローID
となります。
この情報に基づいてlambdaがこのフローをキックしますので、控えておきましょう。
lambda関数の作成
言語はpython3.6で作成しました。
import boto3
connect = boto3.client('connect')

# ロギング
import logging

print('Loading function')  # ロード時にメッセージを出力

def lambda_handler(event, context):
    logger = logging.getLogger()  # loggerの初期設定
    logLevel=logging.WARNING      # ロギングのレベルを設定

    # ロギングレベルに応じたメッセージが出力される
    logger.debug('1:debug')
    logger.info('2:info')
    logger.warning('3:warning')
    logger.error('4:error')
    logger.critical('5:critical')


# Amazon Connect で電話をかける
def call(event, context):
    connect.start_outbound_voice_contact(
        DestinationPhoneNumber='+81xxxxxxxxx',
        ContactFlowId='08d5d895-2307-4f56-8b54-xxxxxxxxxxx',
        InstanceId='72ada63f-1d31-3c5r-ad48-xxxxxxxxxx',
        SourcePhoneNumber='+1xxxxxxxxx',
    )
DestinationPhoneNumberには通知先の電話番号
ContactFlowId, InstanceIdには先程メモした問い合わせフローのコンタクトフローIDとインスタンスID
SourcePhoneNumberにはAmazon Connectにて払い出した電話番号
をそれぞれ入れます。
ここで発行された関数にARNが付与されますので、このARNを用いてCloudWatchと連携します。
サブスクリプション作成
CloudWatchにて適当なアラームを作成します。
しきい値はお好みで設定し、アクション欄の[通知の送信先]にて「新しいリスト」を選択/作成してください。
これがSNS(Simple Notification Service)における「トピック」になります。
SNSコンソールに移り、作成したトピックを選択した上でアクションタブより「トピックへのサブスクリプション」を選択してください。
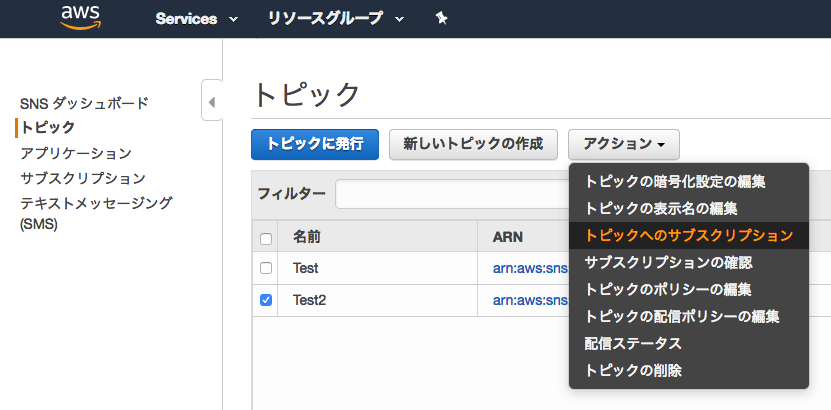
ポップアップにて以下の通り選択します。
- プロトコル:AWS lambda
- エンドポイント:上で作成したlambdaのARNを選択
これにてCloudWatchにて監視アラートがあがれば、
・SNSにてメール通知
・lambdaからAmazon Connect起動で電話通知
が可能になります。
おわりに
複数の環境にわたったシステムをお持ちの方にとっては、AWSコンソール上で一括管理できるため非常に有用なのではと思います。
ここでは紹介していませんが、lambdaの別関数を作成してSlackにも通知を入れることも出来ます。
また最初は、Twilioというサービスを用いて電話機能を実装していましたが、一度外部に出るのと音声ファイルをS3に置きパブリック・アクセスを許可する必要があるのとでセキュリティ的に断念しました。(作ることには作ったが…)
今後はアラートの内容をAmazon Connectに渡し、アラートごとに異なったメッセージを通知するようなシステムにしていきたいと思います。