時系列データをもとにクラスタリングを行うためのダミーデータを作成した。
n.class <- 5  # クラスの数
n.repeat <- 4 # 各クラスの測定個体数
n.freq <- 8   # 各個体の測定回数
sd <- 0.1     # 誤差

tbl <- expand.grid(nth=(1:n.freq),
            rep=as.character(1:n.repeat),
            class=(letters[1:n.class])) %>%
  dplyr::as_tibble() %>%
  dplyr::mutate(t=runif(n.repeat * n.class * n.freq),   # 各測定の時刻 t
                # 各クラスの真の時系列変化 + 誤差
                y=case_when(class=="a" ~ sin(t*2*pi) + rnorm(n(), sd = sd),
                            class=="b" ~ cos(t*2*pi) + rnorm(n(), sd = sd),
                            class=="c" ~ sin(t*0.4*pi + 3.5) + rnorm(n(), sd = sd),
                            class=="d" ~ sin(t*0.2*pi) * cos(t*pi) + rnorm(n(), sd = sd),
                            class=="e" ~ sin(t*0.2*pi - 1.5) * cos(t*2*pi) + rnorm(n(), sd = sd)),
                id=rep(1:(n.repeat*n.class), each=n.freq)) # 測定に対するid

tbl
# A tibble: 160 x 6
     nth rep   class     t      y    id
   <int> <fct> <fct> <dbl>  <dbl> <int>
 1     1 1     a     0.113  0.594     1
 2     2 1     a     0.396  0.635     1
 3     3 1     a     0.297  1.16      1
 4     4 1     a     0.745 -0.909     1
 5     5 1     a     0.894 -0.659     1
 6     6 1     a     0.862 -0.737     1
 7     7 1     a     0.752 -1.05      1
 8     8 1     a     0.810 -0.860     1
 9     1 2     a     0.420  0.408     2
10     2 2     a     0.392  0.510     2
# … with 150 more rows
プロットする。
ggplot(data = tbl, mapping = aes(by=rep)) +
  stat_function(size=0.1, fun = function(t) sin(t*2*pi)) +
  stat_function(size=0.1, fun = function(t) cos(t*2*pi)) +
  stat_function(size=0.1, fun = function(t) sin(t*0.4*pi + 3.5)) +
  stat_function(size=0.1, fun = function(t) sin(t*0.2*pi) * cos(t*pi)) +
  stat_function(size=0.1, fun = function(t) sin(t*0.2*pi - 1.5) * cos(t*2*pi)) +
  geom_line(aes(x=t, y=y, color=class)) +
  geom_point(aes(x=t, y=y, color=class))
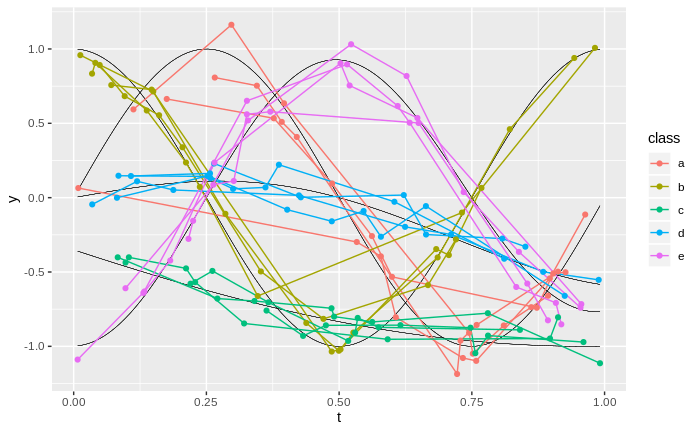
tが時刻、yが観測値、色がclass、黒い実線が各クラスの真の時系列変化、各色のラインが個体別の観測、各点がその観測値を示す。