はじめに
いまcocoapods.orgを"bar chart"で検索したら、約20ほどの結果が返ってきました。これだけの選択肢があれば、ひとつひとつチェックすれば望む機能を備えたものも見つかるだろうとは思うんですが、今回はあえて一からつくることにします。
最初はSPM向けのフレームワークにしようかと考えたんですが、ことのほか「一般化」に苦労した結果のこのポストです。
Xcode 10.3, Swift 5で書きました
お手製のメリット
- 機能を絞ってシンプルに実装できる
- 自分のデータを下地としたAPIをデザインできる
- 画面描画に依存するライブラリのブラックボックス化を避けられる(ダークモードやSF Symbolsのような新機能への対応は己のチョイス)
- 意外と簡単(だと思う)なのに満足度が高い
最後の”意外”の基準はひとそれぞれなのでもちろん一概にはいえないですが、Auto LayoutやCore AnimationといったいまやCocoaを語るうえで欠かせないコンポーネントをうまく使うことで、それほど時間をかけずに実現できるんじゃないかと思った、ということです(「それほどの時間」とはどれほどか?とかいいだすとややこしいのでここまでにします)。
目標
こんな感じ。エレメント毎に色のちがうものをスタックして棒グラフにし、あらたに値を加えると当該の棒が「伸びる」アニメーションでそれを表します。
実装
グラウンドデザイン
今回思いついた基本的な構造は以下。
(*StackViewのStackとStacked Bar ChartのStackで名前がかぶってしまってややこしいですが、他の言い方が思いつかなかったのでこうなりました)
- ChartView: UIView
- BarsStackView: UIStackView
- Bar: UIView
- ColorStackLayer: CALayer
- ColorStackLayer: CALayer...
- Bar: UIView
- Bar: UIView...
- Bar: UIView
- BarsStackView: UIStackView
これらをChartControllerで制御します。図で表すとこんな感じ
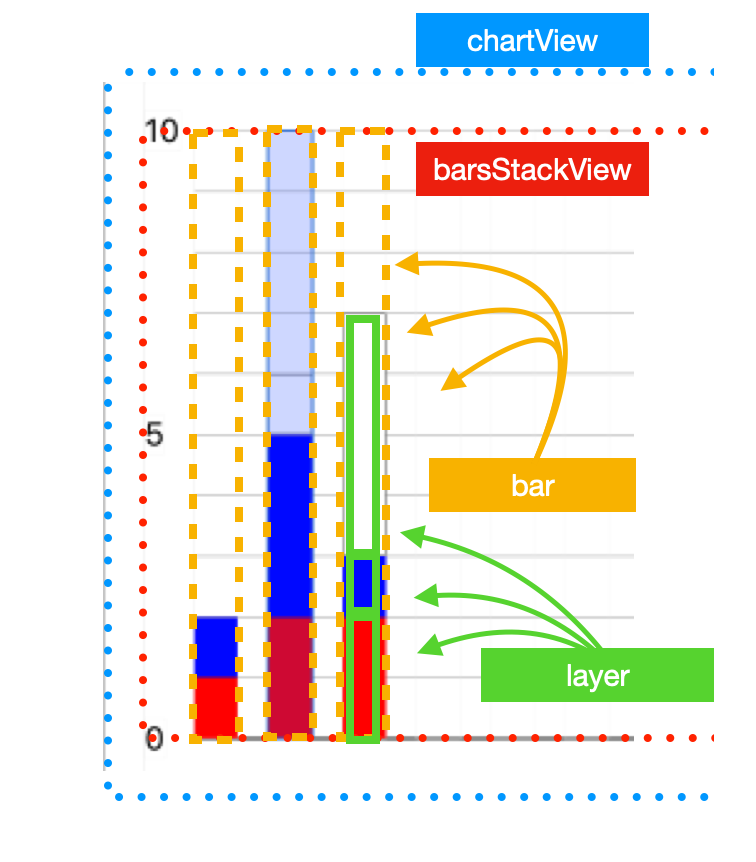
Auto Layoutを活用して棒グラフの基盤をつくる
barsStackViewのaxisを.horizontalに、distributionを.fillEquallyにしてやることでwidthが決まり、垂直方向はheightをbarsStackViewとイコールに縛る(barsStackView自体はStoryboardからIBOutletでリファレンスされているchartViewとconstraintsされているのでheightを持っている)ことで、なんとベースはほぼ完成です。簡単!
/// Create bar view * 11
let barViews = (2...12).map { _ in Bar(frame: CGRect.zero) }

// Horizontal Stack View [Bars]
barsStackView = UIStackView(arrangedSubviews: barViews)
barsStackView.clipsToBounds = true
barsStackView.translatesAutoresizingMaskIntoConstraints = false
barsStackView.alignment = .center
barsStackView.distribution = .fillEqually
barsStackView.axis = .horizontal
barsStackView.spacing = UIDevice.current.userInterfaceIdiom == UIUserInterfaceIdiom.phone ? 12 : 30

/// Constrains bar view vertically with BarStackView
for subview in barsStackView.arrangedSubviews {
  if let bar = subview as? Bar {
    let vConstraints = NSLayoutConstraint.constraints(
      withVisualFormat: "V:|[bar]|",
      options: [],
      metrics: [:],
      views: ["bar": bar]
    )
    NSLayoutConstraint.activate(vConstraints)
  }
}
chartView.addSubview(barStackView)
今後の改善ポイントとしてはspacingがハードコードされているので、これをダイナミックにしたい、というのがあります。ただ現状UIViewControllerのviewDidLayoutSubviews()をオーバーライドすると、オリエンテーションが変わったときなんかになんどもなんどもメソッドが呼ばれてしまうという問題がおき、未だ解決できずにいるので、この方法にしました。
Core Animationを使って棒グラフを描く
最初からCore Animationに絞ってドローすれば、アニメーションは只でついてくるのでとてもお得。
作戦としては...
-
bar.bounds.heightを基準の高さ(=1)とし、 - それをy軸の単位数で割ると、一単位辺りの高さが求められるので
- 描画したいデータをパースし、それぞれの色と単位を各
bar毎に割り振ってやる
上の図の棒グラフを例にデータをモックすると、左から[['red': 1, 'blue': 1, 'white' 0], ['red': 2, 'blue': 3, 'white' 1]...]といった感じ(実際のAppではArrayをつかったもっと単純?な実装にしています)。
/*
自前のAppからトリムして名前も意味が通りやすいように編集しています
*/
/// Use tag to retrieve barView for later, individual use
barView.tag = xAxisValue

/// yPositions contains origin.y for each stacked color
var yPositions = Array(repeating: CGFloat(0), count: players.count)
/// each hegiht for the stacked color
var heights    = Array(repeating: CGFloat(0), count: players.count)

/// Height of the single unit of the bar
let singleUnit = initialSize.height / CGFloat(10*yBaseNumber)
var totalHeight: CGFloat = initialSize.height

for i in 0..<players.count {
	let dataPoint = dataSource.dataPoint(for: xAxisValue)
	let barHeight = CGFloat(Double(singleUnit) * Double(dataPoint))
	yPositions[i] = totalHeight

	heights[i] = barHeight
    /// Subtract current barHeight from the total height so that
    /// it'd use as a starting point of the next stack.
	totalHeight -= barHeight
}

for (idx, player) in players.enumerated() {
	let colorStack = ColorStackLayer()
    /// [IMPORTANT] If you forgot to change the anchorPoint, animations would be completely messed up!!
    /// [IMPORTANT] Because we want bar to grow from bottom to top, anchorPoint should be at the bottom
    /// [IMPORTANT] If you are not familiar with what the anchorPoint is, I highly, highly
    /// [IMPORTANT] recommend to read Apple's introduction to the Core Animation which is linked above
	colorStack.anchorPoint = CGPoint(x: 0.5, y: 1.0)
	/// set tag, which is defined in subclass of CALayer, with player index
	colorStack.tag = idx
    /// Set position and bounds size accordingly
	colorStack.position    = CGPoint(x: barView.bounds.maxX/2, y: yPositions[idx])
	colorStack.bounds.size = CGSize(width: barView.bounds.width, height: heights[idx])

	let playerCGColor = player.color(of: dataSource.color)?.cgColor ?? player.cgColor

	colorStack.backgroundColor = playerCGColor
    /// If color was white, puts border around the layer for obvious not visually obvious reasons
	if playerCGColor == UIColor.white.cgColor {
		colorStack.borderColor = UIColor.darkGray.cgColor
		colorStack.borderWidth = 0.5
	}
	barView.layer.addSublayer(colorStack)
}
これで棒グラフは描けました。補助線は以下のように引いています
/// Margin of each y axis line
let margin = (chartView.bounds.height-CGFloat(topMargin+bottomMargin))/10
/// Height of the bar itself
var initialHeight = (chartView.bounds.height)-CGFloat(bottomMargin)

/// y axis support bars
for i in 0...10 {
	let path = UIBezierPath()
	path.move(to: CGPoint(x: CGFloat(topMargin), y: initialHeight))
	path.addLine(to: CGPoint(x: chartView.bounds.width, y: initialHeight))

	let shapeLayer = CAShapeLayer()
	shapeLayer.path = path.cgPath
    /// Make bottom line thicker and darker than other lines
	shapeLayer.strokeColor = i == 0 ? UIColor.black.cgColor : UIColor.lightGray.cgColor
	shapeLayer.lineWidth   = i == 0 ? 1 : 0.5

	chartView.layer.addSublayer(shapeLayer)

	/// Put y scale labels
	if (i*yBaseNumber)%(5*yBaseNumber) == 0 {
		let scaleLabel = UILabel(frame: CGRect.zero)
		scaleLabel.tag = yScaleTag
		scaleLabel.font = UIFont.preferredFont(forTextStyle: .footnote)
		scaleLabel.textAlignment = .center
		scaleLabel.text = String(i*yBaseNumber)
		chartView.addSubview(scaleLabel)

		scaleLabel.sizeToFit()
		scaleLabel.center.y = initialHeight

		chartView.bringSubviewToFront(scaleLabel)
	}
	initialHeight -= margin
}
線の太さによるピクセルの微妙な位置のズレを考慮していないので、いわゆるピクセルパーフェクトな図ではないかもしれませんが、用はなしてくれるているのでとりあえずはこれでいきます。
次回はアニメーションに挑戦します