クリスマスイブにこの記事を書いています。こんばんは。
この記事はPythonその4アドベントカレンダーの24日目の記事です。
本日は色々なグラフモジュールを使用できる、Dashのモジュールdash_alternative_vizをご紹介します。実はこれを主役にしようと思っていたのですが、Altairの絵文字可視化が凄いので、そっちが主役な感じの記事になったかもしれません。
開発環境は以下のようになっています。
- Windows10 Pro WSL
- dash 1.7.0
- dash_core_components 1.6.0
- dash_html_components 1.0.2
- dash_alternative_viz 0.0.1
- plotly 4.4.1
- altair 4.0.0
- holoviews 1.12.7
- matplotlib 3.1.2
- seaborn 0.9.0
- pandas 0.25.3
Dashとは
その前に一先ず、Dashとは何かというご紹介から。
DashとはPlotly社が作成する、OSSのウェブフレームワークです。Plotly.js、React.js、Flaskを組み合わせて作成されており、インタラクティブにデータが可視化できるのと、それをウェブアプリケーションとして共有できるのが特徴です。
ドキュメントも充実しており、これを読みながら作ると簡単にアプリケーションが作れるようになります。
こんな感じで動くチャートを作れるのでDash凄い!!ってなっていたわけですが、可視化をするのにエクスタシーを感じる我々としては、徐々にこの種類のグラフはseabornの方がいいよなぁとか、Altairの方が良いよなぁとか思い始めます。
少し前にPanelというDashによく似たコンセプトで作成されたうえに、色々なグラフモジュールが使えるものが出たのですが、ちょっと使い方が素人の私には難しくどうしたもんかなぁと思っていました。
dash_alternative_viz
そして最近見つけたのがdash_alternative_vizです。
これはDashのコンポーネントとしてテスト的に作られているようですが、Dashアップリケーションのコンポーネントとして、Matplotlibやseaborn、bokehにAltairのグラフが使えるというモジュールになっています。
Dashの簡単さで色々なグラフモジュールが使えるなんてすごい。ということで早速実際に見てみましょう。まずは、githubにあるusage.pyを実行します。
ちなみに左上がplotly.express、右上がseaborn、左下がAltair、右下がholoviews(bokeh)で作成したグラフです。上のスライダの動きに反応して、全てのチャートが動いていますね。
先ほどのものをスライダからドロップダウンにするとまた違ったアプリケーションになり、これはこれで趣があります。
こんな感じで今のところ、Pythonを代表する4つの可視化ライブラリが使えるdash_alternative_viz、かなり使い勝手が良いと思います。
ちなみにdashのインストールは
pip install dash
でdash、dash_html_components、dash_html_components、dash_tableという基本的なツールはインストールできます。dash_alternative_vizのインストールは、
pip install git+https://github.com/plotly/dash-alternative-viz
で完了です。本来はこれをもっと、使いまわそうかと思ったのですが、トンデモナイ機能がAltairにあったので、そちらの紹介をして終わります。
Altairの絵文字表示vizが凄い
dash_alternative_vizを紹介するにあたり、各ライブラリの使い方なんかを見ていました。holoviewsはめちゃ難しいなと思いました。
そうして、Altairのドキュメントを見る番になりました。実は以前このツールをお勧めされて、結構気に入って使っていたのですが、最近はDashを使うようになってしまいあまり使わなくなっていました。だがしかし、これを見て虜になりました。
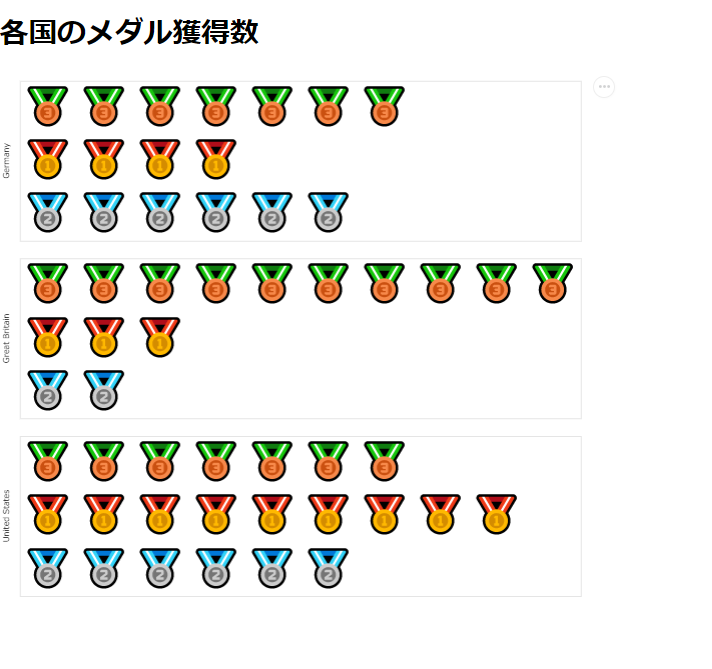
なんとAltairでは絵文字が可視化できるのです!!!
インフォグラフィック系の本を読んで面白そうだなぁと思ったことがあるのですが、何か自分で作ったりしないとできないしなぁという感じで諦めていました。しかし、Altairならそのような可視化もできるのです。
おおおおおお!!!!
というわけで、この記事で言いたいことは以下の2点です。
- dash_alternative_vizはまだ本格的に作成されるのか分からないけど、凄いよ!
- Altairの絵文字可視化は革命的!
ちなみにこのアプリケーションのスクリプトは以下に掲載します。
import dash
from dash.dependencies import Input, Output
import dash_html_components as html
import dash_core_components as dcc
import dash_alternative_viz as dav
import pandas as pd

import altair as alt

source = pd.DataFrame([
      {'country': 'Great Britain', 'animal': 'gold'},
      {'country': 'Great Britain', 'animal': 'gold'},
      {'country': 'Great Britain', 'animal': 'gold'},
      {'country': 'Great Britain', 'animal': 'silver'},
      {'country': 'Great Britain', 'animal': 'silver'},
      {'country': 'Great Britain', 'animal': 'bronze'},
      {'country': 'Great Britain', 'animal': 'bronze'},
      {'country': 'Great Britain', 'animal': 'bronze'},
      {'country': 'Great Britain', 'animal': 'bronze'},
      {'country': 'Great Britain', 'animal': 'bronze'},
      {'country': 'Great Britain', 'animal': 'bronze'},
      {'country': 'Great Britain', 'animal': 'bronze'},
      {'country': 'Great Britain', 'animal': 'bronze'},
      {'country': 'Great Britain', 'animal': 'bronze'},
      {'country': 'Great Britain', 'animal': 'bronze'},
      {'country': 'United States', 'animal': 'gold'},
      {'country': 'United States', 'animal': 'gold'},
      {'country': 'United States', 'animal': 'gold'},
      {'country': 'United States', 'animal': 'gold'},
      {'country': 'United States', 'animal': 'gold'},
      {'country': 'United States', 'animal': 'gold'},
      {'country': 'United States', 'animal': 'gold'},
      {'country': 'United States', 'animal': 'gold'},
      {'country': 'United States', 'animal': 'gold'},
      {'country': 'United States', 'animal': 'silver'},
      {'country': 'United States', 'animal': 'silver'},
      {'country': 'United States', 'animal': 'silver'},
      {'country': 'United States', 'animal': 'silver'},
      {'country': 'United States', 'animal': 'silver'},
      {'country': 'United States', 'animal': 'silver'},
      {'country': 'United States', 'animal': 'bronze'},
      {'country': 'United States', 'animal': 'bronze'},
      {'country': 'United States', 'animal': 'bronze'},
      {'country': 'United States', 'animal': 'bronze'},
      {'country': 'United States', 'animal': 'bronze'},
      {'country': 'United States', 'animal': 'bronze'},
      {'country': 'United States', 'animal': 'bronze'},
      {'country': 'Germany', 'animal': 'gold'},
      {'country': 'Germany', 'animal': 'gold'},
      {'country': 'Germany', 'animal': 'gold'},
      {'country': 'Germany', 'animal': 'gold'},
      {'country': 'Germany', 'animal': 'silver'},
      {'country': 'Germany', 'animal': 'silver'},
      {'country': 'Germany', 'animal': 'silver'},
      {'country': 'Germany', 'animal': 'silver'},
      {'country': 'Germany', 'animal': 'silver'},
      {'country': 'Germany', 'animal': 'silver'},
      {'country': 'Germany', 'animal': 'bronze'},
      {'country': 'Germany', 'animal': 'bronze'},
      {'country': 'Germany', 'animal': 'bronze'},
      {'country': 'Germany', 'animal': 'bronze'},
      {'country': 'Germany', 'animal': 'bronze'},
      {'country': 'Germany', 'animal': 'bronze'},
      {'country': 'Germany', 'animal': 'bronze'}
    ])
app = dash.Dash(__name__)

app.layout = html.Div([
    html.H1("各国のメダル獲得数"),
    dav.VegaLite(spec=alt.Chart(source).mark_text(size=45, baseline='middle').encode(
    alt.X('x:O', axis=None),
    alt.Y('animal:O', axis=None),
    alt.Row('country:N', header=alt.Header(title='')),
    alt.Text('emoji:N')
).transform_calculate(
    emoji="{'gold': '🥇', 'silver': '🥈', 'bronze': '🥉'}[datum.animal]"
).transform_window(
    x='rank()',
    groupby=['country', 'animal']
).properties(width=700, height=200).to_dict())
])


if __name__ == "__main__":
    app.run_server(debug=True)