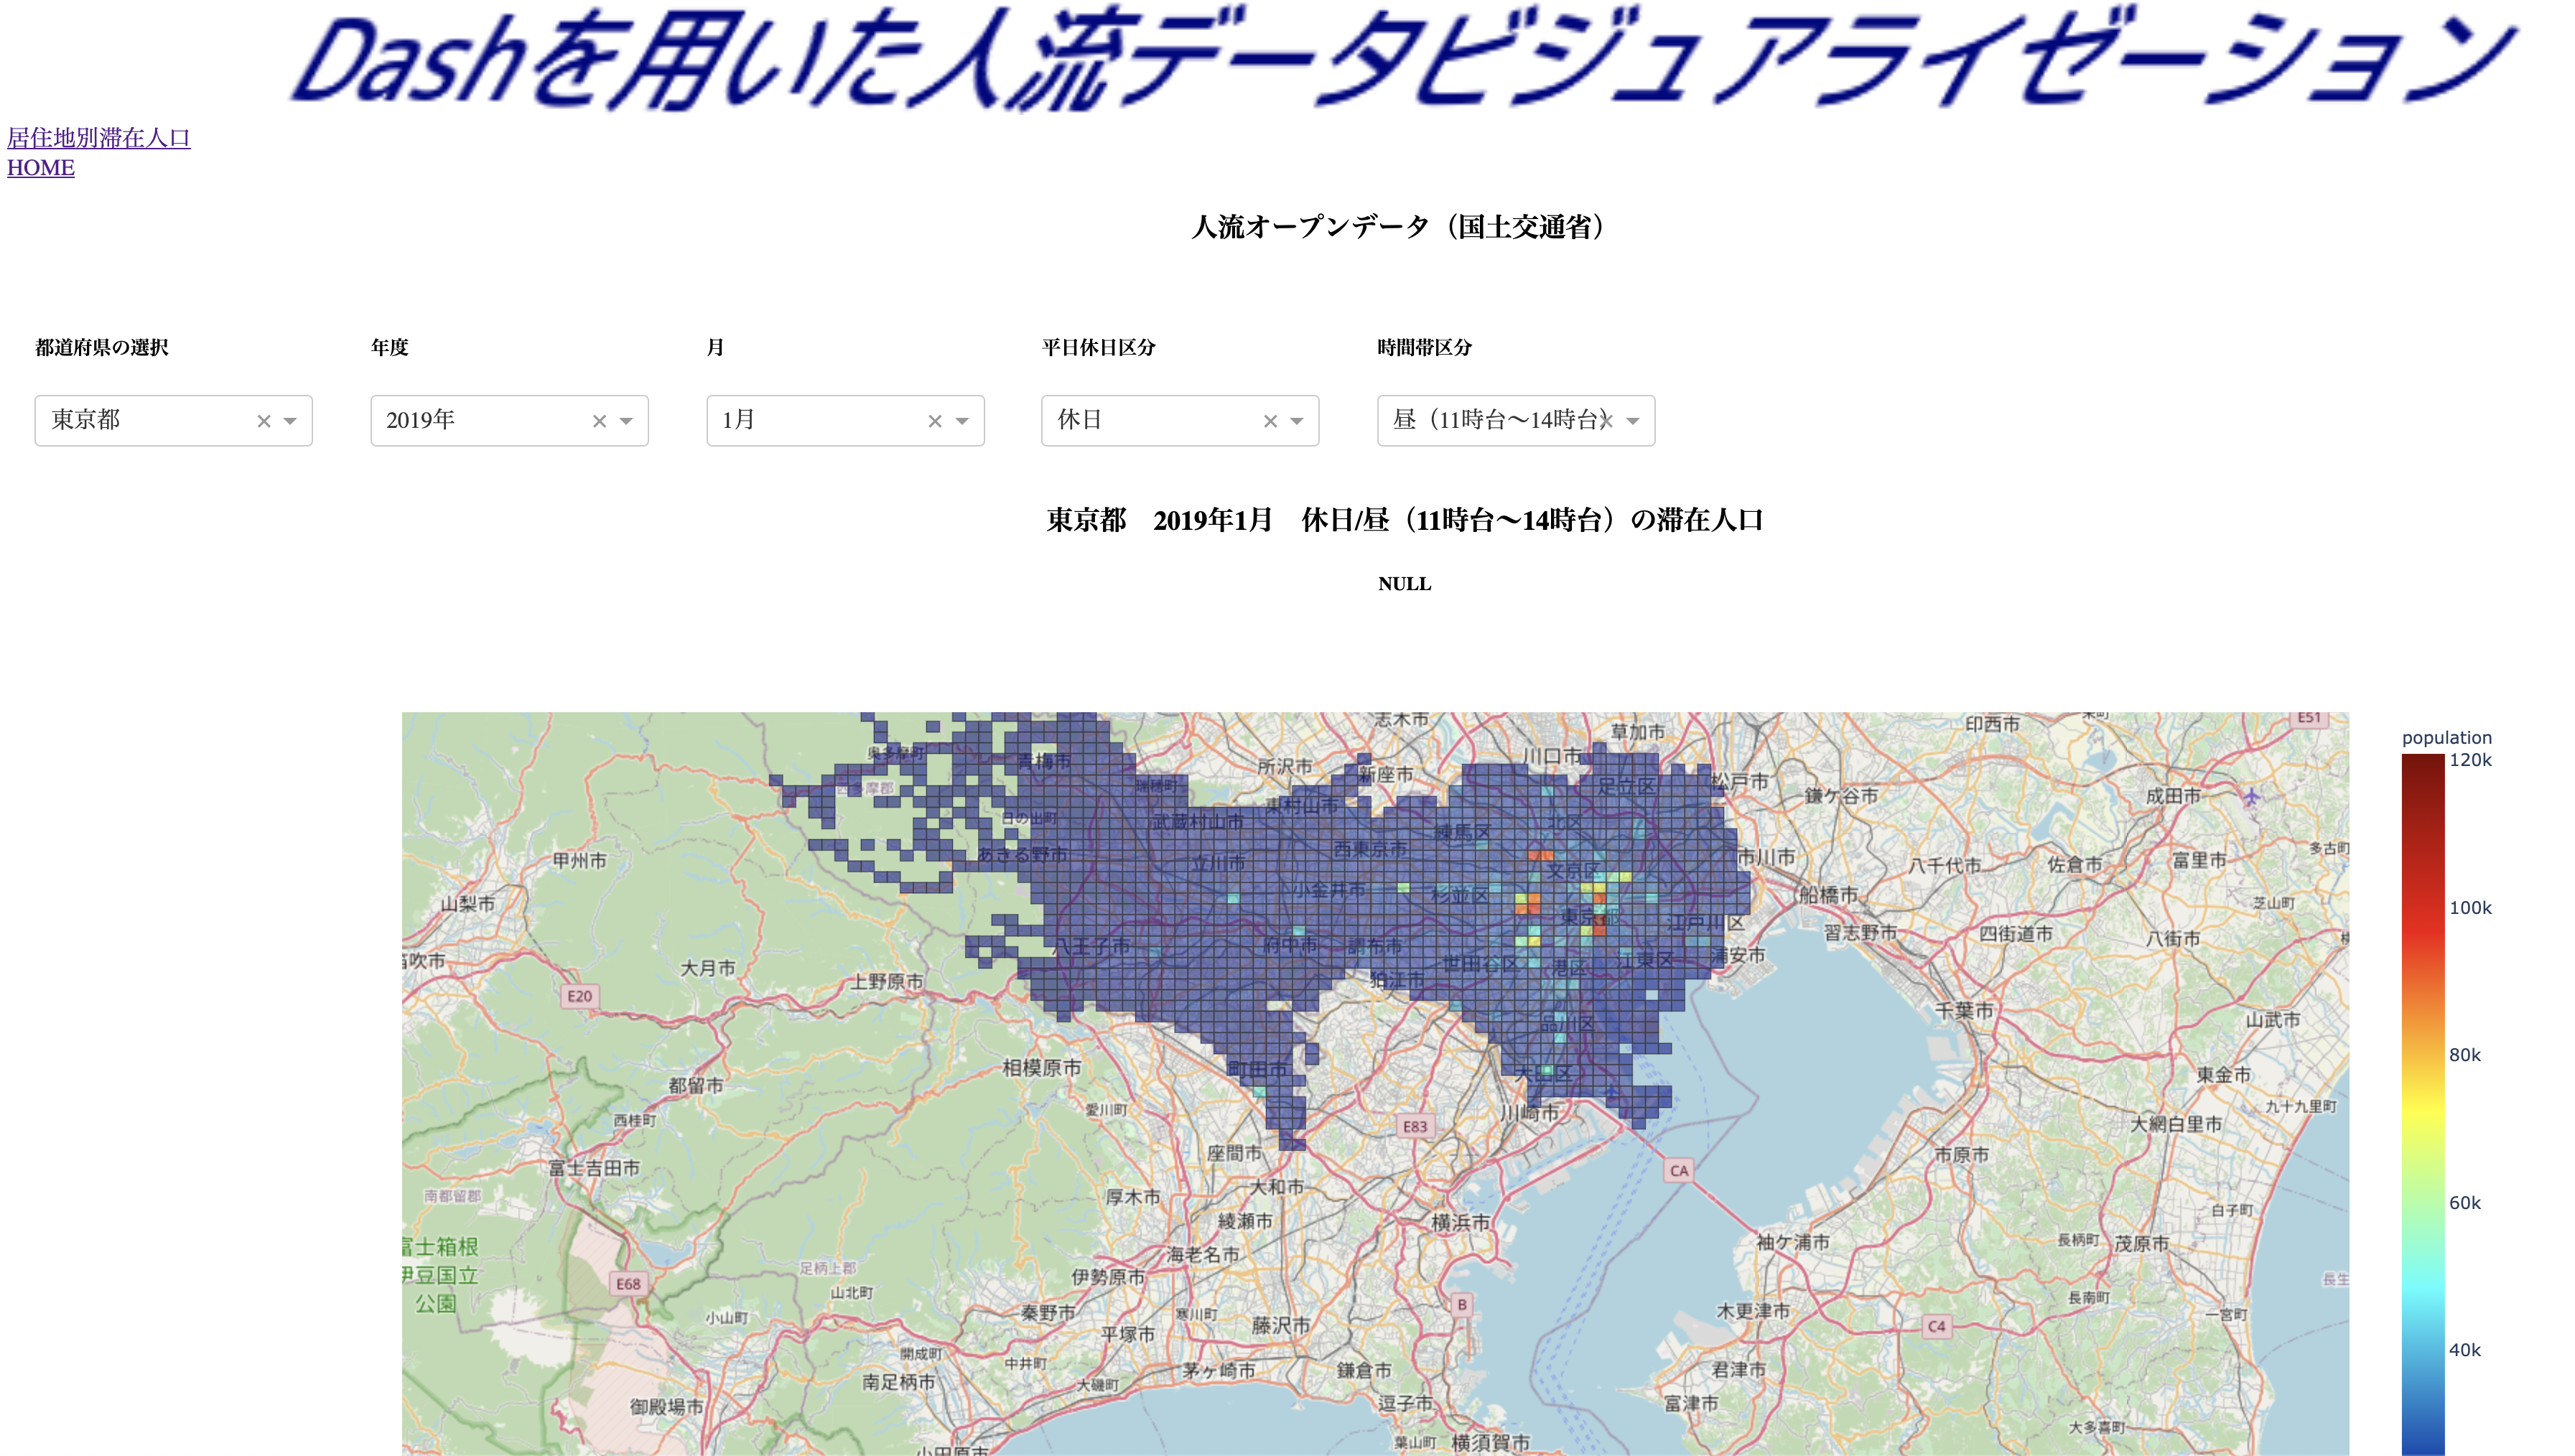
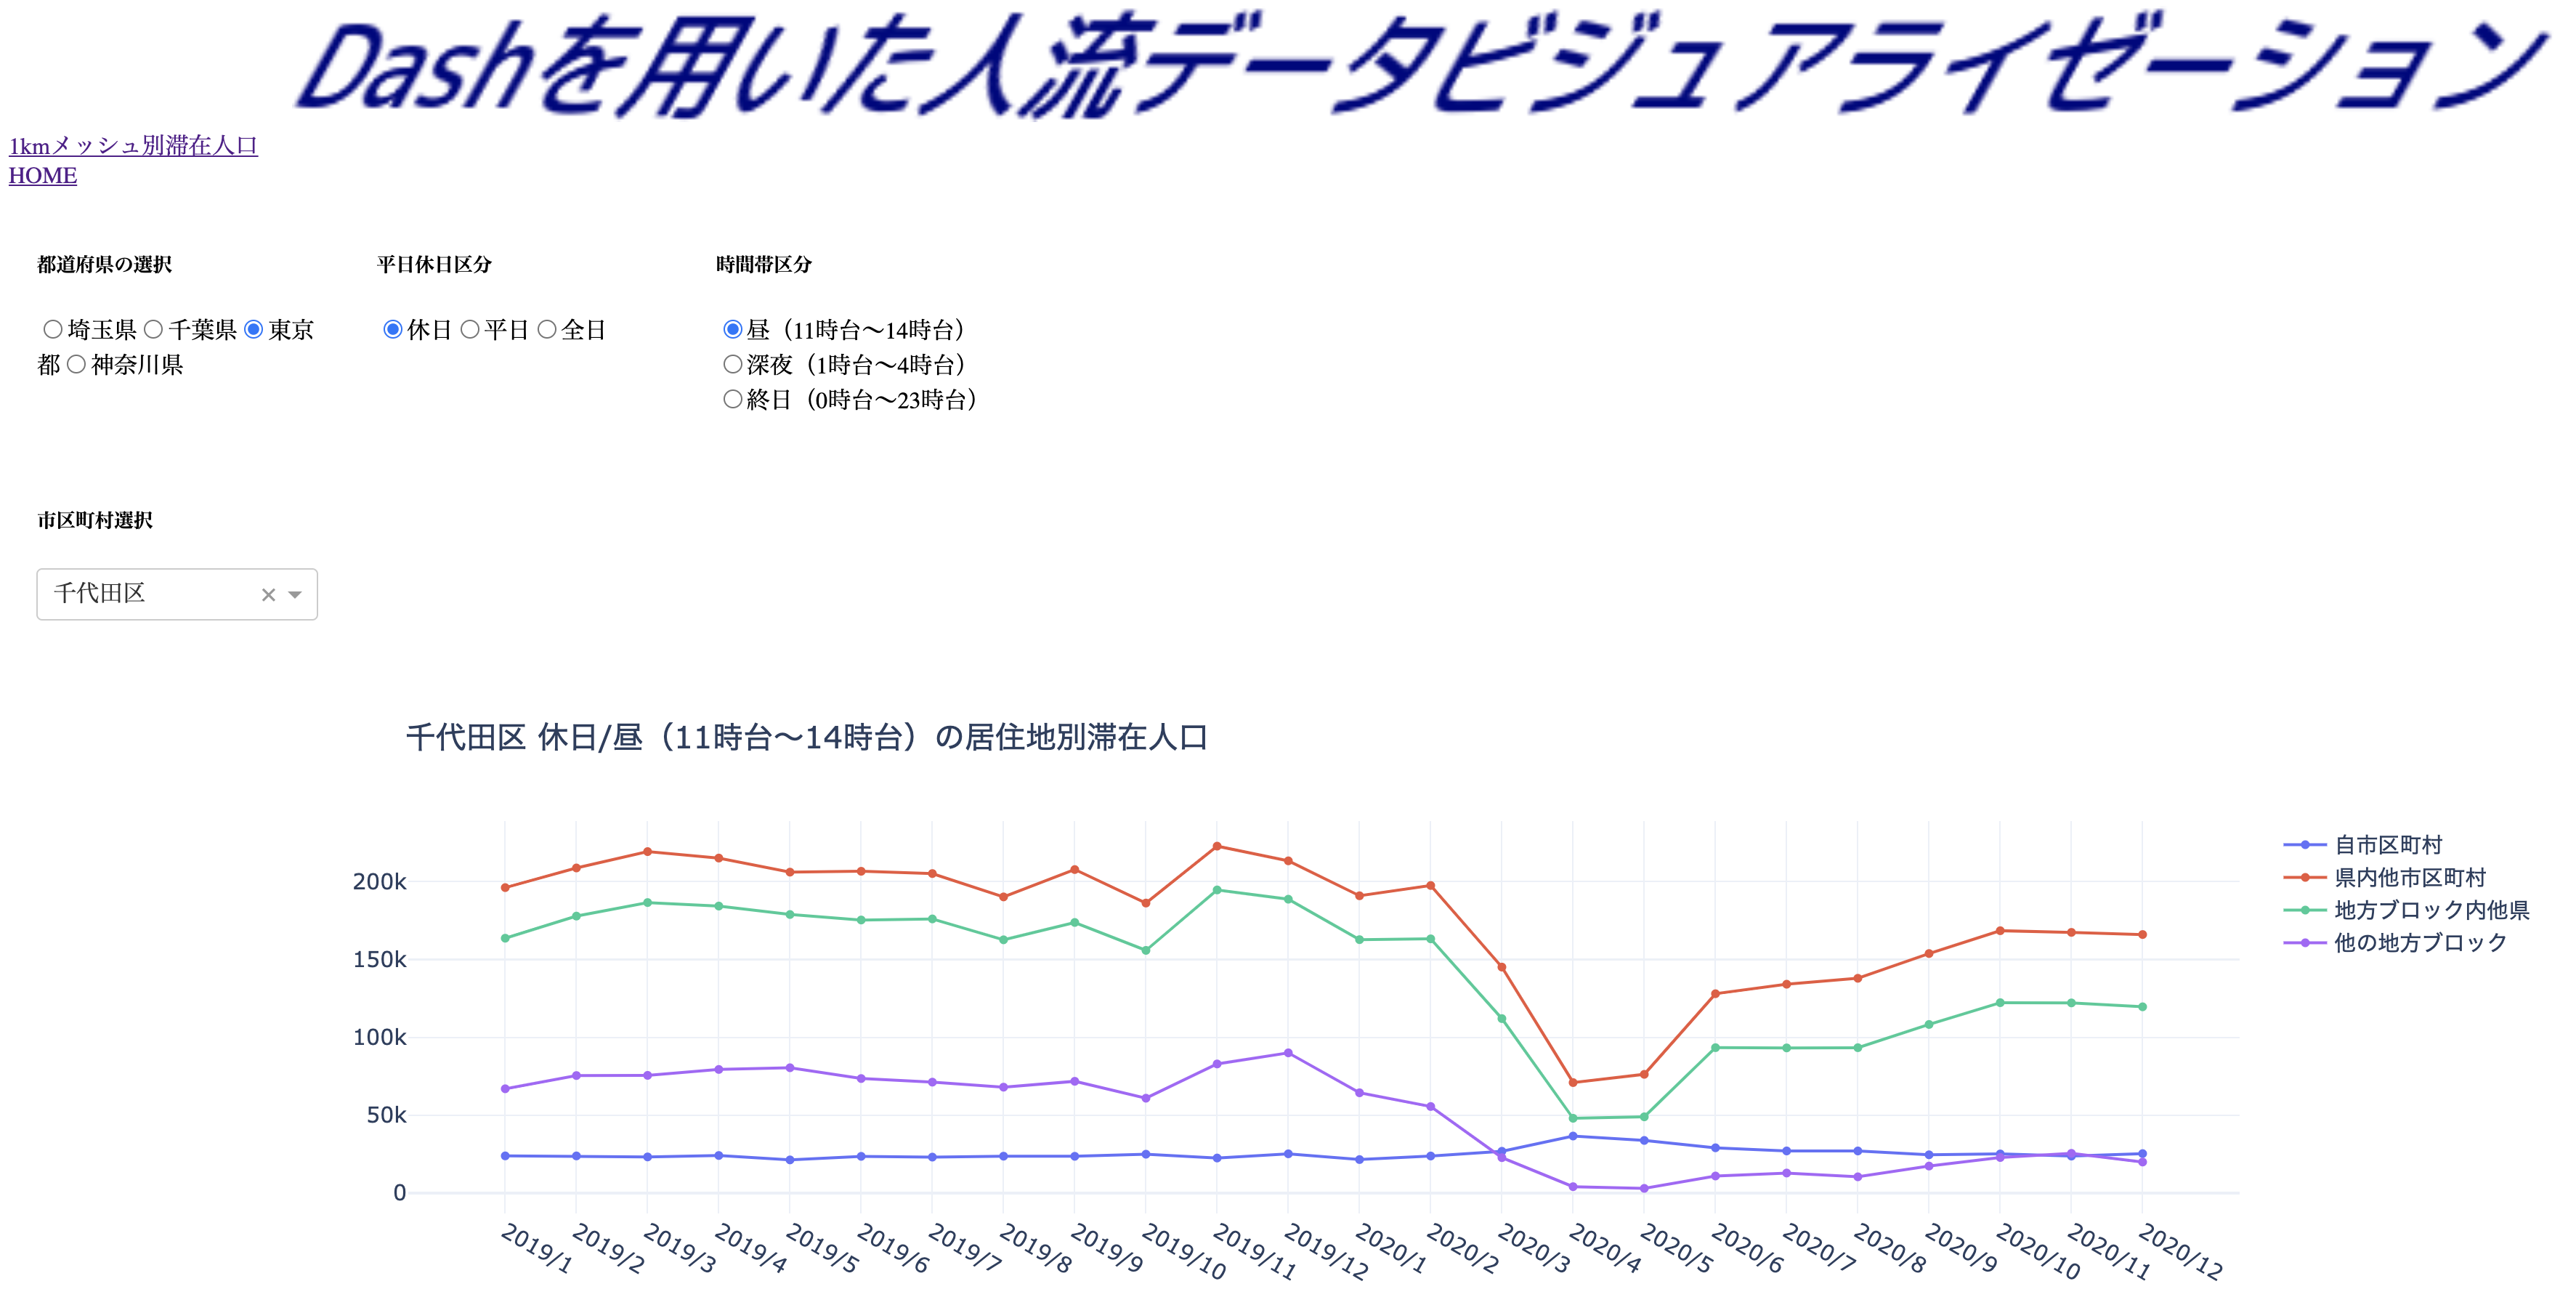
やりたいこと
G空間情報センターにて公開されている全国人流オープンデータを地図上でインタラクティブに表示/分析したかったので、
今回はDashを用いた簡易なダッシュボードを作成していきます。
Dashの使い方は以下の書籍を参考にしました。
この書籍からDashの特徴を抜粋すると
- 複雑に動作するUIを簡単なスクリプトで実装できる
- コールバックを用いて、容易にUIを更新できる
- plotly.pyやPlotly Expressを使って多種多様なグラフを生成できる
1. 実装機能
この書籍に書かれている機能を複数組み合わせて、人流データを簡易に地図上で分析できるダッシュボードを作ってみました
● 可視化したい項目は1kmメッシュの滞在人口と居住地別人口。これらを別ページで表示する。
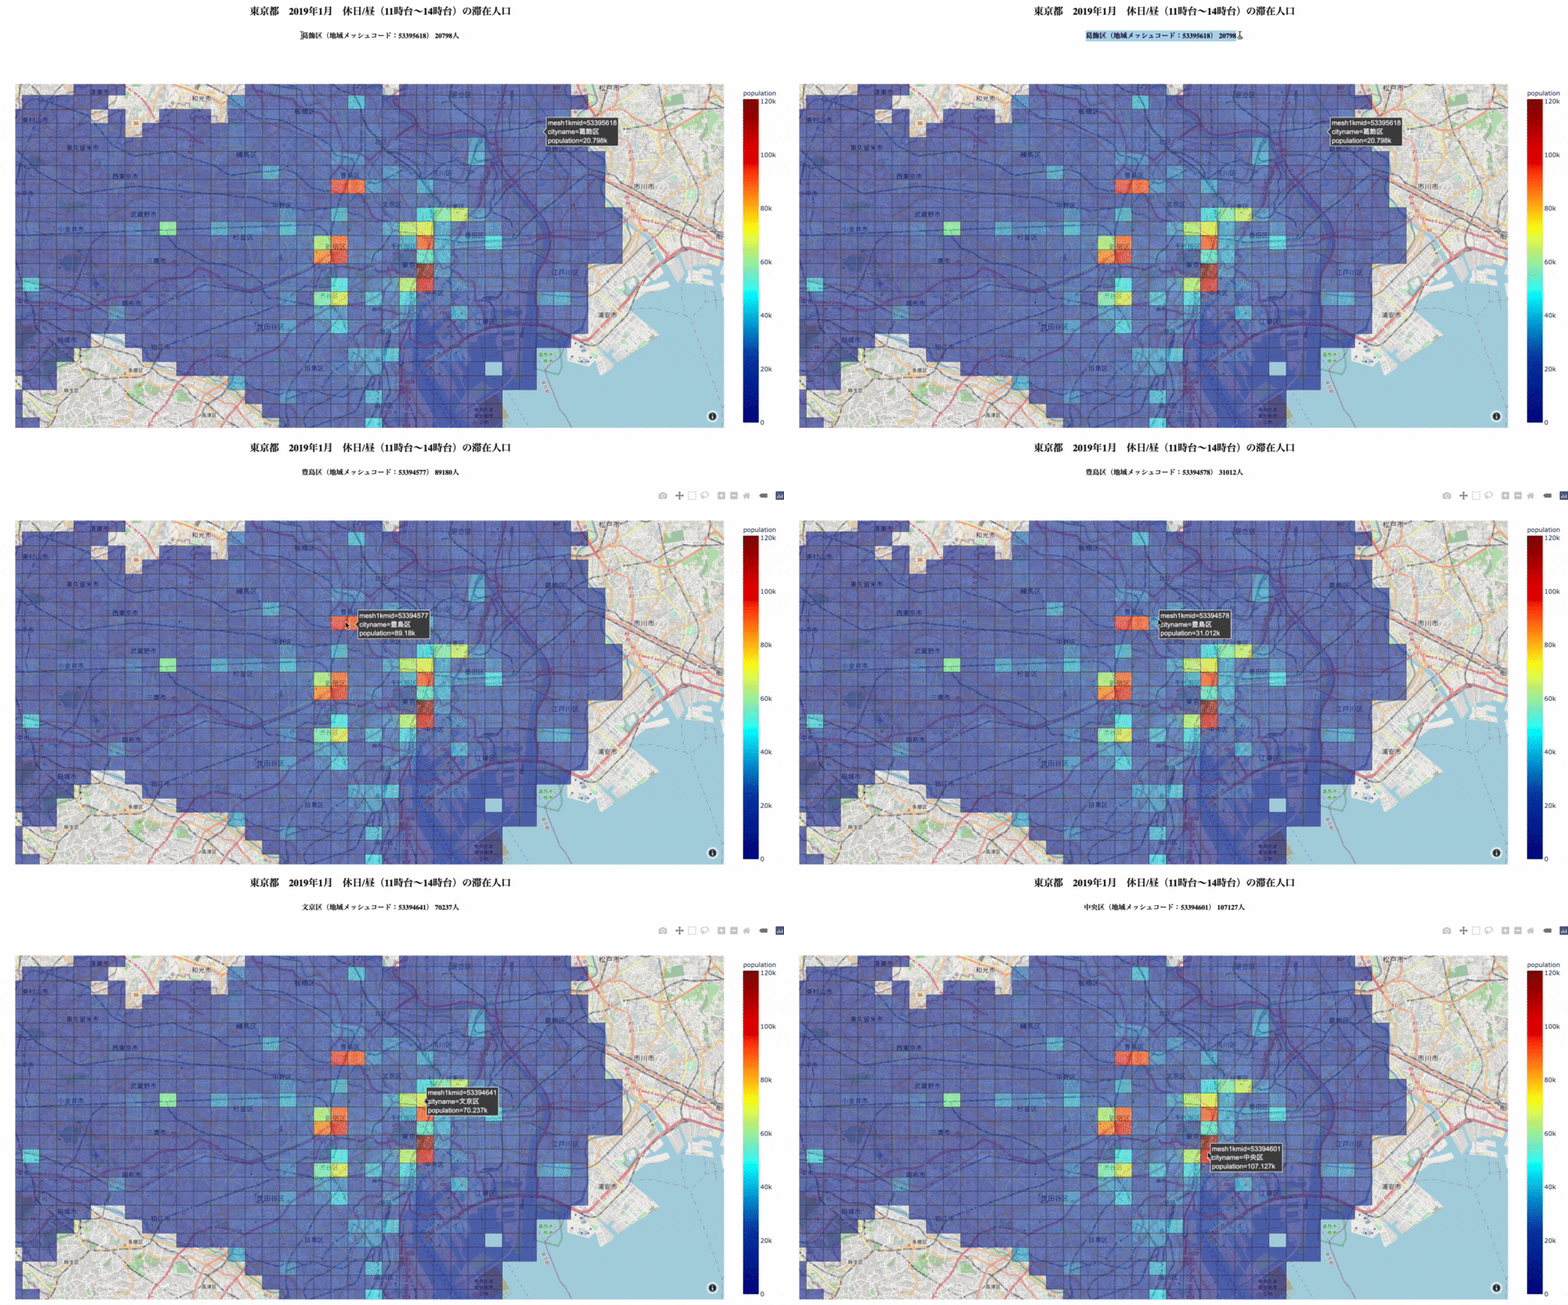
● カーソルを地図上のメッシュに合わせると、インタラクティブに地図タイトルが変わる。
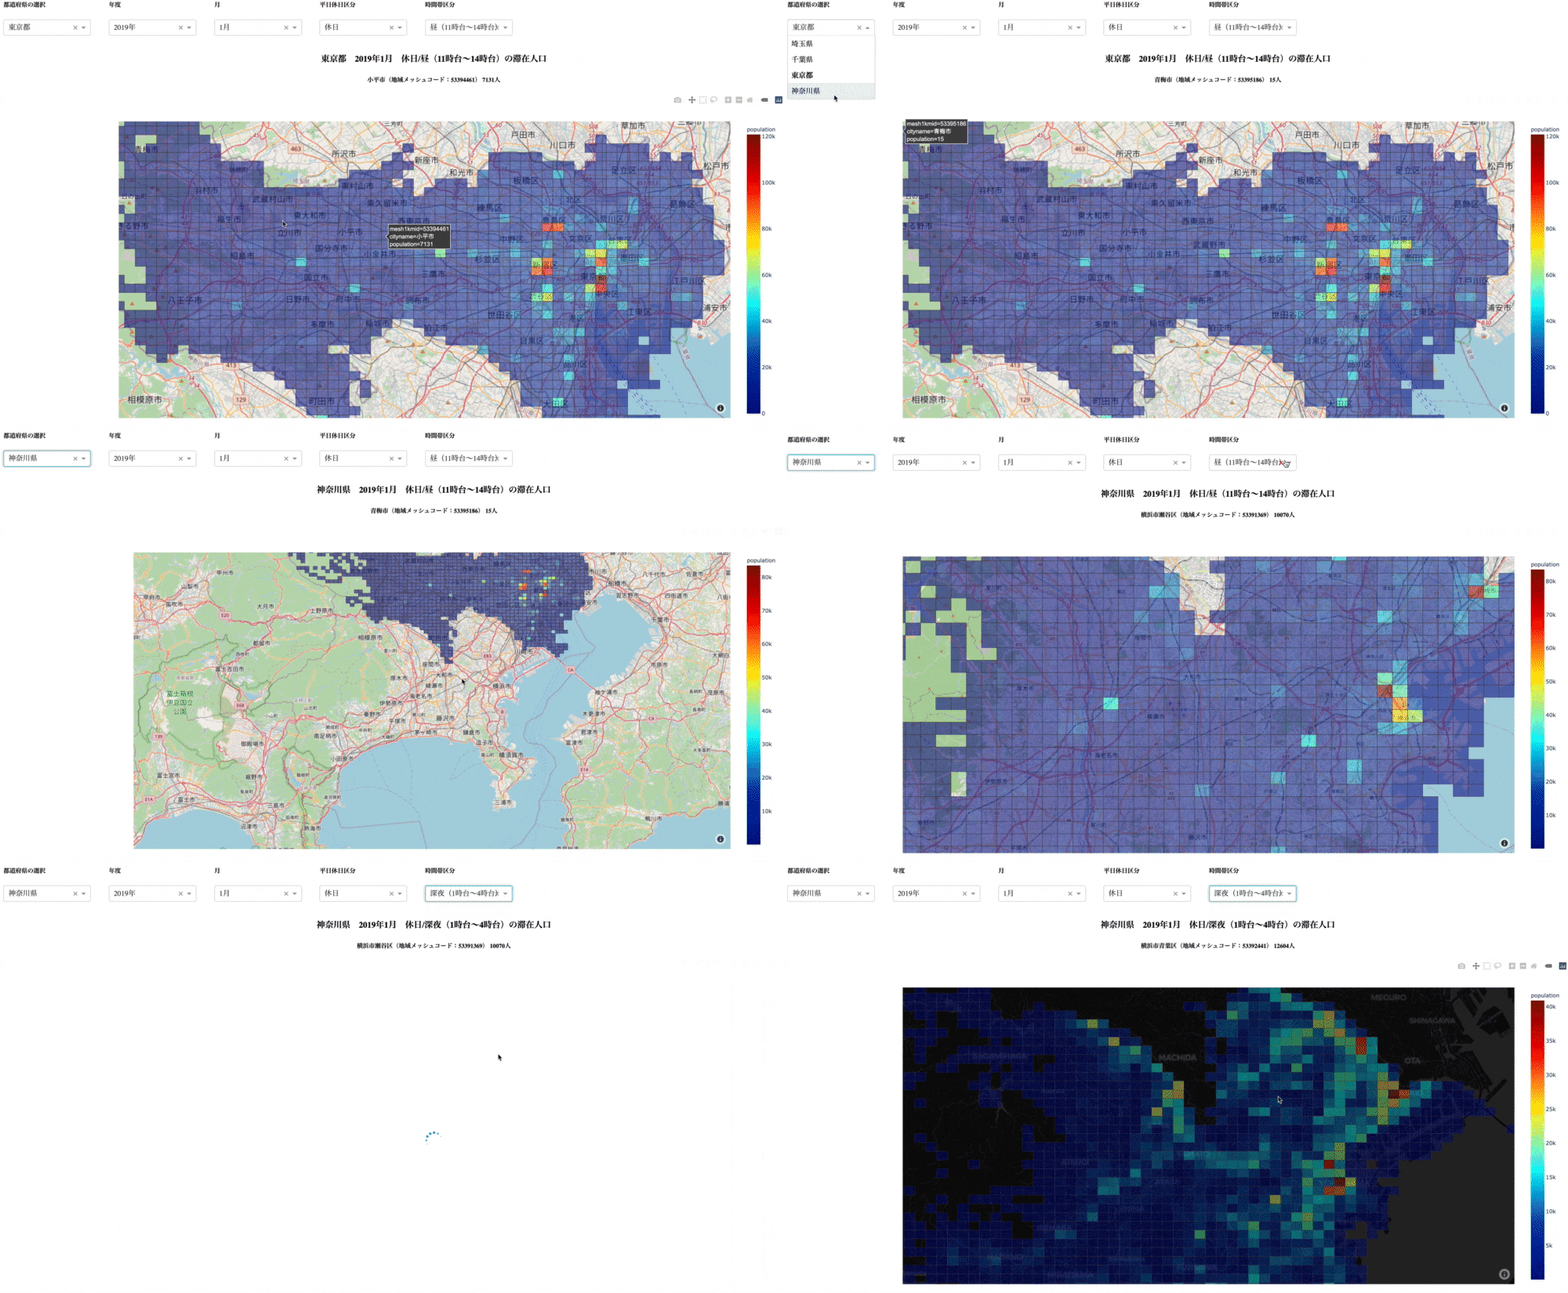
● 都道府県/年度/月/平日休日区分/時間帯区分をプルダウンおよびラジオボタンで切り替えられる。
● 時間帯区分のうち、深夜を選択すると、地図やグラフの背景が変わる。
完成形はこんな感じ(※ 今回は意図した機能を実装できるかが目的なのでデザインには触れません・・・)

2. ディレクトリ構造
ページのレイアウトやコンポーネント関数は分けて、マルチファイル構造にしようと思います。
Agoop/
├── assets/sample.png
└── data
│   └── {pref_code}_from_to_city
│   │   └── 2019/{mm}/monthly_fromto_city.csv.zip:2019年{mm}月の居住地別滞在人口
│   │   └── 2020/{mm}/monthly_fromto_city.csv.zip:2020年{mm}月の居住地別滞在人口
│   └── {pref_code}_mesh1km
│   │   └── 2019/{mm}/monthly_mdp_mesh1km.csv.zip:2019年{mm}月の1kmメッシュ滞在人口
│   │   └── 2020/{mm}/monthly_mdp_mesh1km.csv.zip:2020年{mm}月の1kmメッシュ滞在人口
│   └── attribute
│   │   └── attribute_mesh1km_2019.csv.zip:1kmメッシュ属性_2019年ver
│   │   └── attribute_mesh1km_2020.csv.zip:1kmメッシュ属性_2020年ver
│   └── prefcode_citycode_master
│       └── prefcode_citycode_master_utf8_2019.csv.zip:都道府県・市区町村マスタ-_2019年ver
│       └── prefcode_citycode_master_utf8_2020.csv.zip:都道府県・市区町村マスタ-_2020年ver
└── app.py
└── callbacks.py
└── layouts.py
└── main.py
使用データの概要や前処理はざっくりnoteにまとめたので省略します。
3. app.py(アプリの起動・初期化)
import dash

dash_stylesheets = ["https://codepen.io/chriddyp/pen/bWLwgP.css"]
app = dash.Dash(__name__, suppress_callback_exceptions=True)
server = app.server
4. layouts.py(複数コンポーネントの定義)
import dash
import dash_core_components as dcc
import dash_html_components as html

import pandas as pd
from dfply import *

prefcode_citycode_master = pd.DataFrame() # 都道府県・市区町村マスタ-
for year in [2019, 2020]:
   tmp_df02 = pd.read_csv(f'./data/prefcode_citycode_master/prefcode_citycode_master_utf8_{year}.csv.zip')
   tmp_df02['year'] = year
   prefcode_citycode_master = pd.concat([prefcode_citycode_master, tmp_df02])


# 滞在人口From-Toデータ
dfs = []
for pref_code in [11]:
   for mm in range(12):
       mm = str(mm+1).zfill(2)
       dfs.append(pd.read_csv(f'./data/{pref_code}_from_to_city/2019/{mm}/monthly_fromto_city.csv.zip'))
       dfs.append(pd.read_csv(f'./data/{pref_code}_from_to_city/2020/{mm}/monthly_fromto_city.csv.zip'))

df_fromtocity = pd.concat(dfs).reset_index(drop=True)
df_fromtocity = df_fromtocity >> inner_join(prefcode_citycode_master[['citycode', 'cityname', 'year']], by=['citycode', 'year'])
df_fromtocity['cityname'] = df_fromtocity['cityname'].apply(lambda x : x[5:] if '東京23区' in x else x)
df_fromtocity['year_mm'] = df_fromtocity['year'].astype(str) + '/' + df_fromtocity['month'].astype(str)


home_layout = html.Div([
    html.Div(dcc.Link('1kmメッシュ別滞在人口', href='/apps/app1'), style={"textAlign": "center", "fontSize": "150%"}),
    html.Div(dcc.Link('居住地別滞在人口', href='/apps/app2'), style={"textAlign": "center", "fontSize": "150%"})
])

layout1 = html.Div(
   [
       html.Div([
           html.Div(dcc.Link('居住地別滞在人口', href='/apps/app2'), style={"textAlign": "left", "fontSize": "100%"}),
           html.Div(dcc.Link('HOME', href='/'), style={"textAlign": "left", "fontSize": "100%"})
       ]),
       html.H3('人流オープンデータ(国土交通省)', style={'textAlign': 'center'}),
       html.Div(
           [
               html.Div(
                   [
                       html.H5('都道府県の選択'),
                       dcc.Dropdown(
                           id='pref-dropdown',
                           options=[
                               {'label': '埼玉県', 'value': '11埼玉県'},
                               {'label': '千葉県', 'value': '12千葉県'},
                               {'label': '東京都', 'value': '13東京都'},
                               {'label': '神奈川県', 'value': '14神奈川県'}
                           ],
                           value='13東京都',
                       ),
                   ],style={'padding': '1%', 'width': '10%'},
               ),
               html.Div(
                   [
                       html.H5('年度'),
                       dcc.Dropdown(
                           id='year-dropdown',
                           options=[
                               {'label': '2019年', 'value': 2019},
                               {'label': '2020年', 'value': 2020}
                           ],
                           value=2019,
                       ),
                   ],style={'padding': '1%', 'width': '10%'},
               ),
               html.Div(
                   [
                       html.H5('月'),
                       dcc.Dropdown(
                           id='month-dropdown',
                           options=[{'label': f'{mm+1}月', 'value': mm+1} for mm in range(12)],
                           value=1,
                       ),
                   ],style={'padding': '1%', 'width': '10%'},
               ),
               html.Div(
                   [
                       html.H5('平日休日区分'),
                       dcc.Dropdown(
                           id='dayflag-dropdown',
                           options=[
                               {'label': '休日', 'value': '0休日'},
                               {'label': '平日', 'value': '1平日'},
                               {'label': '全日', 'value': '2全日'}
                           ],
                           value='0休日',
                       ),
                   ],style={'padding': '1%', 'width': '10%'},
               ),
               html.Div(
                   [
                       html.H5('時間帯区分'),
                       dcc.Dropdown(
                           id='timezone-dropdown',
                           options=[
                               {'label': '昼(11時台〜14時台)', 'value': '0昼(11時台〜14時台)'},
                               {'label': '深夜(1時台〜4時台)', 'value': '1深夜(1時台〜4時台)'},
                               {'label': '終日(0時台〜23時台)', 'value': '2終日(0時台〜23時台)'}
                           ],
                           value='0昼(11時台〜14時台)',
                       ),
                   ],style={'padding': '1%', 'width': '10%'},
               ),
           ],style={'margin': 'auto', 'display': 'flex'},
       ),
       html.Div(
           [
               html.H3(id='map-titile', style={'textAlign': 'center'}),
               html.H5(id='hoverdata-h5', style={'textAlign': 'center'}),
               html.Div(dcc.Loading(id='loading', type='circle', children=dcc.Graph(id='population-map')), style={'width': '80%', 'margin': 'auto'}),
           ],
       ),
   ]
)


layout2 = html.Div(
   [
       html.Div([
           html.Div(dcc.Link('1kmメッシュ別滞在人口', href='/apps/app1'), style={"textAlign": "left", "fontSize": "100%"}),
           html.Div(dcc.Link('HOME', href='/'), style={"textAlign": "left", "fontSize": "100%"})
       ]),
       html.Div(
           [
               html.Div(
                   [
                       html.H5('都道府県の選択'),
                       dcc.RadioItems(
                           id='pref-radioitems',
                           options=[
                               {'label': '埼玉県', 'value': '11埼玉県'},
                               {'label': '千葉県', 'value': '12千葉県'},
                               {'label': '東京都', 'value': '13東京都'},
                               {'label': '神奈川県', 'value': '14神奈川県'}
                           ],
                           value='13東京都',
                       ),
                   ],style={'padding': '1%', 'width': '10%'},
               ),
               html.Div(
                   [
                       html.H5('平日休日区分'),
                       dcc.RadioItems(
                           id='dayflag-radioitems',
                           options=[
                               {'label': '休日', 'value': '0休日'},
                               {'label': '平日', 'value': '1平日'},
                               {'label': '全日', 'value': '2全日'}
                           ],
                           value='0休日',
                       ),
                   ],style={'padding': '1%', 'width': '10%'},
               ),
               html.Div(
                   [
                       html.H5('時間帯区分'),
                       dcc.RadioItems(
                           id='timezone-radioitems',
                           options=[
                               {'label': '昼(11時台〜14時台)', 'value': '0昼(11時台〜14時台)'},
                               {'label': '深夜(1時台〜4時台)', 'value': '1深夜(1時台〜4時台)'},
                               {'label': '終日(0時台〜23時台)', 'value': '2終日(0時台〜23時台)'}
                           ],
                           value='0昼(11時台〜14時台)',
                       ),
                   ],style={'padding': '1%', 'width': '10%'},
               ),
           ],style={'margin': 'auto', 'display': 'flex'},
       ),
       html.Div(
           [
               html.H5('市区町村選択'),
               dcc.Dropdown(
                   id='city-dropdown',
                   options=[{'label': cityname, 'value': cityname} for cityname in df_fromtocity[df_fromtocity['prefcode']==11].cityname.unique()],
                   value='千代田区',
               ),
           ],style={'padding': '1%', 'width': '10%'},
       ),
       html.Div(
           [
               html.H3(id='line-titile', style={'textAlign': 'center'}),
               html.Div(dcc.Graph(id='population-line-graph'), style={'width': '80%', 'margin': 'auto'}),
           ],
       ),
   ]
)
home_layout
layout1
-
dcc.Dropdownで選択リストと初期値を設定- 都道府県(埼玉県/千葉県/東京都/神奈川県)
- 年度(2019年/2020年)
- 月(12ヶ月)
- 平日休日区分(平日/休日/全日)
- 時間帯区分(昼/深夜/終日)
-
dcc.Graphで滞在人口のマッピング-
dcc.Loadingは地図の中身が反映されるまでのクルクルを表示させるため
-
layout2
-
dcc.RadioItemsで選択リストと初期値を設定- 都道府県(埼玉県/千葉県/東京都/神奈川県)
- 平日休日区分(平日/休日/全日)
- 時間帯区分(昼/深夜/終日)
-
dcc.Dropdownで4都県に対応する市区町村を逐一切り替えられるように設計
5. callbacks.py(動的な機能の定義)
from app import app
from dash.dependencies import Input, Output

import ast
import json
import pandas as pd
from dfply import *
import geopandas as gpd
import plotly.express as px
import plotly.graph_objects as go
from shapely.geometry import Polygon

attribute_mesh1km = pd.DataFrame() # 1kmメッシュ属性
prefcode_citycode_master = pd.DataFrame() # 都道府県・市区町村マスタ-
for year in [2019, 2020]:
   tmp_df01 = pd.read_csv(f'./data/attribute/attribute_mesh1km_{year}.csv.zip')
   tmp_df02 = pd.read_csv(f'./data/prefcode_citycode_master/prefcode_citycode_master_utf8_{year}.csv.zip')
   tmp_df01['year'] = year
   tmp_df02['year'] = year
   attribute_mesh1km = pd.concat([attribute_mesh1km, tmp_df01])
   prefcode_citycode_master = pd.concat([prefcode_citycode_master, tmp_df02])


# 滞在人口1kmメッシュデータ
dfs = []
for pref_code in [11, 12, 13, 14]:
   for mm in range(12):
       mm = str(mm+1).zfill(2)
       dfs.append(pd.read_csv(f'./data/{pref_code}_mesh1km/2019/{mm}/monthly_mdp_mesh1km.csv.zip'))
       dfs.append(pd.read_csv(f'./data/{pref_code}_mesh1km/2020/{mm}/monthly_mdp_mesh1km.csv.zip'))

df = pd.concat(dfs).reset_index(drop=True)
df = df >> inner_join(attribute_mesh1km, by=['mesh1kmid', 'prefcode', 'citycode', 'year']) >> inner_join(prefcode_citycode_master[['citycode', 'cityname', 'year']], by=['citycode', 'year'])
df['cityname'] = df['cityname'].apply(lambda x : x[5:] if '東京23区' in x else x)
df['geometry'] = df.apply(lambda x: Polygon([(x['lon_min'], x['lat_min']), (x['lon_min'], x['lat_max']), (x['lon_max'], x['lat_max']), (x['lon_max'], x['lat_min'])]), axis=1)
df = df.set_index('mesh1kmid')

# 滞在人口From-Toデータ
dfs = []
for pref_code in [11, 12, 13, 14]:
   for mm in range(12):
       mm = str(mm+1).zfill(2)
       dfs.append(pd.read_csv(f'./data/{pref_code}_from_to_city/2019/{mm}/monthly_fromto_city.csv.zip'))
       dfs.append(pd.read_csv(f'./data/{pref_code}_from_to_city/2020/{mm}/monthly_fromto_city.csv.zip'))

df_fromtocity = pd.concat(dfs).reset_index(drop=True)
df_fromtocity = df_fromtocity >> inner_join(prefcode_citycode_master[['citycode', 'cityname', 'year']], by=['citycode', 'year'])
df_fromtocity['cityname'] = df_fromtocity['cityname'].apply(lambda x : x[5:] if '東京23区' in x else x)
df_fromtocity['year_mm'] = df_fromtocity['year'].astype(str) + '/' + df_fromtocity['month'].astype(str)

@app.callback(Output('map-titile', 'children'),  Input('pref-dropdown', 'value'), Input('year-dropdown', 'value'), Input('month-dropdown', 'value'), Input('dayflag-dropdown', 'value'), Input('timezone-dropdown', 'value'))
def update_title(pref, year, month, dayflag, timezone):
   return f'{pref[2:]} {year}年{month}月 {dayflag[1:]}/{timezone[1:]}の滞在人口'

@app.callback(Output('population-map', 'figure'), Input('pref-dropdown', 'value'), Input('year-dropdown', 'value'), Input('month-dropdown', 'value'), Input('dayflag-dropdown', 'value'), Input('timezone-dropdown', 'value'))
def update_map(pref, year, month, dayflag, timezone):
   df_target = df >> mask(X.prefcode==int(f'{pref[:2]}'), X.year==year, X.month==month, X.dayflag==int(f'{dayflag[0]}'), X.timezone==int(f'{timezone[0]}'))
   if timezone=='1深夜(1時台〜4時台)':
       mapbox_style = 'carto-darkmatter'
   else:
       mapbox_style = 'open-street-map'
   fig = px.choropleth_mapbox(
       df_target, geojson=gpd.GeoSeries(df_target['geometry']).__geo_interface__, locations=df_target.index, color='population',
       color_continuous_scale='Jet', center={'lat': df_target['lat_center'].mean(), 'lon': df_target['lon_center'].mean()},
       hover_data=['cityname'], mapbox_style=mapbox_style,opacity=0.5,zoom=9, height=800,
   )
   return fig

@app.callback(Output('hoverdata-h5', 'children'), Input('population-map', 'hoverData'))
def update_map_title(hoverData):
   try:
       title = ast.literal_eval(json.dumps(hoverData, ensure_ascii=False))
       meshcode = title['points'][0]['location']
       population = title['points'][0]['z']
       location = title['points'][0]['customdata'][0]
       return f'{location}(地域メッシュコード:{meshcode}) {population}人'
   except:
       return 'NULL'

@app.callback(Output('city-dropdown', 'options'), Input('pref-radioitems', 'value'))
def update_cityname(pref):
   tmp = df_fromtocity >> mask(X.prefcode==int(f'{pref[:2]}'))
   return [{'label': cityname, 'value': cityname} for cityname in tmp['cityname'].unique()]

@app.callback(Output('population-line-graph', 'figure'), Input('city-dropdown', 'value'), Input('dayflag-radioitems', 'value'), Input('timezone-radioitems', 'value'))
def update_line_graph(cityname, dayflag, timezone):
   df_target = df_fromtocity >> mask(X.cityname==cityname, X.dayflag==int(f'{dayflag[0]}'), X.timezone==int(f'{timezone[0]}'))
   if timezone=='1深夜(1時台〜4時台)':
       template = 'plotly_dark'
   else:
       template = 'plotly_white'
   fig = go.Figure()
   fig.add_trace(go.Scatter(x=df_target[df_target['from_area']==0].year_mm, y=df_target[df_target['from_area']==0].population, mode='lines+markers',name='自市区町村'))
   fig.add_trace(go.Scatter(x=df_target[df_target['from_area']==1].year_mm, y=df_target[df_target['from_area']==1].population, mode='lines+markers',name='県内他市区町村'))
   fig.add_trace(go.Scatter(x=df_target[df_target['from_area']==2].year_mm, y=df_target[df_target['from_area']==2].population, mode='lines+markers',name='地方ブロック内他県'))
   fig.add_trace(go.Scatter(x=df_target[df_target['from_area']==3].year_mm, y=df_target[df_target['from_area']==3].population, mode='lines+markers',name='他の地方ブロック'))
   fig.update_layout(title=f'{cityname} {dayflag[1:]}/{timezone[1:]}の居住地別滞在人口', template=template, font_size=15)
   return fig
update_title
Input:プルダウンにて、現在選択中の値を受け取り、
都道府県名 YYYY年MM月 (平日or休日or全日)/(時間帯)の滞在人口の形で、
Output:html.H3(id='map-titile')へ返す。
update_map
Input:プルダウンにて、現在選択中の値を受け取り、
データフレーム(df)から該当する滞在人口レコードのみを抽出して、px.choropleth_mapboxで描画し、(この時、時間帯によって地図の背景を変更)
Output:dcc.Graph(id='population-map')へ返す。
update_map_title
Input:カーソルで合わせているメッシュ上の値を受け取り、
ast.literal_eval(json.dumps(hoverData, ensure_ascii=False))で扱いやすい形に変換&必要なデータだけを抽出し、
Output:html.H5(id='hoverdata-h5')へ返す。
update_cityname
Input:ラジオボタンにて、現在選択中の4都県の値を受け取り、
{'label': cityname, 'value': cityname}の形で、
Output:dcc.Dropdown(id='city-dropdown')のoptionsへ返す。
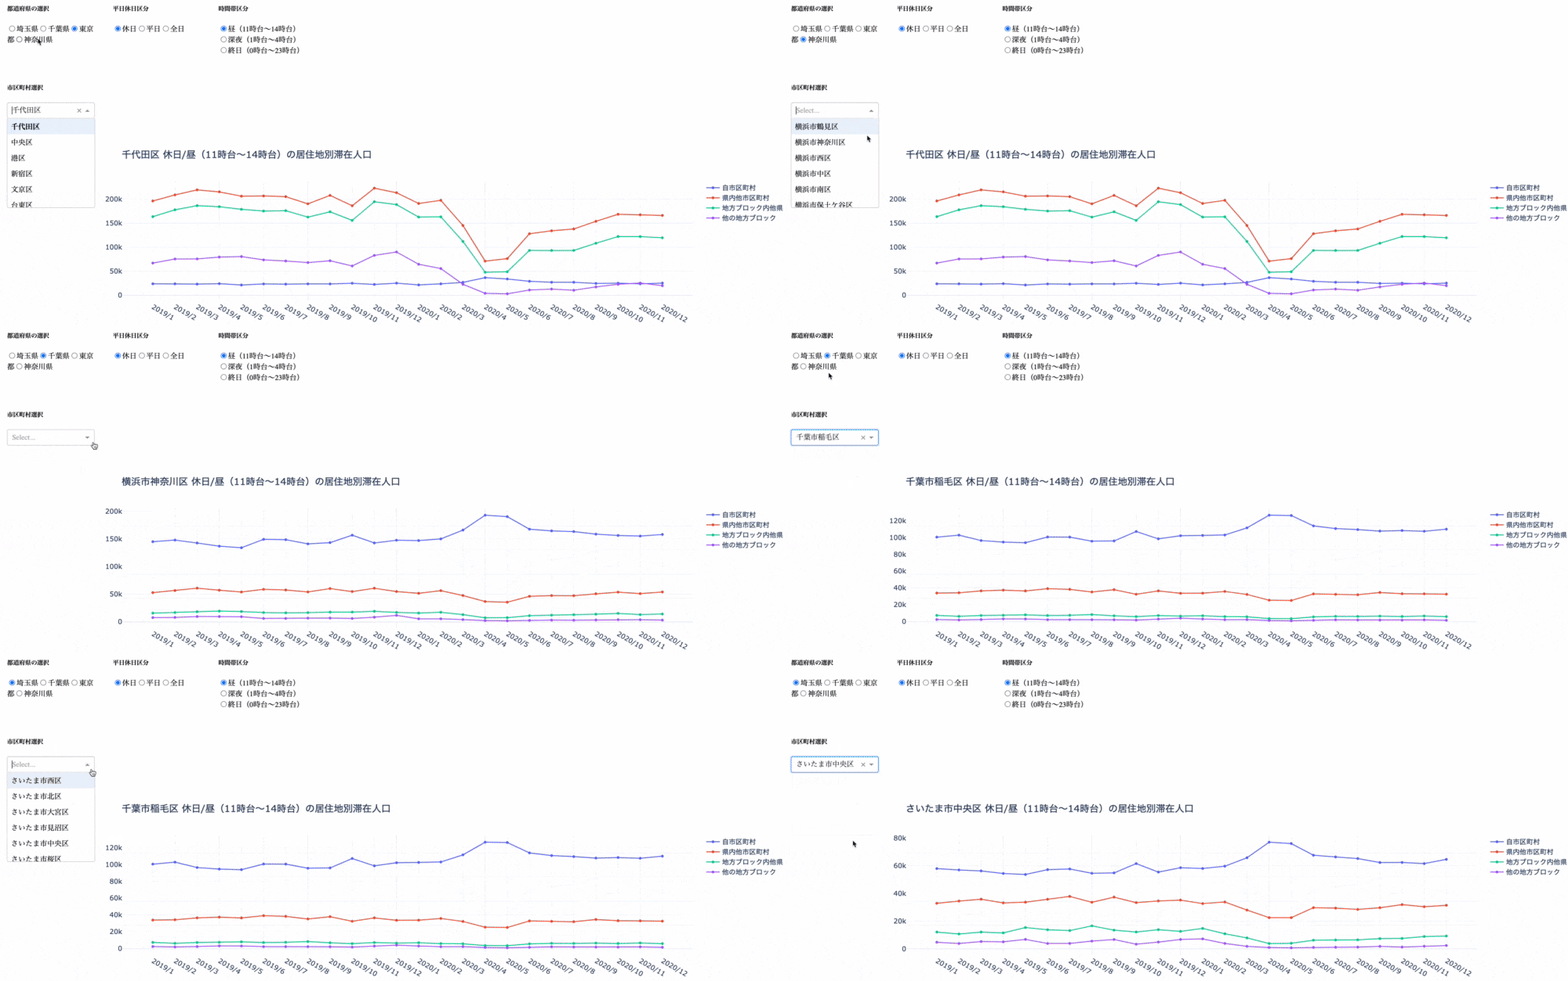
update_line_graph
Input:ラジオボタンにて、現在選択中の値を受け取り、
データフレーム(df_fromtocity)から該当する居住地別滞在人口のみを抽出して、go.Scatterで描画し、(この時、時間帯によってグラフの背景を変更)
Output:dcc.Graph(id='population-line-graph')へ返す。
6. main.py(実行ファイル)
各ページを結びつけてリンク遷移を促す。html.Imgで画像の挿入も。
from app import app
from layouts import *
import callbacks

import dash_core_components as dcc
import dash_html_components as html
from dash.dependencies import Input, Output

app.layout = html.Div([
    html.Div(html.Img(src=app.get_asset_url('sample.png'), style={'width': '80%', 'height': '80px'}), style={'textAlign': 'center'}),
    dcc.Location(id='url', refresh=False),
    html.Div(id='page-content')
])

@app.callback(Output('page-content', 'children'),
              Input('url', 'pathname'))
def display_page(pathname):
    if pathname == '/apps/app1':
         return layout1
    elif pathname == '/apps/app2':
         return layout2
    else:
        return home_layout

if __name__ == '__main__':
    app.run_server(debug=True)
ここまでできたら、python main.pyを実行
以上です!!!

