前回の記事からの続き。リアルタイムプロットで表示ラインまで選択できるようなグラフができましたが、さらにX軸とY軸を変更するような仕組みを入れてみます。
コンセプト
センサー値などはリアルタイムにY軸にプロットさせるグラフなので変更できる数値は以下とします
・Y軸は数値を変更する
・X軸はプロット数を変更する
・プロット間隔(時間軸)はセンサー読み出し部依存
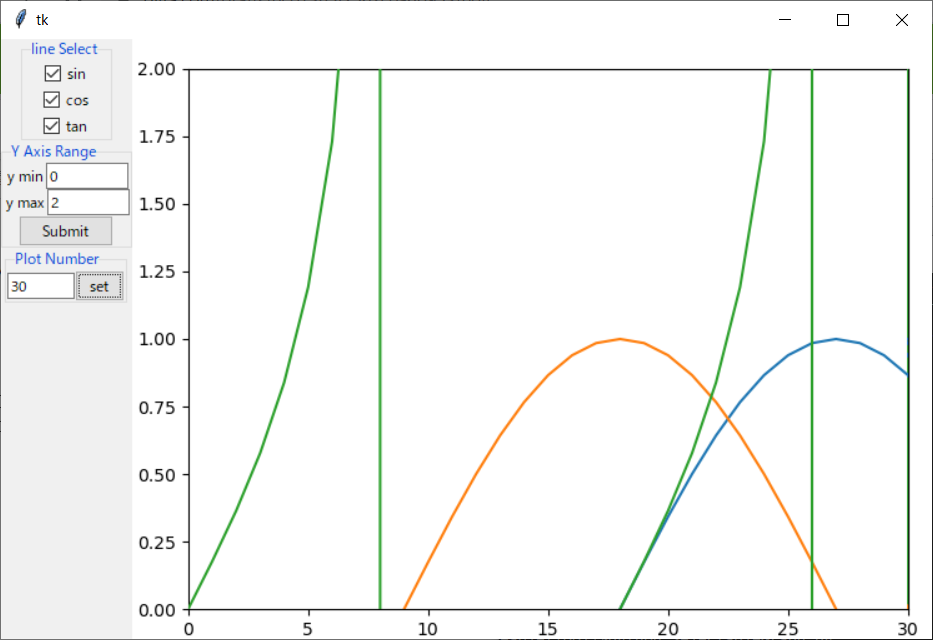
完成イメージ
というコンセプトで完成したのは下記のようなFrameとGraphとなります。
それぞれのFrameの役割
グラフ表示部
class GraphFrame(ttk.Frame):
グラフ左のコントロールパネル含めたグラフ表示とコントロールBOX
class SelectableGraph(ttk.Frame):
ユーザ依存部 こちらでグラフ数値の更新を行う
class RealtimeUpdateGraph(ttk.Frame):
ソースコード
SelectableGraph.py
import numpy as np
import tkinter as tk
import tkinter.ttk as ttk
import math

from matplotlib.backends.backend_tkagg import (
    FigureCanvasTkAgg, NavigationToolbar2Tk)
from matplotlib.figure import Figure
import matplotlib.animation as animation

class GraphFrame(ttk.Frame):
    def __init__(self, master, graph_num):
        super().__init__(master)
        #Graph view
        self.fig = Figure()
        canvas = FigureCanvasTkAgg(self.fig, master=master)
        self.x = np.arange(0, 10, 0.1)
        self.y_datas = []
        for y in range(graph_num):
            self.y_datas.append( np.zeros(100) )
        l = np.arange(0, 10, 0.01)
        self.plt = self.fig.add_subplot(111)
        self.plt.set_ylim([-2, 2])
        self.plt.set_position([0.07, 0.05, 0.9, 0.9])
        self.lines = []
        self.interval = 20
        for y in range(graph_num):
            yp, = self.plt.plot(self.y_datas[y])
            self.lines.append( yp, )

        self.ani = animation.FuncAnimation(self.fig, self.animate, l,
                                      interval=self.interval, blit=True,
        )
        canvas.get_tk_widget().pack()

    def animate(self, i):
        count = 0
        self.ani.event_source.interval = self.interval
        for line in self.lines:
            line.set_ydata(self.y_datas[count])
            count+=1
        return self.lines[0:]

    def setGraph_Y_Range(self, y_min, y_max):
        self.plt.set_position([0.07, 0.05, 0.9, 0.9])
        self.plt.set_ylim([y_max, y_min])
        self.fig.canvas.draw()

    def setGraph_X_Range(self, x):
        self.plt.set_position([0.07, 0.05, 0.9, 0.9])
        self.plt.set_xlim([0, x])
        self.fig.canvas.draw()

    def setInterval(self, interval):
        print (interval)
        self.interval = interval


    def setValues(self, vals):
        count = 0
        for val in vals:
            self.y_datas[count] = np.append(self.y_datas[count], val)
            self.y_datas[count] = np.delete(self.y_datas[count], 0)
            count+=1

    def visible(self, opts):
        count = 0
        for opt in opts:
            self.lines[count].set_visible(opt.get())
            count+=1

class SelectableGraph(ttk.Frame):
    def __init__(self, master, graph_list):
        super().__init__(master)
        self.pack()

        self.graph_num = len(graph_list)

        control_frame = ttk.Frame(self)
        control_frame.pack(side = 'left', anchor = tk.N)

        select_frame = ttk.LabelFrame(control_frame, text= "line Select",relief = 'groove')
        select_frame.pack(side = 'top', anchor = tk.N)

        range_frame = ttk.LabelFrame(control_frame, text= "Y Axis Range",relief = 'groove')
        range_frame.pack(side = 'top', anchor = tk.N)
        y_min_frame = ttk.Frame(range_frame)
        y_min = ttk.Label(y_min_frame, text='y min').pack(side = 'left')
        self.y_min_text = tk.StringVar()
        ttk.Entry(y_min_frame, textvariable=self.y_min_text, width=10).pack(side = 'right')
        self.y_min_text.set("-2")
        y_min_frame.pack(side = 'top')
        y_max_frame = ttk.Frame(range_frame)
        y_max = ttk.Label(y_max_frame, text='y max').pack(side = 'left')
        self.y_max_text = tk.StringVar()
        ttk.Entry(y_max_frame, textvariable=self.y_max_text, width=10).pack(side = 'right')
        self.y_max_text.set("2")
        y_max_frame.pack(side = 'top')
        ttk.Button(range_frame, text = 'Submit', command=self.on_y_range_submit).pack()

        interval_frame =  ttk.LabelFrame(control_frame, text= "Plot Number",relief = 'groove')
        interval_frame.pack(side = 'top', anchor = tk.N)
        self.x_text = tk.StringVar()
        ttk.Entry(interval_frame, textvariable=self.x_text, width=8).pack(side = 'left')
        self.x_text.set("100")
        ttk.Button(interval_frame, text = 'set', command=self.on_x_range_submit, width =5).pack()


        def on_check():
            self.gf.visible(opts)

        opts = [tk.BooleanVar() for _ in range(self.graph_num)]
        for item in opts:
            item.set(True)
        for i in range(self.graph_num):
            ttk.Checkbutton(select_frame, text = graph_list[i],
                            variable = opts[i], command=on_check).pack()

        graph_frame = ttk.Frame(self)
        self.gf =GraphFrame(graph_frame, self.graph_num)
        graph_frame.pack(side = 'right', fill = 'x')

    def setValues(self, vals):
        self.gf.setValues(vals)

    def on_y_range_submit(self):
        self.gf.setGraph_Y_Range( int(self.y_max_text.get()), int(self.y_min_text.get()))

    def on_x_range_submit(self):
        self.gf.setGraph_X_Range( int(self.x_text.get()) )


class RealtimeUpdateGraph(ttk.Frame):
    def __init__(self, master):
        super().__init__(master)
        self.test_count = 0
        self.master = master

        #Selectable lines
        graph_list = ["sin", "cos", "tan"]
        graph_frame = ttk.Frame(master)
        self.gf =SelectableGraph(graph_frame, graph_list)
        graph_frame.pack(side = 'right', fill = 'x')

        self.update()

    def update(self):
        vals = []
        vals.append( math.sin(math.radians(10*self.test_count)))
        vals.append( math.cos(math.radians(10*self.test_count)))
        vals.append( math.tan(math.radians(10*self.test_count)))
        self.gf.setValues( vals )
        self.test_count+=1
        self.master.after(100, self.update)


if __name__ == "__main__":
    win = tk.Tk()
    gh = RealtimeUpdateGraph(win)
    win.mainloop()
課題
コントロール部もグラフ内に入れることもできるのですが、見た目と操作性を犠牲にすべきか迷うところ。
そもそもmatplotlib標準でこれらの操作ができるような気もするのですが、ご存じの方いましたらアドバイス頂ければと思います。