SAM2とは
Metaが開発した、画像や動画に対してセグメンテーションを行う技術です。
画像と座標を指定することで画像内の物体検出を行うことができます。
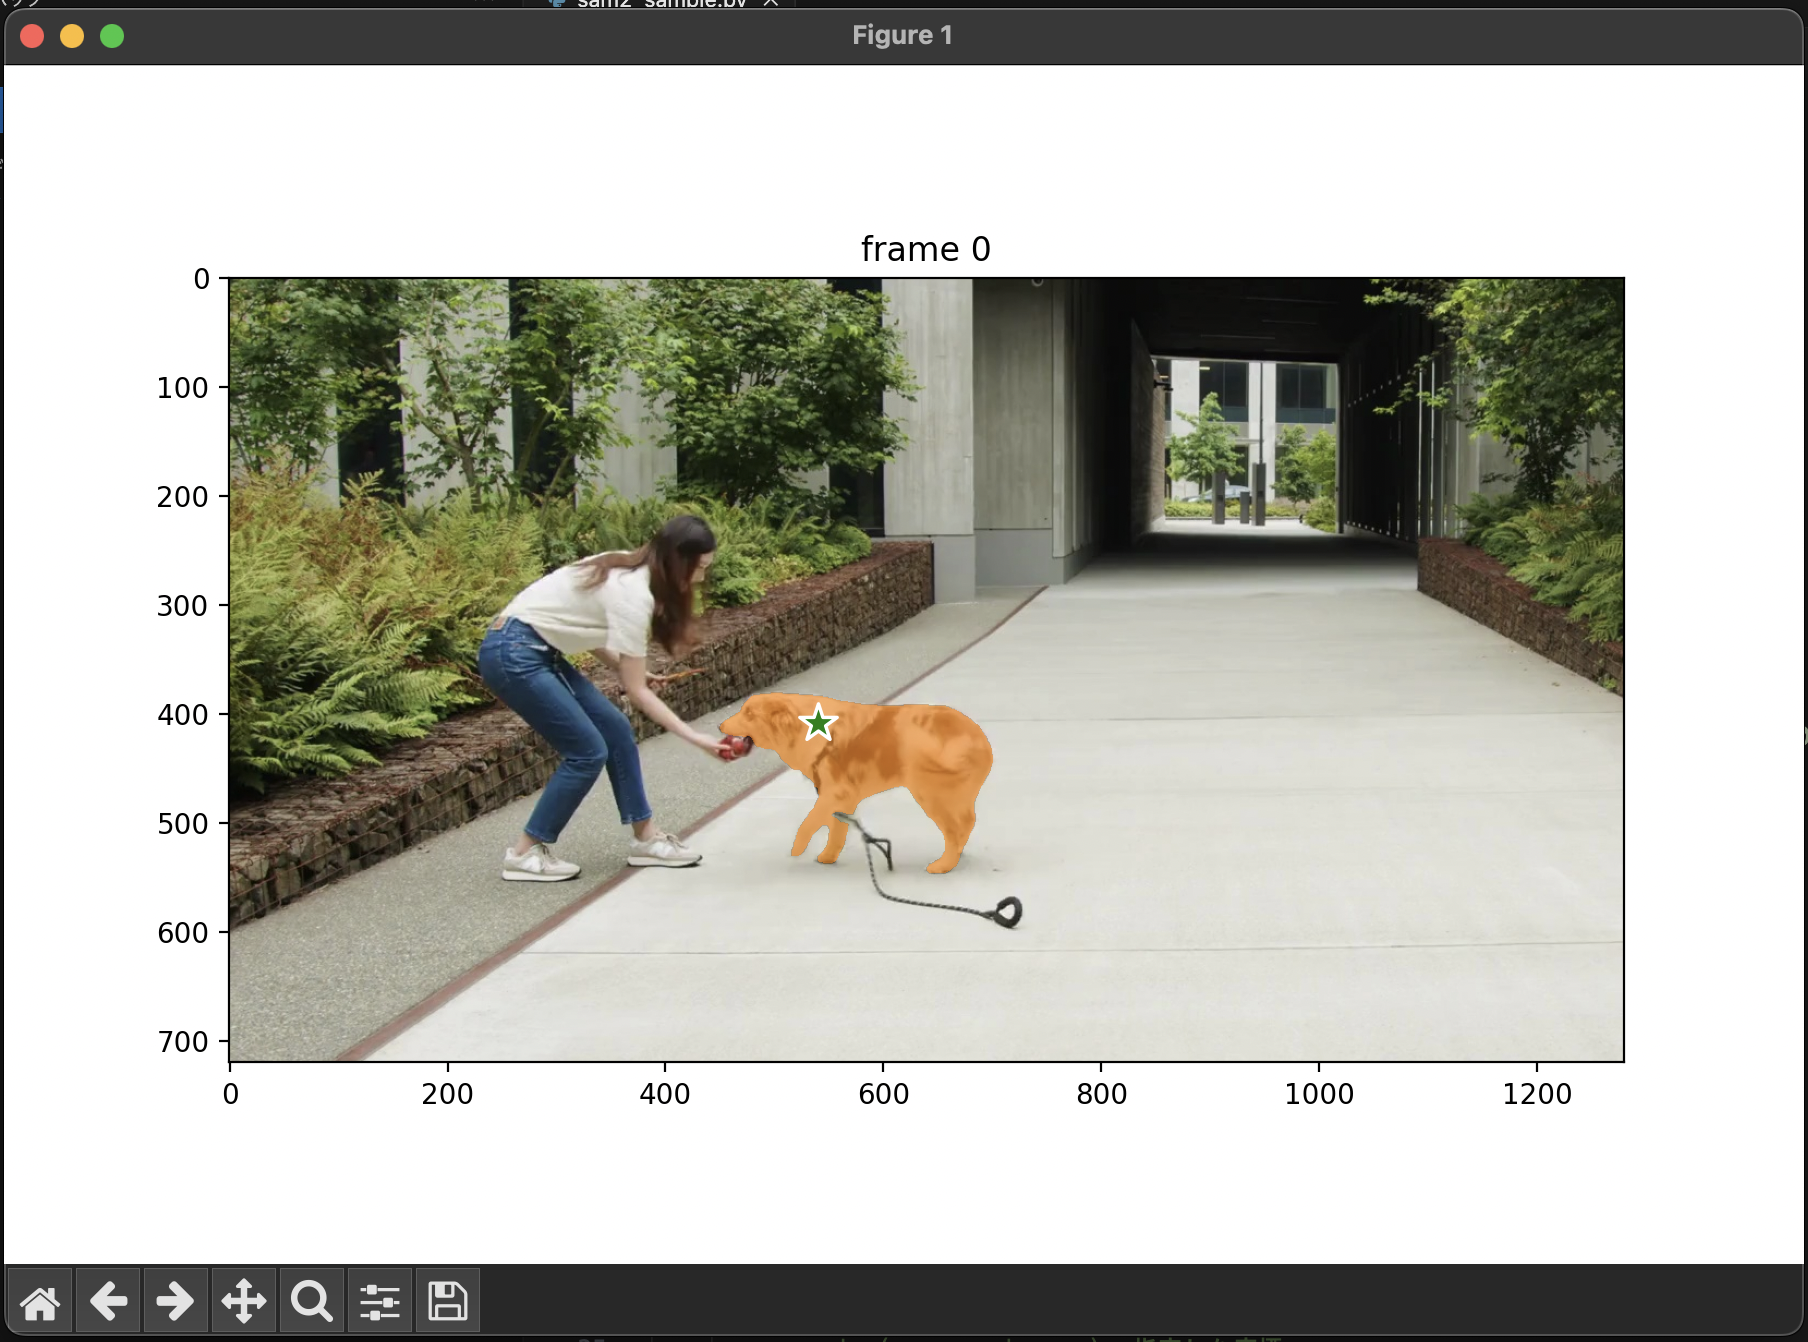
以下の例は緑色の星の位置(座標)を指定することで画像内から犬を識別し、犬の形に合わせたセグメンテーションを自動で生成しています。

環境構築
以下の手順に則って環境構築を行います。
1. GitHubより以下のリポジトリをクローン
2. 以下のコマンドを入力し、依存しているライブラリをインストール
pip install -e .
pip install -e ".[notebooks]"
3. SAM2の学習済みのAIモデルをダウンロード
cd checkpoints && \
./download_ckpts.sh && \
cd ..
AIモデルの詳細は以下の通りです。

(出典:https://github.com/facebookresearch/sam2?tab=readme-ov-file#model-description)
解析対象の動画をフレーム分割
SAM2 では MP4 と JPEG にのみ対応していますが、今回は公式のサンプルに合わせて各フレームごとの JPEGフレームをインプットに処理を行っていきます。
ffmpeg を使用して動画ファイルをJPEGフレームに変換してください。
ffmpeg -i <your_video>.mp4 -q:v 2 -start_number 0 <output_dir>/'%05d.jpg'
サンプルプログラムの実装
以下のプログラムは公式が公開しているサンプルプログラムを基に作成しています。
【前準備】 最初のフレームの表示(SAM2は使用しない)
まずは動画の最初のフレームを matplotlib に表示するプログラムを作成してみましょう。
import os
import matplotlib.pyplot as plt
from PIL import Image

# `00001.jpg`のような形式でJPEGに変換されたフレームファイルが格納されているディレクトリ
video_dir = "input/dog_images"

# ディレクトリ内のJPEGファイルをスキャンする
frame_names = [
    p for p in os.listdir(video_dir)
    if os.path.splitext(p)[-1] in [".jpg", ".jpeg", ".JPG", ".JPEG"]
]
frame_names.sort(key=lambda p: int(os.path.splitext(p)[0]))

# 最初のフレームを matplotlib で表示する
frame_idx = 0
plt.figure(figsize=(9, 6))
plt.title(f"frame {frame_idx}")
plt.imshow(Image.open(os.path.join(video_dir, frame_names[frame_idx])))
plt.show()
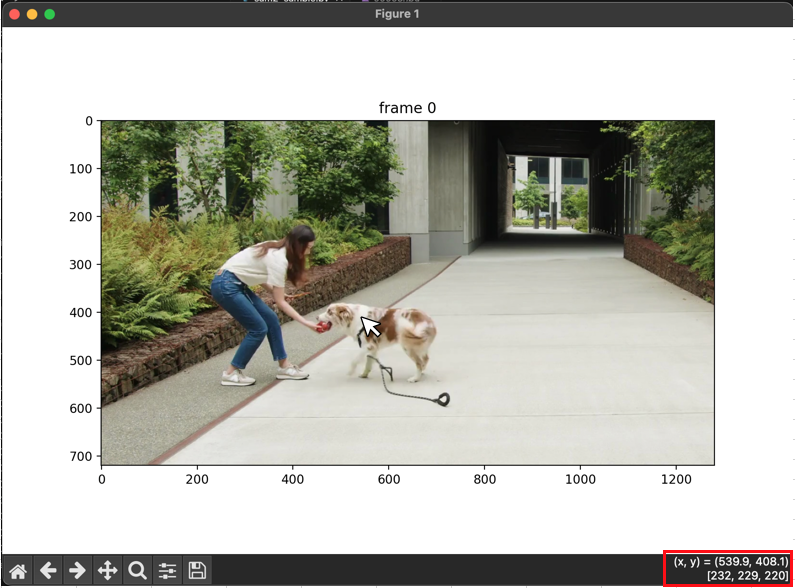
解析対象の初期フレームが表示されることを確認できました。
上記をベースに SAM2 を実行し、セグメンテーションした結果を matplotlib に表示しながら確認していきます。
今回は犬をセグメンテーションしていくので、後続処理のために犬が描画されている座標を控えておきます。(キャプチャ右下赤枠内)
1. 処理説明
build_sam2_video_predictor
解析処理を行うためのオブジェクトを生成します。
device = torch.device("cpu")

sam2_checkpoint = "../checkpoints/sam2.1_hiera_large.pt"
model_cfg = "configs/sam2.1/sam2.1_hiera_l.yaml"

predictor = build_sam2_video_predictor(model_cfg, sam2_checkpoint, device=device)
init_state
対象動画の解析情報を初期化する処理です。
初期化中に video_path 内の全ての JPEGフレームが読み込まれ、そのピクセル情報が inference_state に保存されます。
inference_state = predictor.init_state(video_path=video_dir)
中身を覗いてみると様々な設定を dict 形式で保存していることがわかります。
【参考】init_state の中身
    def init_state(
        self,
        video_path,
        offload_video_to_cpu=False,
        offload_state_to_cpu=False,
        async_loading_frames=False,
    ):
        """Initialize an inference state."""
        compute_device = self.device  # device of the model
        images, video_height, video_width = load_video_frames(
            video_path=video_path,
            image_size=self.image_size,
            offload_video_to_cpu=offload_video_to_cpu,
            async_loading_frames=async_loading_frames,
            compute_device=compute_device,
        )
        inference_state = {}
        inference_state["images"] = images
        inference_state["num_frames"] = len(images)
        # whether to offload the video frames to CPU memory
        # turning on this option saves the GPU memory with only a very small overhead
        inference_state["offload_video_to_cpu"] = offload_video_to_cpu
        # whether to offload the inference state to CPU memory
        # turning on this option saves the GPU memory at the cost of a lower tracking fps
        # (e.g. in a test case of 768x768 model, fps dropped from 27 to 24 when tracking one object
        # and from 24 to 21 when tracking two objects)
        inference_state["offload_state_to_cpu"] = offload_state_to_cpu
        # the original video height and width, used for resizing final output scores
        inference_state["video_height"] = video_height
        inference_state["video_width"] = video_width
        inference_state["device"] = compute_device
        if offload_state_to_cpu:
            inference_state["storage_device"] = torch.device("cpu")
        else:
            inference_state["storage_device"] = compute_device
        # inputs on each frame
        inference_state["point_inputs_per_obj"] = {}
        inference_state["mask_inputs_per_obj"] = {}
        # visual features on a small number of recently visited frames for quick interactions
        inference_state["cached_features"] = {}
        # values that don't change across frames (so we only need to hold one copy of them)
        inference_state["constants"] = {}
# 以下省略
add_new_points_or_box
座標や矩形領域を指定することで物体を自動検出し、out_mask_logits にセグメンテーション情報を保存します。
複数の異なる物体に対してセグメンテーションを行いたい場合は引数の obj_id に別の値を設定した状態で複数回呼び出す必要があります。
【参考】out_mask_logits の中身について
後述する「処理結果を描画する関数」に対して、セグメンテーション結果として以下の情報を渡しています。
(out_mask_logits[0] > 0.0).cpu().numpy()
この out_mask_logits[0] の中身をテキストファイルに出力してみます。
(0.0超過条件は外しています)
for index,mask_data in enumerate(out_mask_logits[0].cpu().numpy()) :
    np.savetxt(f"mask_{index}.txt",mask_data)

このような結果が得られましたが、これだと何もわかりませんね…
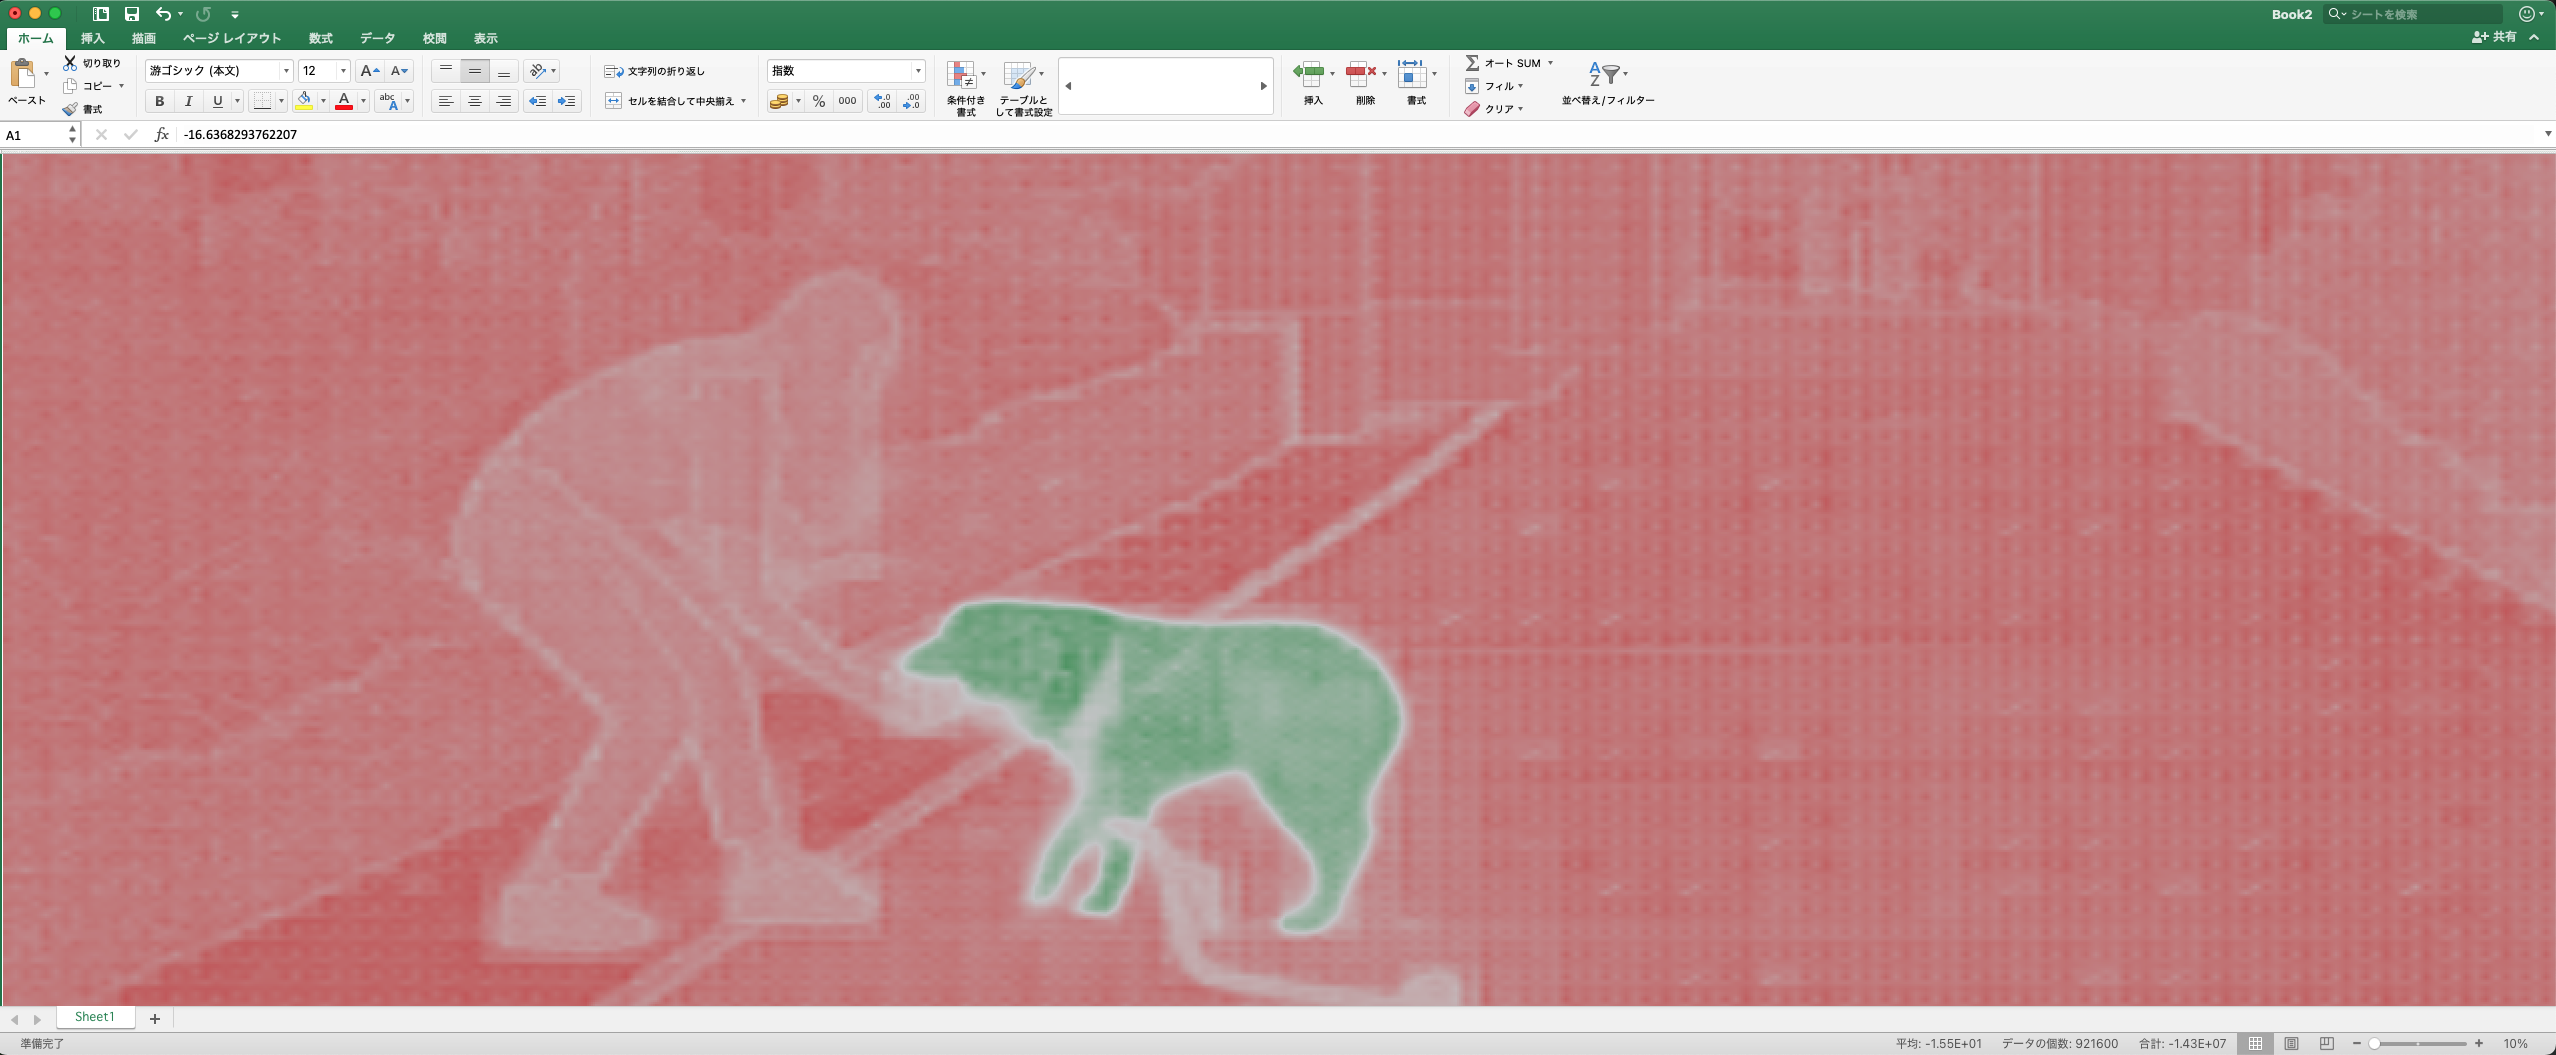
このデータの半角スペースを Tab に変換して Excel に貼り付けてみました。
セルの条件付き書式は以下のように設定しているため、正の値は緑、負の値は赤のグラデーションで表現されます。


この場合1つのセルが1ピクセルを表しており、指定座標と同じ物体であると推測されたピクセルには正の値、異なる物体と推測されたピクセルには負の値が入っていることがわかりました。
サンプルプログラムでは out_mask_logits[0] > 0.0 のように 0.0 を超過しているかどうかの真偽値に変換することではっきりとしたマスクを生成しているようです。
ann_frame_idx = 0  # 解析対象のフレームインデックス
ann_obj_id = 0  # 解析対象の物体(今回の場合は犬)に付与する一意のID(任意の整数を設定)

# 解析対象の座標(前準備にて特定した座標)
points = np.array([[539.9, 408.1]], dtype=np.float32)
# 1がPositive、0がNegativeを意味する。pointsの要素と対応している。
labels = np.array([1], np.int32)
_, out_obj_ids, out_mask_logits = predictor.add_new_points_or_box(
    inference_state=inference_state,
    frame_idx=ann_frame_idx,
    obj_id=ann_obj_id,
    points=points,
    labels=labels,
)
今回は座標を指定することで物体検出を行いますが、関数名にもある通り矩形領域を指定することでセグメンテーションを行う機能も包含されています。
矩形選択の場合のソースコード差分
# ■add_new_points_or_boxの引数

- points = np.array([[300, 400],[300,300]], dtype=np.float32)
- labels = np.array([1,0], np.int32)
- + # 対象のオブジェクトを囲うような矩形の座標。(x_min, y_min, x_max, y_max)
+ box = np.array([435, 360, 700, 560], dtype=np.float32)
_, out_obj_ids, out_mask_logits = predictor.add_new_points_or_box(
    inference_state=inference_state,
    frame_idx=ann_frame_idx,
    obj_id=ann_obj_id,
-     points=points,
-     labels=labels,
+     box=box,
)

# ■matplotlib描画箇所
- show_points(points, labels, plt.gca())
+ show_box(box, plt.gca())
matplotlib に描画するための関数
SAM2 のサンプルに記載されていた関数をそのまま使用しています。
def show_mask(mask, ax, obj_id=None, random_color=False):
    """
    SAM2の実行結果のセグメンテーションをマスクとして描画する。

    Args:
        mask (numpy.ndarray): 実行結果のセグメンテーション
        ax (matplotlib.axes._axes.Axes): matplotlibのAxis
        obj_id (int): オブジェクトID
        random_color (bool): マスクの色をランダムにするかどうか
    """
    if random_color:
        color = np.concatenate([np.random.random(3), np.array([0.6])], axis=0)
    else:
        cmap = plt.get_cmap("tab10")
        cmap_idx = 0 if obj_id is None else obj_id
        color = np.array([*cmap(cmap_idx)[:3], 0.6])
    h, w = mask.shape[-2:]
    mask_image = mask.reshape(h, w, 1) * color.reshape(1, 1, -1)
    ax.imshow(mask_image)


def show_points(coords, labels, ax, marker_size=200):
    """
    指定した座標に星を描画する。
    labelsがPositiveの場合は緑、Negativeの場合は赤。

    Args:
        coords (numpy.ndarray): 指定した座標
        labels (numpy.ndarray): Positive or Negative
        ax (matplotlib.axes._axes.Axes): matplotlibのAxis
        marker_size (int, optional): マーカーのサイズ
    """
    print(type(coords))
    print(type(labels))
    pos_points = coords[labels==1]
    neg_points = coords[labels==0]
    ax.scatter(pos_points[:, 0], pos_points[:, 1], color='green', marker='*', s=marker_size, edgecolor='white', linewidth=1.25)
    ax.scatter(neg_points[:, 0], neg_points[:, 1], color='red', marker='*', s=marker_size, edgecolor='white', linewidth=1.25)

def show_box(box, ax):
    """
    指定された矩形を描画する

    Args:
        box (numoy.ndarray): 矩形の座標情報(x_min, y_min, x_max, y_max)
        ax (matplotlib.axes._axes.Axes): matplotlibのAxis
    """
    x0, y0 = box[0], box[1]
    w, h = box[2] - box[0], box[3] - box[1]
    ax.add_patch(plt.Rectangle((x0, y0), w, h, edgecolor='green', facecolor=(0, 0, 0, 0), lw=2))
2. SAM2を実行
上記処理を組み合わせて、実際に SAM2 による解析処理を実行した結果を matplotlib に表示します。
import os
import numpy as np
import torch
import matplotlib.pyplot as plt
from sam2.build_sam import build_sam2_video_predictor

def show_mask(mask, ax, obj_id=None, random_color=False):
    """
    SAM2の実行結果のセグメンテーションをマスクとして描画する。

    Args:
        mask (numpy.ndarray): 実行結果のセグメンテーション
        ax (matplotlib.axes._axes.Axes): matplotlibのAxis
        obj_id (int): オブジェクトID
        random_color (bool): マスクの色をランダムにするかどうか
    """
    if random_color:
        color = np.concatenate([np.random.random(3), np.array([0.6])], axis=0)
    else:
        cmap = plt.get_cmap("tab10")
        cmap_idx = 0 if obj_id is None else obj_id
        color = np.array([*cmap(cmap_idx)[:3], 0.6])
    h, w = mask.shape[-2:]
    mask_image = mask.reshape(h, w, 1) * color.reshape(1, 1, -1)
    ax.imshow(mask_image)


def show_points(coords, labels, ax, marker_size=200):
    """
    指定した座標に星を描画する。
    labelsがPositiveの場合は緑、Negativeの場合は赤。

    Args:
        coords (numpy.ndarray): 指定した座標
        labels (numpy.ndarray): Positive or Negative
        ax (matplotlib.axes._axes.Axes): matplotlibのAxis
        marker_size (int, optional): マーカーのサイズ
    """
    print(type(coords))
    print(type(labels))
    pos_points = coords[labels==1]
    neg_points = coords[labels==0]
    ax.scatter(pos_points[:, 0], pos_points[:, 1], color='green', marker='*', s=marker_size, edgecolor='white', linewidth=1.25)
    ax.scatter(neg_points[:, 0], neg_points[:, 1], color='red', marker='*', s=marker_size, edgecolor='white', linewidth=1.25)

def show_box(box, ax):
    """
    指定された矩形を描画する

    Args:
        box (numoy.ndarray): 矩形の座標情報(x_min, y_min, x_max, y_max)
        ax (matplotlib.axes._axes.Axes): matplotlibのAxis
    """
    x0, y0 = box[0], box[1]
    w, h = box[2] - box[0], box[3] - box[1]
    ax.add_patch(plt.Rectangle((x0, y0), w, h, edgecolor='green', facecolor=(0, 0, 0, 0), lw=2))

device = torch.device("cpu")

sam2_checkpoint = "../checkpoints/sam2.1_hiera_large.pt"
model_cfg = "configs/sam2.1/sam2.1_hiera_l.yaml"

predictor = build_sam2_video_predictor(model_cfg, sam2_checkpoint, device=device)

# `00001.jpg`のような形式でJPEGに変換されたフレームファイルが格納されているディレクトリ
video_dir = "input/dog_images"

inference_state = predictor.init_state(video_path=video_dir)

# ディレクトリ内のJPEGファイルをスキャンする
frame_names = [
    p for p in os.listdir(video_dir)
    if os.path.splitext(p)[-1] in [".jpg", ".jpeg", ".JPG", ".JPEG"]
]
frame_names.sort(key=lambda p: int(os.path.splitext(p)[0]))

ann_frame_idx = 0  # 解析対象のフレームインデックス
ann_obj_id = 0  # 解析対象の物体(今回の場合は犬)に付与する一意のID(任意の整数を設定)

# 解析対象の座標(前準備にて特定した座標)
points = np.array([[539.9, 408.1]], dtype=np.float32)
# 1がPositive、0がNegativeを意味する。pointsの要素と対応している。
labels = np.array([1], np.int32)
_, out_obj_ids, out_mask_logits = predictor.add_new_points_or_box(
    inference_state=inference_state,
    frame_idx=ann_frame_idx,
    obj_id=ann_obj_id,
    points=points,
    labels=labels,
)

# 最初のフレームを matplotlib で表示する
plt.figure(figsize=(9, 6))
plt.title(f"frame {ann_frame_idx}")
plt.imshow(Image.open(os.path.join(video_dir, frame_names[ann_frame_idx])))
show_points(points, labels, plt.gca())
show_mask((out_mask_logits[0] > 0.0).cpu().numpy(), plt.gca(), obj_id=out_obj_ids[0])
plt.show()
画像内から犬を検出することができました。
全フレームの読み込み
propagate_in_video
ビデオ全体でセグメンテーションを行い、結果を辞書に保存します。
直前に実行した add_new_points_or_box で更新された inference_state を基に全フレームに対してセグメンテーションを伝播させています。
# ビデオ全体でセグメンテーションを行い、結果を辞書に保存する
video_segments = {}
for out_frame_idx, out_obj_ids, out_mask_logits in predictor.propagate_in_video(inference_state):
    video_segments[out_frame_idx] = {
        out_obj_id: (out_mask_logits[i] > 0.0).cpu().numpy()
        for i, out_obj_id in enumerate(out_obj_ids)
    }
上記処理を使用して動画全体のフレームを解析するプログラムは以下のようになります。
import os
import cv2
import datetime
import numpy as np
import torch
import matplotlib.pyplot as plt
from sam2.build_sam import build_sam2_video_predictor

def show_mask(mask, ax, obj_id=None, random_color=False):
    """
    SAM2の実行結果のセグメンテーションをマスクとして描画する。

    Args:
        mask (numpy.ndarray): 実行結果のセグメンテーション
        ax (matplotlib.axes._axes.Axes): matplotlibのAxis
        obj_id (int): オブジェクトID
        random_color (bool): マスクの色をランダムにするかどうか
    """
    if random_color:
        color = np.concatenate([np.random.random(3), np.array([0.6])], axis=0)
    else:
        cmap = plt.get_cmap("tab10")
        cmap_idx = 0 if obj_id is None else obj_id
        color = np.array([*cmap(cmap_idx)[:3], 0.6])
    h, w = mask.shape[-2:]
    mask_image = mask.reshape(h, w, 1) * color.reshape(1, 1, -1)
    ax.imshow(mask_image)


def show_points(coords, labels, ax, marker_size=200):
    """
    指定した座標に星を描画する。
    labelsがPositiveの場合は緑、Negativeの場合は赤。

    Args:
        coords (numpy.ndarray): 指定した座標
        labels (numpy.ndarray): Positive or Negative
        ax (matplotlib.axes._axes.Axes): matplotlibのAxis
        marker_size (int, optional): マーカーのサイズ
    """
    pos_points = coords[labels==1]
    neg_points = coords[labels==0]
    ax.scatter(pos_points[:, 0], pos_points[:, 1], color='green', marker='*', s=marker_size, edgecolor='white', linewidth=1.25)
    ax.scatter(neg_points[:, 0], neg_points[:, 1], color='red', marker='*', s=marker_size, edgecolor='white', linewidth=1.25)

def show_box(box, ax):
    """
    指定された矩形を描画する

    Args:
        box (numoy.ndarray): 矩形の座標情報(x_min, y_min, x_max, y_max)
        ax (matplotlib.axes._axes.Axes): matplotlibのAxis
    """
    x0, y0 = box[0], box[1]
    w, h = box[2] - box[0], box[3] - box[1]
    ax.add_patch(plt.Rectangle((x0, y0), w, h, edgecolor='green', facecolor=(0, 0, 0, 0), lw=2))

starttime = datetime.datetime.now()
device = torch.device("cpu")

sam2_checkpoint = "../checkpoints/sam2.1_hiera_tiny.pt"
model_cfg = "configs/sam2.1/sam2.1_hiera_t.yaml"

predictor = build_sam2_video_predictor(model_cfg, sam2_checkpoint, device=device)

# `00001.jpg`のような形式でJPEGに変換されたフレームファイルが格納されているディレクトリ
video_dir = "input/dog_images"

inference_state = predictor.init_state(video_path=video_dir)

# ディレクトリ内のJPEGファイルをスキャンする
frame_names = [
    p for p in os.listdir(video_dir)
    if os.path.splitext(p)[-1] in [".jpg", ".jpeg", ".JPG", ".JPEG"]
]
frame_names.sort(key=lambda p: int(os.path.splitext(p)[0]))

ann_frame_idx = 0  # 解析対象のフレームインデックス
ann_obj_id = 0  # 解析対象の物体(今回の場合は犬)に付与する一意のID(任意の整数を設定)

# 解析対象の座標(前準備にて特定した座標)
points = np.array([[539.9, 408.1],[645,415]], dtype=np.float32)
# 1がPositive、0がNegativeを意味する。pointsの要素と対応している。
labels = np.array([1,0], np.int32)
_, out_obj_ids, out_mask_logits = predictor.add_new_points_or_box(
    inference_state=inference_state,
    frame_idx=ann_frame_idx,
    obj_id=ann_obj_id,
    points=points,
    labels=labels,
)

# ビデオ全体でセグメンテーションを行い、結果を辞書に保存する
video_segments = {}
for out_frame_idx, out_obj_ids, out_mask_logits in predictor.propagate_in_video(inference_state):
    video_segments[out_frame_idx] = {
        out_obj_id: (out_mask_logits[i] > 0.0).cpu().numpy()
        for i, out_obj_id in enumerate(out_obj_ids)
    }

plt.close("all")
for out_frame_idx in range(len(frame_names)):
    plt.figure(figsize=(6, 4))
    plt.title(f"frame {out_frame_idx}")
    plt.axis('off')
    plt.tight_layout(pad=0)

    # cv2はデフォルトがBGRのため、RGBに変換してから出力する
    image = cv2.imread(os.path.join(video_dir, frame_names[out_frame_idx]))
    plt.imshow(cv2.cvtColor(image, cv2.COLOR_BGR2RGB))

    # マスクの描画
    for out_obj_id, out_mask in video_segments[out_frame_idx].items():
        show_mask(out_mask, plt.gca(), obj_id=out_obj_id)

    # マスク済みの画像を出力する
    file_name = os.path.basename(frame_names[out_frame_idx])
    plt.savefig(os.path.join("result", file_name))
    plt.close()

print(f"処理時間:{datetime.datetime.now() - starttime}")
正しくフレーム追跡できているようです。
もう少し先のフレームも見てみましょう。
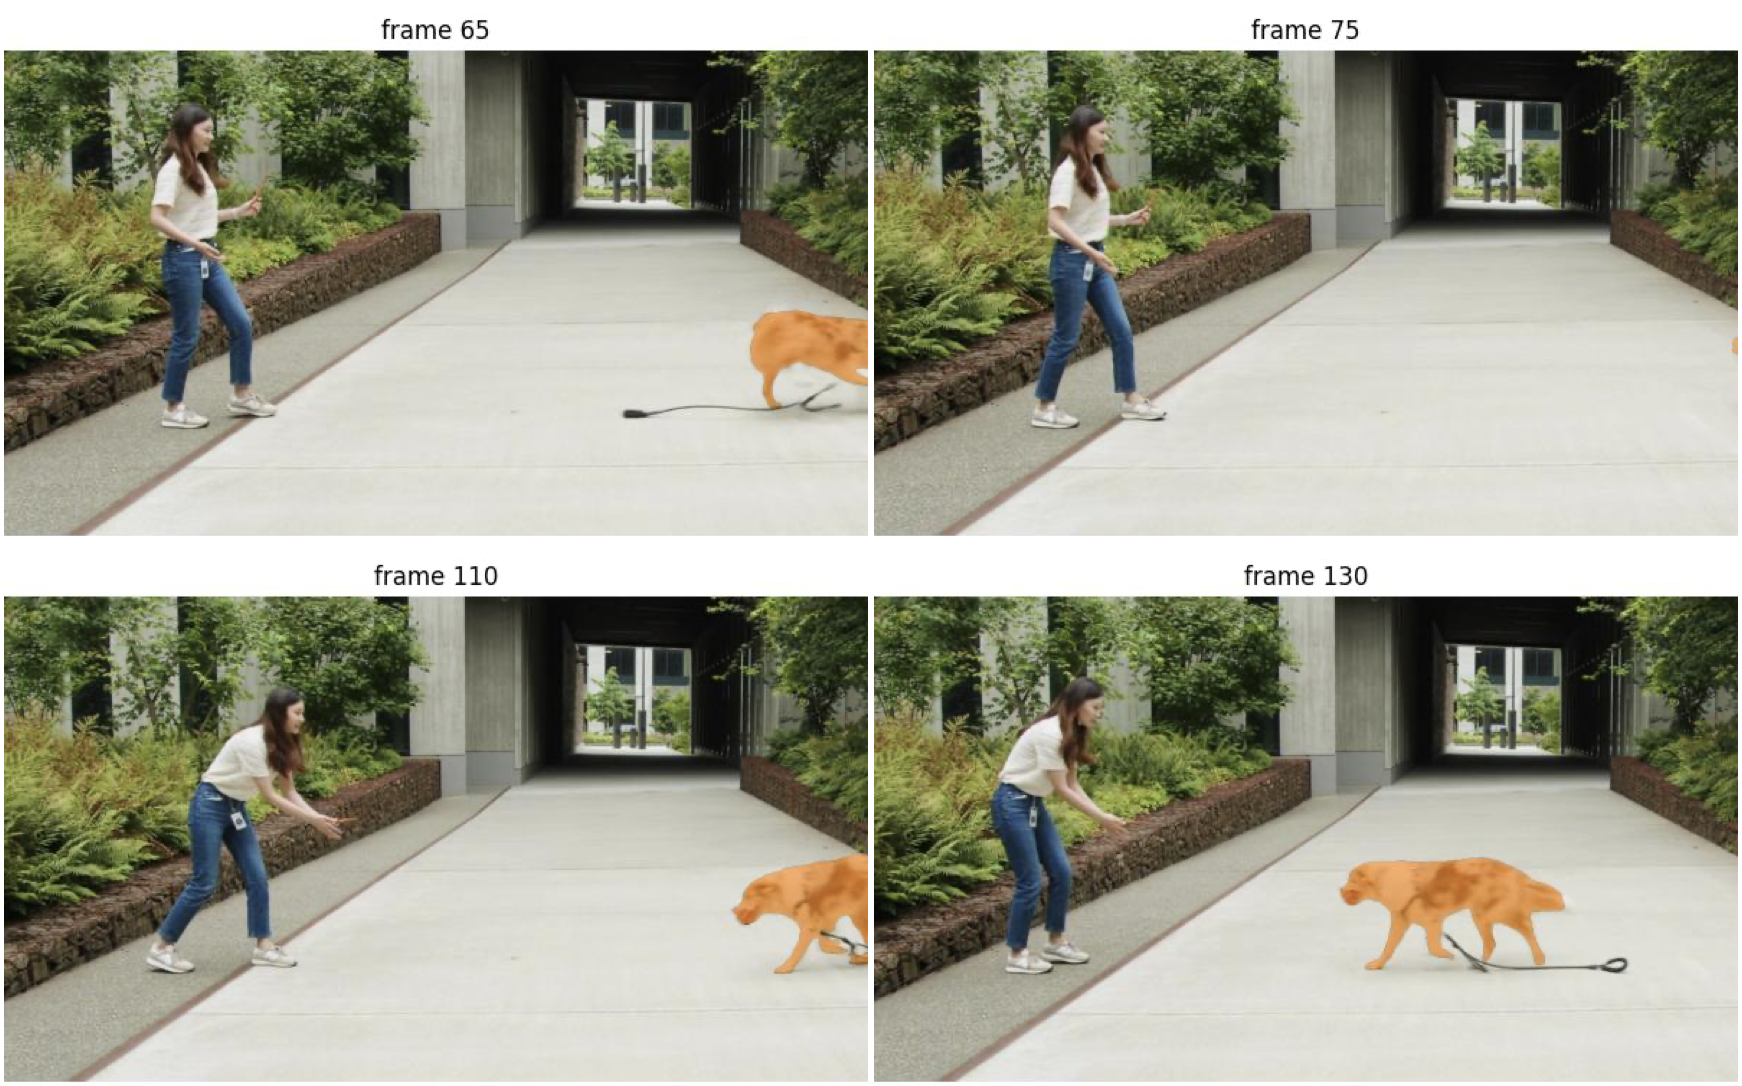
ボールを追いかけた犬が frame65 で体の一部がカメラの外に出てしまい、 frame75 では体の全体がカメラ外に出てしまいました。
しかし frame110 で再度犬が登場するときちんとセグメンテーションしてくれています。
add_new_points_or_box で記憶したオブジェクトはフレームアウトした場合でも再度登場時にきちんと認識してくれるようです。
性能について(CPU)
今回の検証は CPU で実行しているため、GPU と比較すると性能はかなり低くなりますが、全288フレームの動画を処理するのにかかった時間は以下の通りでした。
(検証PC : Macbook Air M1チップ 16GB)
| AIモデル | 処理時間 | 1フレームあたりの処理時間 |
|---|---|---|
| sam2.1_hiera_tiny.pt | 0:18:22.243981 | 約3.8秒 |
| sam2.1_hiera_large.pt | 0:37:42.316260 | 約7.9秒 |
CUDA などを使用できる環境であれば処理時間は大幅に短縮できると思いますので、
参考程度にお考えください。


