はじめに
機械学習の入門として、kaggleのTitanicに挑戦してみました。
このコンペは、1912年に起きたタイタニック号沈没事件について、乗客の年齢や性別などから、生死を予測する分類問題です。
今回の分析に使った、コードはTitanicコードに載せています。
データの概要
データ数
まずは、train、testのデータ数をそれぞれ確認します。
# trainデータ
print(train.shape)
# testデータ
print(test.shape)
(891, 12)
(418, 11)
trainデータはtestデータの約2倍のデータ数があり、説明変数は11個あるということがわかりました。
次に、説明変数について見ていきたいと思います。
変数確認
# 全変数を確認
train.columns
Index(['PassengerId', 'Survived', 'Pclass', 'Name', 'Sex', 'Age', 'SibSp',
       'Parch', 'Ticket', 'Fare', 'Cabin', 'Embarked'],
      dtype='object')
全変数を出力してみました。それぞれについて、コンペサイトの説明を見ると以下のようになっています。
| 変数名 | 説明 | |
|---|---|---|
| 1 | PassengerId | 乗客ID |
| 2 | Pclass | チケットのクラス |
| 3 | Name | 名前 |
| 4 | Sex | 性別 |
| 5 | Age | 年齢 |
| 6 | SibSp | 一緒に乗船している兄弟・夫婦の数 |
| 7 | Parch | 一緒に乗船している子供・親の数 |
| 8 | Ticket | チケット番号 |
| 9 | Fare | 乗船料金 |
| 10 | Cabin | 客室 |
| 11 | Embarked | 乗船した港(C:Cherbourg, Q:Queenstown, S:Southampton) |
| 12 | Survived | 生死(目的変数) |
欠損値の確認
# trainデータの欠損値
train.isnull().sum()[train.isnull().sum()>0]
Age         177
Cabin       687
Embarked      2
dtype: int64
# testデータの欠損値
test.isnull().sum()[test.isnull().sum()>0]
Age       86
Fare       1
Cabin    327
dtype: int64
目的変数の分布
学習データでは、死者が生存者の約1.5倍近くいます。
したがって、生存者をいかにして見つけるかという事が分析の鍵となるでしょう。
説明変数ごとの分布
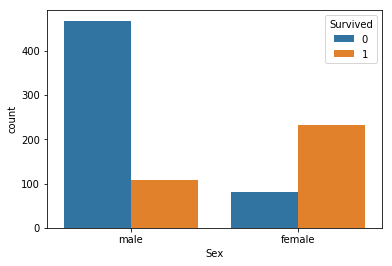
性別(Sex)

男女別に、目的変数との関係を可視化しました。
女性の方が男性よりも生存率が高いという事が分かります。
男女で、ダミー変数化した方が良さそうです。
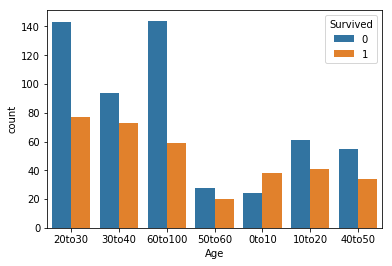
年齢(Age)

年齢をビン分けし、目的変数との関係を可視化しました。
0~10歳までは生存率が高いのに対し、70歳以上では大きく生存率が低下しています。
0~10, 10~70, 70~100でマッピングした方が良さそうです。
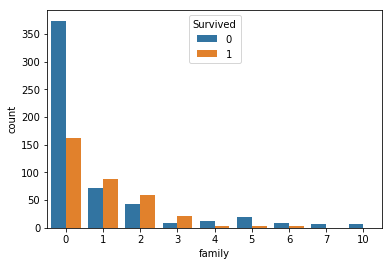
家族(family)

'SibSp'と'Parch'という変数は、合わせられるとkanngae,'family'という変数を作成しました。
単独で乗った人の生存率は低いようです。
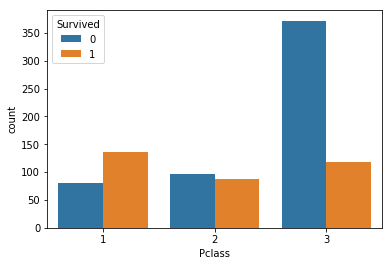
チケットのクラス(Pclass)

チケットのクラスと目的変数との関係を可視化しました。
クラスの低い3のチケットを持つ人は、生存率が低いようです。
クラス1、2とクラス3でマッピングした方が良さそうです。
前処理
データの可視化を元に、前処理を行いました。
# 'Sex'をマッピング
sex_mapping = {'male':0, 'female':1}
train['Sex'] = train['Sex'].map(sex_mapping)
test['Sex'] = test['Sex'].map(sex_mapping)

# 'Age'の欠損値を平均値補完
train['Age'] = train['Age'].fillna(train['Age'].mean())
test['Age'] = test['Age'].fillna(test['Age'].mean())

def age(x):
    if x < 10:
        x = 0
    elif x < 20:
        x = 1
    elif x < 30:
        x = 1
    elif x < 40:
        x = 1
    elif x < 50:
        x = 1
    elif x < 60:
        x = 1
    else:
        x = 2
    return x

train['Age'] = train['Age'].apply(age)
test['Age'] = test['Age'].apply(age)
# 'family'という特徴量を新たに作成
train['family'] = train['SibSp'] + train['Parch']
test['family'] = test['SibSp'] + test['Parch']

# 'Pclass'をマッピング
def pclass(x):
    if x <=2:
        x = 0
    else:
        x = 1
    return x

train['Pclass'] = train['Pclass'].apply(pclass)
test['Pclass'] = test['Pclass'].apply(pclass)

test['Fare'] = test['Fare'].fillna(test['Fare'].mean())
データの取り出し・標準化・グリッドサーチ・学習
特徴量は4つ使って標準化を行いました。
# X, yにデータを代入
X = train.loc[:, ['Sex', 'Age', 'family', 'Pclass']].values
y = train.loc[:, ['Survived']].values.reshape(-1)

# データの標準化
scaler = StandardScaler()
X_std = scaler.fit_transform(X)
また、SVMを用いて、最も良いパラメータの組み合わせをグリッドサーチで探します。
# データの分割方法を指定(層化)
kf = StratifiedKFold(n_splits=5, shuffle=True, random_state=0)
# 調整したいパラメータを指定
param_grid = {'C': [0.1, 1.0, 10, 100, 1000, 10000],
              'gamma': [0.001, 0.01, 0.1, 1, 10]}
# GridSearchCVのインスタンスを生成
from sklearn.model_selection import GridSearchCV
from sklearn.svm import SVC
# モデルのインスタンス, 試したいパラメータの値, 分割方法
gs_svc = GridSearchCV(SVC(), param_grid, cv=kf)
# 学習
gs_svc.fit(X_std, y)
結果・まとめ・反省
学習モデルを使って予測したところ、3346/9755位という結果でした。
少ない変数の割にはある程度の精度が出せたと思います。
しかし、他の特徴量を追加したり、学習モデルで他のアルゴリズムを使うなど、改善点も多くあります。
近日中に、もう一度チャレンジして見たいです。
