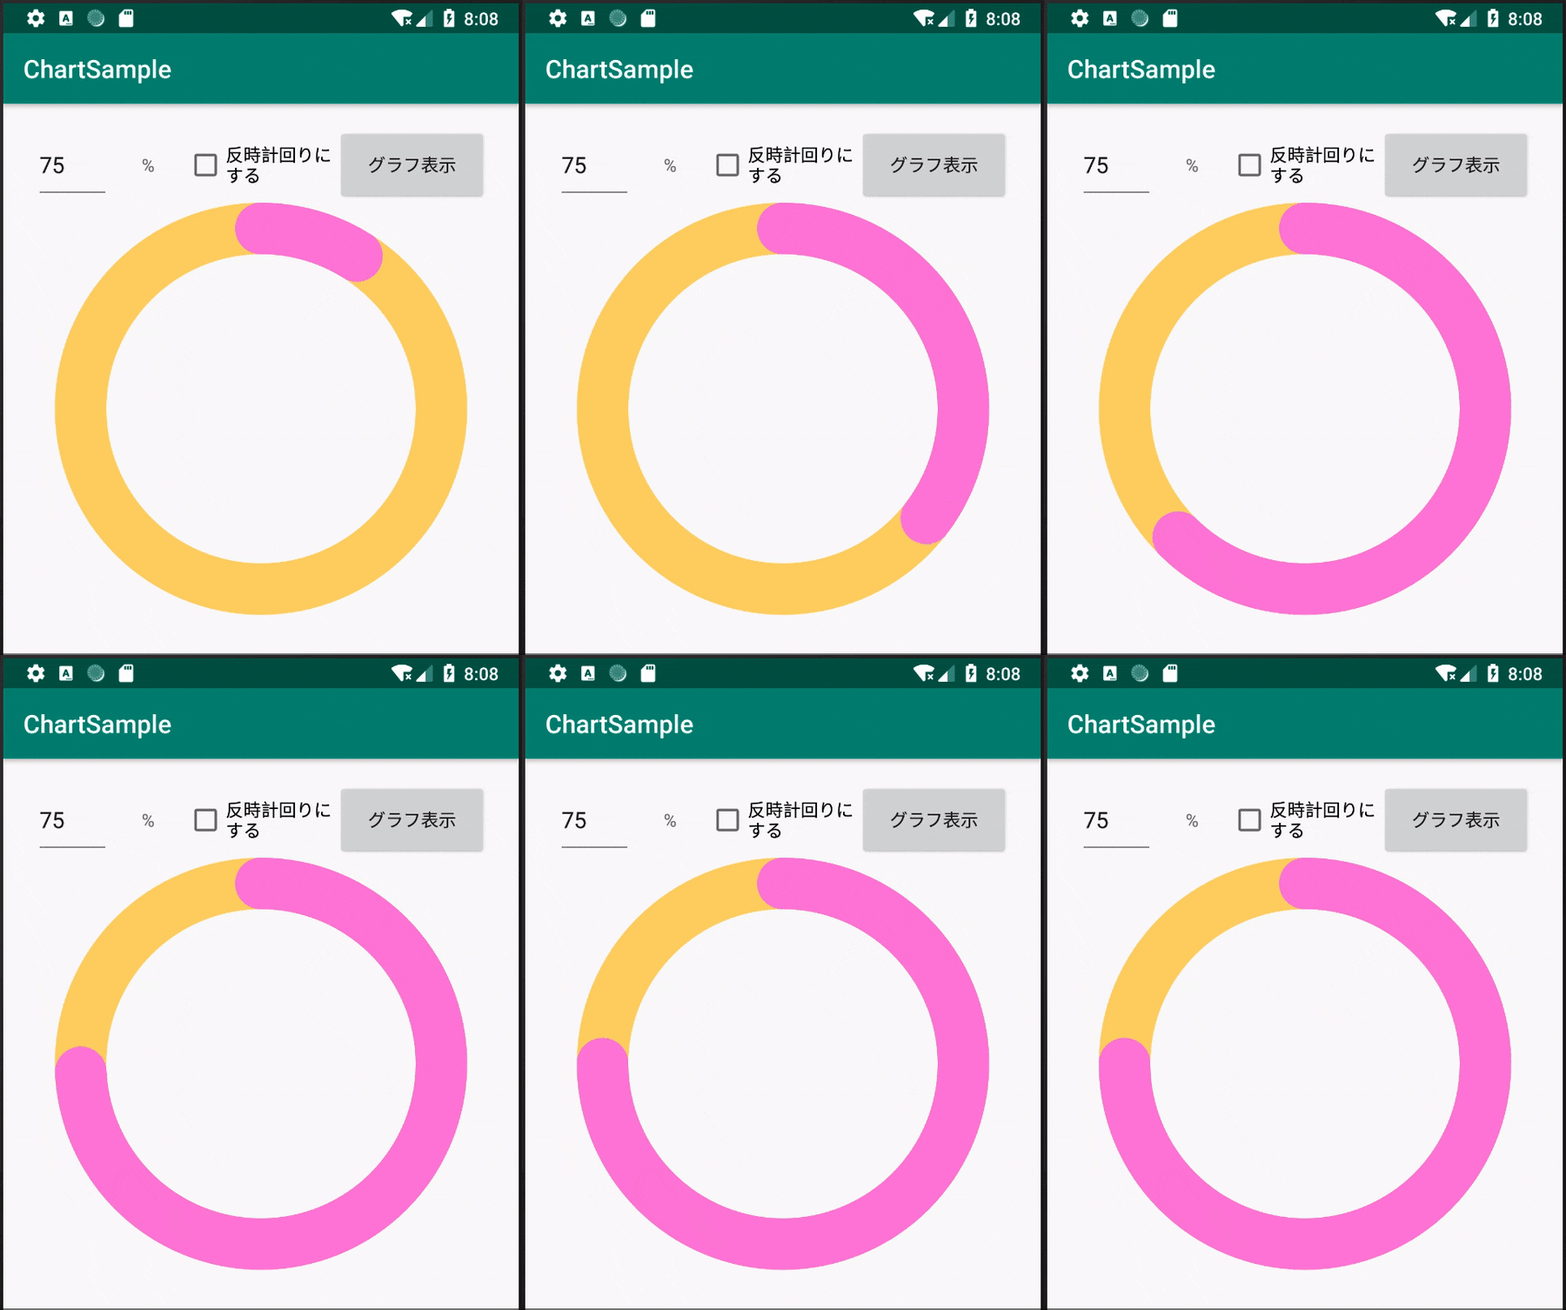
今回はiOSのヘルスケアアプリで見かけるような始点・終点を丸くした円グラフをAndroidで作ってみました。
そうこんなやつです。

環境:Kotlin 1.3、Android Studio 3.3.1
#円グラフを描画するViewの作成
まず円グラフを描画するViewを作成します。
円(半円)の描画はCanvasのdrawArcメソッドを使用して行います。
package com.example.chartsample

import android.content.Context
import android.graphics.Canvas
import android.graphics.Color
import android.graphics.Paint
import android.graphics.RectF
import android.view.View

class ChartView: View {
    var rate:Float = 0f // 0 - 100の間で指定
    var isNotClockWise:Boolean = false //false 時計回り true 反時計回り

    /**
     * コンストラクタ
     */
    constructor(context: Context) : super(context, null)

    /**
     * 描画処理
     */
    override fun onDraw(canvas: Canvas?) {
        super.onDraw(canvas)
        drawBaseChart(canvas)
        drawValueChart(canvas)
    }

    /**
     * 円グラフの軸となる円の表示
     */
    private fun drawBaseChart(canvas:Canvas?){
        val paint = Paint()
        paint.setColor(Color.rgb(255,212,121))
        val storkeWidth:Float = (getWidth() / 8).toFloat()
        paint.setStrokeWidth(storkeWidth)
        paint.setAntiAlias(true)
        paint.setStyle(Paint.Style.STROKE)
        paint.strokeCap = Paint.Cap.ROUND
        val rect = RectF(storkeWidth/2, storkeWidth/2, getWidth().toFloat()-storkeWidth/2, getHeight().toFloat()-storkeWidth/2)
        canvas!!.drawArc(rect, 0f, 360f, false, paint)
    }

    /**
     * 円グラフの値を示す円(半円)の表示
     */
    private fun drawValueChart(canvas:Canvas?){
        val paint = Paint()
        paint.setColor(Color.rgb(255,138,216))
        val storkeWidth:Float = (getWidth() / 8).toFloat()
        paint.setStrokeWidth(storkeWidth)
        paint.setAntiAlias(true)
        paint.setStyle(Paint.Style.STROKE)
        paint.strokeCap = Paint.Cap.ROUND
        val rect = RectF(storkeWidth/2, storkeWidth/2, getWidth().toFloat()-storkeWidth/2, getHeight().toFloat()-storkeWidth/2)
        var angle = rate / 100 * 360 //円グラフの終了位置の指定
        if (isNotClockWise) {
            //反時計周りの場合はマイナスにする
            angle *= -1
        }
        canvas!!.drawArc(rect, -90f, angle, false, paint)
    }
}
##解説
円(半円)の作成方法
まずPaintで描画する円(半円)のデザインを設定します
val paint = Paint()
paint.setColor(Color.rgb(255,138,216)) //線の色の設定
val storkeWidth:Float = (getWidth() / 8).toFloat()
paint.setStrokeWidth(storkeWidth) //線の幅の設定->Androidは端末ごとの画面解像度の差が大きいので端末の大きさに応じて可変にした方がよい
paint.setAntiAlias(true) //AntiAliasは当然設定
paint.setStyle(Paint.Style.STROKE) //スタイルをSTROKEに設定
paint.strokeCap = Paint.Cap.ROUND //線の先端を丸くする
今回のテーマである円グラフの始点と終点を丸くする設定はPaintのstrokeCapプロパティにPaint.Cap.ROUNDを指定するだけで実現できちゃいました。
続いてCanvasのdrawArcメソッドで円(半円)を描く様に指定します。
val rect = RectF(storkeWidth/2, storkeWidth/2, getWidth().toFloat()-storkeWidth/2, getHeight().toFloat()-storkeWidth/2)
var angle = rate / 100 * 360 //円グラフの終了位置の指定
if (isNotClockWise) {
    //反時計周りの場合はマイナスにする
    angle *= -1
}
canvas!!.drawArc(rect, -90f, angle, false, paint)
drawArcの第一引数には円を描く大きさをRectで指定します。
Rectで指定した範囲が円の線の中心に来るように円が描かれますので線の太さの半分だけViewの大きさより小さくしています。(こうしないと円の線が半分だけViewの外に出てしまいます。)
val rect = RectF(storkeWidth/2, storkeWidth/2, getWidth().toFloat()-storkeWidth/2, getHeight().toFloat()-storkeWidth/2)
drawArcの第二引数は開始位置を角度で指定します。
0度だと時計の3時の位置を指ししますので、時計の0時の位置を開始位置にしたい場合は-90度を指定します。
drawArcの第三引数は円を描く角度を指定します。
1周が360度となりますので、今回のグラフの割合を360にかけて算出します。
尚、正の値だと時計回り、負の値だと反時計回りになります。
var angle = rate / 100 * 360 //円グラフの終了位置の指定
if (isNotClockWise) {
    //反時計周りの場合はマイナスにする
    angle *= -1
}
drawArcの第四引数は円の中心点との間に線を引くかを指定するものですので今回は常にfalseにします。
drawArcの第五引数には先ほどデザイン設定を行ったPaintを設定します。
#円グラフをアニメーションで動かす為のAnimationクラスの追加
せっかくなのでグラフの線の描画をアニメーションにしてみましょう。
Animationクラスを継承したクラスを一つ追加します。
package com.example.chartsample

import android.view.animation.Animation
import android.view.animation.Transformation

class AnimationForChartView: Animation {
    lateinit var chartView:ChartView

    var rate:Int = 0 // 0 - 100の間で指定

    constructor(chartView: ChartView){
        this.chartView = chartView
    }

    override fun applyTransformation(interpolatedTime: Float, t: Transformation?) {
        super.applyTransformation(interpolatedTime, t)

        val thisRate:Float = rate * interpolatedTime
        chartView.rate = thisRate
        chartView.requestLayout()
    }
}
ではグラフを使用するActivityから先に作成した円グラフを表示するView(今回のサンプルだとChartViewクラス)とAnimationクラス(今回のサンプルだとAnimationForChartViewクラス)を呼び出してみます。
package com.example.chartsample

import android.support.v7.app.AppCompatActivity
import android.os.Bundle
import android.text.InputType
import android.view.Gravity
import android.widget.*

class MainActivity : AppCompatActivity() {
    lateinit var editRate: EditText
    lateinit var textRate: TextView
    lateinit var buttonRate: Button
    lateinit var checkNotClockWise: CheckBox
    lateinit var chartView: ChartView
    lateinit var relativeLayout:RelativeLayout

    override fun onCreate(savedInstanceState: Bundle?) {
        super.onCreate(savedInstanceState)

        val context = applicationContext
        relativeLayout = RelativeLayout(context)
        setContentView(relativeLayout)

        editRate = EditText(context)
        editRate.setText("75") //とりあえずデフォルトは75%とする
        editRate.setInputType(InputType.TYPE_CLASS_NUMBER)

        textRate = TextView(context)
        textRate.gravity = Gravity.CENTER
        textRate.setText("%")

        buttonRate = Button(context)
        buttonRate.setText("グラフ表示")
        buttonRate.setOnClickListener {
            drawChart()
        }

        checkNotClockWise = CheckBox(context)
        checkNotClockWise.setText("反時計回りにする")

        chartView = ChartView(context)
    }

    override fun onWindowFocusChanged(hasFocus: Boolean) {
        super.onWindowFocusChanged(hasFocus)

        if (!hasFocus) {
            return
        }
        changeScreen()
        drawChart()
    }

    private fun changeScreen(){
        val widthValue = relativeLayout.width
        val heightValue = relativeLayout.height

        val buttonHeight = heightValue / 10
        val spaceWidth = (widthValue-buttonHeight*6)/2
        relativeLayout.addView(editRate,getLayoutParams(spaceWidth,50,buttonHeight,buttonHeight))
        relativeLayout.addView(textRate,getLayoutParams(spaceWidth+buttonHeight,50,buttonHeight,buttonHeight))
        relativeLayout.addView(checkNotClockWise,getLayoutParams(spaceWidth+buttonHeight*2,50,buttonHeight*2,buttonHeight))
        relativeLayout.addView(buttonRate,getLayoutParams(spaceWidth+buttonHeight*4,50,buttonHeight*2,buttonHeight))


        var chartWidth: Int = (widthValue * 0.8).toInt()
        if (widthValue > heightValue){
            chartWidth = (heightValue * 0.8).toInt()
        }

        relativeLayout.addView(chartView,getLayoutParams(widthValue/2-chartWidth/2,50+buttonHeight,chartWidth,chartWidth))

    }

    private fun getLayoutParams(x: Int, y: Int, width: Int, height: Int): RelativeLayout.LayoutParams {
        val param1 = RelativeLayout.LayoutParams(width, height)
        param1.leftMargin = x
        param1.topMargin = y
        param1.addRule(RelativeLayout.ALIGN_TOP)
        return param1
    }

    /**
     * グラフをアニメーションで表示
     */
    private fun drawChart(){
        chartView.isNotClockWise = checkNotClockWise.isChecked

        val rateString:String = editRate.getText().toString()
        val rate:Int = Integer.parseInt(rateString)

        val anmationForChartView = AnimationForChartView(chartView)
        anmationForChartView.rate = rate
        anmationForChartView.duration = 2000
        chartView.startAnimation(anmationForChartView)
    }
}
##解説
###アニメーション付きでグラフを描画するように指定している部分
     /**
     * グラフをアニメーションで表示
     */
    private fun drawChart(){
        chartView.isNotClockWise = checkNotClockWise.isChecked

        val rateString:String = editRate.getText().toString()
        val rate:Int = Integer.parseInt(rateString)

        val anmationForChartView = AnimationForChartView(chartView)
        anmationForChartView.rate = rate
        anmationForChartView.duration = 2000
        chartView.startAnimation(anmationForChartView)
    }
AnimationForChartViewクラスのdurationにミリ秒単位でアニメーションの動作時間を指定します。
またAnimationForChartViewクラスでChartViewクラスの円グラフの動きを制御できるようにChartViewクラスそのものと円グラフに設定する値を渡しておきます。
その上でChartViewのstatAnimationメソッドをAnimationForChartViewクラスを引数にして実行します。
###Animationクラスにおけるアニメーションの制御部分
前述のstartAnimationメソッドを実行するとAnimationForChartViewクラスの中でapplyTrasformationイベントが繰り返し発生します。
    override fun applyTransformation(interpolatedTime: Float, t: Transformation?) {
        super.applyTransformation(interpolatedTime, t)

        val thisRate:Float = rate * interpolatedTime
        chartView.rate = thisRate
        chartView.requestLayout()
    }
このイベントはdurationに指定したアニメーションの動作時間の間繰り返し発生し、その間、動作時間の進捗割合を示すinterpolatedTimeが0から1の間で渡されてきます。
その為、円グラフの設定値にinterpolatedTimeを乗算した値をChartViewクラスに都度渡して再描画を要求すれば、円グラフがアニメーションで描かれる様になります。
#GitHub
今回紹介したサンプルコードはGitHubで公開しています。
#参考文献
Canvas - Android Developers
[Android]Canvas Animationで円弧を動かす - nyanのアプリ開発