準備
ハリーになりきって、「ルーモス、光よ」と唱える。
import matplotlib.pyplot as plt
import numpy as np
%matplotlib inline
複数のグラフの表示
今回は複数のグラフを一度に一つの画像に表示する方法について書きます。
複数グラフを書く時には、plt.subplot()というメソッドを使うことで実現できます。
ざっくり表現するならplt.subplot()は__グラフ用紙を準備するメソッド__です。
例えば、Jupyter上で以下を実行すると枠だけが表示された2つのグラフが出力されます。
plt.subplot(2,1,1)
plt.subplot(2,1,2);
何も書かれておらず、ただの枠しかないので実質グラフ用紙が2つ並べられた状態ですね(笑)。
plt.subplotの引数内の数字の意味は
plt.subplot(何行用意するか,何列用意するか,何番目のグラフか)
という意味です。
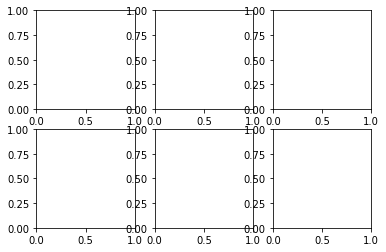
したがってグラフ用紙を2行3列に並べたものを用意したいときは、次のように書くと
plt.subplot(2,3,1) #左上
plt.subplot(2,3,2) #中上
plt.subplot(2,3,3) #右上
plt.subplot(2,3,4) #左下
plt.subplot(2,3,5) #中下
plt.subplot(2,3,6); #右下
2×3のグラフ用紙が用意されます。
また全てのグラフ用紙には左上から右下へ、1,2,3...と順番が決められているのでそれを指定することでどのグラフ用紙に描画するかを決めています。
グラフ用紙にグラフを書いていく
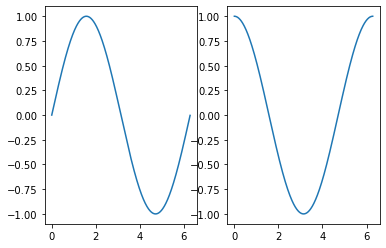
1×2に並べたグラフ用紙にsinx,cosxのグラフを書く
# x軸となる0から2πまでの数字を0.01刻みで生成
x = np.arange(0,2*np.pi,0.01)

# 1個目のグラフ(左)
plt.subplot(1,2,1)
plt.plot(x, np.sin(x))

# 2個目のグラフ(右)
plt.subplot(1,2,2)
plt.plot(x, np.cos(x));
全体の画像のバランスはplt.tight_layout()を追加して簡単に整えることができます。
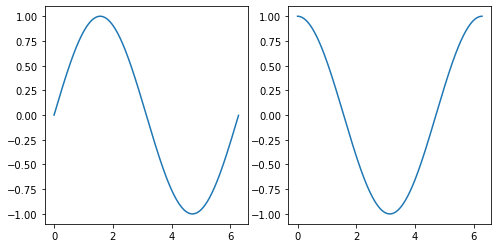
plt.figure(figsize=(?,?))でサイズを変えてもOKです。(下はサイズを変化させて整えています。)
x = np.arange(0,2*np.pi,0.01)

# 画面全体の調節
plt.figure(figsize=(8,4))

# 1個目のグラフ
plt.subplot(1,2,1)
plt.plot(x, np.sin(x))

# 2個目のグラフ
plt.subplot(1,2,2)
plt.plot(x, np.cos(x));
もっと詳細にグラフの間を調節したいときは、plt.subplots_adjust()を使います。
参考サイト:matplotlib subplot。グラフ間の間隔を調整-python
ここまでの知識を使って描画してみる。
2×3に並べたグラフ用紙の一つ一つに、三角関数や媒介変数で表現される曲線を描画していく。
参考サイト:https://mathtrain.jp/sevencurve
theta = np.arange(0,2*np.pi,0.01)

# 全体のサイズ調節
plt.figure(figsize=(12,9))

# 右上
plt.subplot(2, 3, 1)
plt.plot(theta, np.sin(theta))
plt.title("sin")
plt.grid()

# 中上
plt.subplot(2, 3, 2)
plt.plot(theta, np.cos(theta))
plt.title("cos")
plt.grid()

# 右上
plt.subplot(2, 3, 3)
plt.plot(theta-np.sin(theta), 1-np.cos(theta))
plt.title("cycloid")
plt.grid()

# 左下
plt.subplot(2, 3, 4)
plt.plot(np.power(np.cos(theta),3), np.power(np.sin(theta),3))
plt.title("asteroid")
plt.grid()

# 中下
plt.subplot(2, 3, 5)
plt.plot((1+np.cos(theta))*np.cos(theta), (1+np.cos(theta))*np.sin(theta))
plt.title("cardioid")
plt.grid()

# 右下
plt.subplot(2, 3, 6)
theta2 = np.arange(0,10*np.pi,0.01) # インボリュート曲線用
plt.plot(np.cos(theta2)+theta2*np.sin(theta2), np.sin(theta2)-theta2*np.cos(theta2))
plt.title("involute of circle")
plt.grid();
まとめ
plt.subplotで今回は複数の関数を書くことができるようになりました。
もうこの辺りまで来るとオブジェクト指向の書き方で細かい調整などがしたくなると思います。
オブジェクト指向型での書き方もmatplotlibの公式documentなどで勉強していってください。


