本記事はPython初心者の筆者が備忘録として作成したものである。プログラムの流れとしては、(座標をインストールする関数)→(近傍点を探し出す関数)の2段階としている。
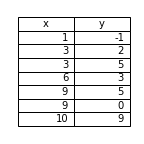
まず2次元座標を考えよう
import pandas as pd
import csv
from matplotlib import pyplot as plt
import math

dict1 = dict(x=[1, 3,3, 6, 9,9,  10],y=[-1, 2,5, 3, 5,0, 9])
df = pd.DataFrame(data=dict1)

fig, ax = plt.subplots(figsize=(2,2))
ax.axis('off')
ax.axis('tight')
ax.table(cellText=df.values,
         colLabels=df.columns,
         loc='center',
         bbox=[0, 0, 1, 1])
plt.savefig('table.png')
このように座標系が出力できましたね。

ではこの座標系をインストールしていきます。
二次元座標系において座標を与える
def install(): #楕円を構成する座標を読みとる
    points = []
    for i in range(len(df)): #行数分のループを繰り返す
        points.append({"x" : df.iloc[i, 0], "y" : df.iloc[i, 1]})
    return points
これでこの中から次の関数で設定した一番近い値を探索します。
def nearPoint(x, y, points):
    if not points:
        return {}

    closest_point = min(points, key=lambda point: math.sqrt((point["x"] - x) ** 2 + (point["y"] - y) ** 2))
    return {"x": closest_point["x"], "y": closest_point["y"]}
それでは結果を出力してみましょう。
print(nearPoint(3, 3, install()))
print(nearPoint(4, 7, install()))
print(nearPoint(1, 1, install()))
print(nearPoint(7, 8, install()))
結果がこちらになります。
{'x': 3, 'y': 2}
{'x': 3, 'y': 5}
{'x': 1, 'y': -1}
{'x': 10, 'y': 9}
全体のプログラムは以下になります。
import pandas as pd
import csv
from matplotlib import pyplot as plt
import math

dict1 = dict(x=[1, 3, 3, 6, 9, 9, 10],y=[-1, 2, 5, 3, 5, 0, 9])
df = pd.DataFrame(data=dict1)

def install():  # 楕円を構成する座標を読みとる
    points = []
    for i in range(len(df)):  # 行数分のループを繰り返す
        points.append({"x" : df.iloc[i,0], "y" : df.iloc[i,1]})
    return points

def nearPoint(x, y, points):
    if not points:
        return {}

    closest_point = min(points, key=lambda point: math.sqrt((point["x"] - x) ** 2 + (point["y"] - y) ** 2))
    return {"x": closest_point["x"], "y": closest_point["y"]}
追記
コメントにあるようにWolfMoon様にご提示していただいたコードですと、私が示したものよりもかなり計算速度が早いことがわかりました。(2023年03月01日検証)