■はじめに
Prometheus Node Exporter とは
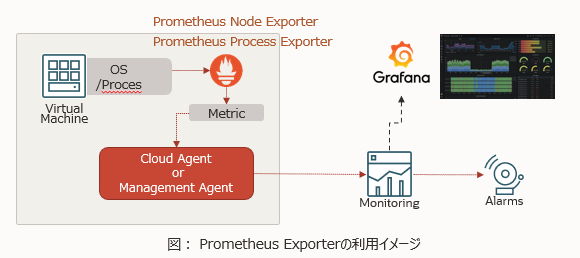
Prometheus Node Exporter(以後、ノードエクスポーター) は簡単にいうとPrometheusのエージェントのようなものです。
エクスポーターをOSにインストールすると、OS内の様々なメトリックを拾い、瞬間風速情報を常に出力してくれます。
OCIの管理エージェント(Management Agent) は、エクスポーターのメトリックを識別し、OCIモニタリングのカスタムメトリックとしてOCIにアップロードする機能を有しています。
この機能を用いることで、デフォルトでコンピュートが持つ監視メトリック(Cloud Agentによるもの)以外に、ハードディスク使用率やプロセス監視などを行うことができます。
管理エージェントとは
OCIのコンピュートに限らず、AWSやオンプレミス環境のOSなどにインストールできるエージェントで、このエージェントを介してOCIの様々な管理ツールを利用できるようになります。
OCIコンピュートではCloud Agentのプラグインとして管理エージェント機能を有しているので、本記事ではそのプラグインを利用しています。(コンピュートにはデフォルトでCloudAgentはインストールされている)
環境
- Shape:VM.Standard.E4.Flex [2 OCPU(12.5%) / Mem:2GB]
- Image: Oracle-Linux-8.6-2022.12.15-0
- ディスクおよびファイルシステム監視用にノードエクスポーター を利用
- Nginxプロセス監視用にプロセスエクスポーター を利用
本書の前提条件
-
VCN、サブネットは構成済み
- コンピュートからInternet Gateway経由でOCIモニタリングにメトリック投入できるネットワーク構成
-
コンピュートはデプロイ済み
-
管理エージェントプラグイン有効
- Cloud Agentプラグインであっても管理エージェントへの認可が必要
- https://docs.oracle.com/ja-jp/iaas/management-agents/doc/set-management-agents-collect-prometheus-metrics.html
-
Nginxインストールして有効化
■環境構築
① エクスポーターのダウンロード
-
手順のポイント:
- 上述手順でバージョンがアスタリスク「*」になっているので、バージョンは指定する事
- ダウンロードする実態およびURLはこちらから探す
- 例えば、2023年2月時点では以下のURLは以下になる
-
ダウンロード例
- これをノードエクスポーターとプロセスエクスポーター2つダウンロードする
[opc@ol8-prome ~]# wget -P /tmp https://github.com/prometheus/node_exporter/releases/download/v1.5.0/node_exporter-1.5.0.linux-amd64.tar.gz
--2023-02-28 05:34:31--  https://github.com/prometheus/node_exporter/releases/download/v1.5.0/node_exporter-1.5.0.linux-amd64.tar.gz
Resolving github.com (github.com)... 140.82.112.4
Connecting to github.com (github.com)|140.82.112.4|:443... connected.
HTTP request sent, awaiting response... 302 Found
Location: https://objects.githubusercontent.com/github-production-release-asset-2e65be/9524057/fc1630e0-8913-427f-94ba-4131d3ed96c7?X-Amz-Algorithm=AWS4-HMAC-SHA256&X-Amz-Credential=AKIAIWNJYAX4CSVEH53A%2F20230228%2Fus-east-1%2Fs3%2Faws4_request&X-Amz-Date=20230228T053431Z&X-Amz-Expires=300&X-Amz-Signature=46b1c067537bee5521d98ae495e58c5423c480581c49df27d3e469a3b254ef4b&X-Amz-SignedHeaders=host&actor_id=0&key_id=0&repo_id=9524057&response-content-disposition=attachment%3B%20filename%3Dnode_exporter-1.5.0.linux-amd64.tar.gz&response-content-type=application%2Foctet-stream [following]
--2023-02-28 05:34:31--  https://objects.githubusercontent.com/github-production-release-asset-2e65be/9524057/fc1630e0-8913-427f-94ba-4131d3ed96c7?X-Amz-Algorithm=AWS4-HMAC-SHA256&X-Amz-Credential=AKIAIWNJYAX4CSVEH53A%2F20230228%2Fus-east-1%2Fs3%2Faws4_request&X-Amz-Date=20230228T053431Z&X-Amz-Expires=300&X-Amz-Signature=46b1c067537bee5521d98ae495e58c5423c480581c49df27d3e469a3b254ef4b&X-Amz-SignedHeaders=host&actor_id=0&key_id=0&repo_id=9524057&response-content-disposition=attachment%3B%20filename%3Dnode_exporter-1.5.0.linux-amd64.tar.gz&response-content-type=application%2Foctet-stream
Resolving objects.githubusercontent.com (objects.githubusercontent.com)... 185.199.110.133, 185.199.111.133, 185.199.108.133, ...
Connecting to objects.githubusercontent.com (objects.githubusercontent.com)|185.199.110.133|:443... connected.
HTTP request sent, awaiting response... 200 OK
Length: 10181045 (9.7M) [application/octet-stream]
Saving to: ‘/tmp/node_exporter-1.5.0.linux-amd64.tar.gz’

100%[=========================================================================================================>] 10,181,045  10.1MB/s   in 1.0s

2023-02-28 05:34:33 (10.1 MB/s) - ‘/tmp/node_exporter-1.5.0.linux-amd64.tar.gz’ saved [10181045/10181045]


# 同様に
[opc@ol8-prome ~]# wget -P /tmp https://github.com/ncabatoff/process-exporter/releases/download/v0.7.10/process-exporter-0.7.10.linux-amd64.tar.gz

# 2つのエクスポーターをダウンロードできた事を確認
[opc@ol8-prome ~]$ ll /tmp
total 13628
-rw-rw-r--. 1 opc opc 10181045 Nov 29 19:05 node_exporter-1.5.0.linux-amd64.tar.gz
-rw-rw-r--. 1 opc opc  3770626 Dec  8  2021 process-exporter-0.7.10.linux-amd64.tar.gz
[opc@ol8-prome ~]# mkdir -p /etc/prometheus/noodeExporter
[opc@ol8-prome ~]# tar xvfz /tmp/node_exporter-1.5.0.linux-amd64.tar.gz -C /etc/prometheus/nodeExporter --strip-components 1
node_exporter-1.5.0.linux-amd64/LICENSE
node_exporter-1.5.0.linux-amd64/NOTICE
node_exporter-1.5.0.linux-amd64/node_exporter

[opc@ol8-prome ~]# mkdir -p /etc/prometheus/processExporter
[opc@ol8-prome ~]# tar xvzf /tmp/process-exporter-0.7.10.linux-amd64.tar.gz -C /etc/prometheus/processExporter --strip-components 1
process-exporter-0.7.10.linux-amd64/LICENSE
process-exporter-0.7.10.linux-amd64/README.md
process-exporter-0.7.10.linux-amd64/process-exporter
② エクスポーター動作テスト
- エクスポーターをテスト実行(ノードエクスポーター)
- 実行するとポート9100でhttpを受け付ける
[opc@ol8-prome ~]# /etc/prometheus/nodeExporter/node_exporter
ts=2023-02-11T03:09:04.660Z caller=node_exporter.go:180 level=info msg="Starting node_exporter" version="(version=1.5.0, branch=HEAD, revision=1b48970ffcf5630534fb00bb0687d73c66d1c959)"
ts=2023-02-11T03:09:04.661Z caller=node_exporter.go:181 level=info msg="Build context" build_context="(go=go1.19.3, user=root@6e7732a7b81b, date=20221129-18:59:09)"
・
・
ts=2023-02-11T03:09:04.662Z caller=node_exporter.go:110 level=info msg="Enabled collectors"
ts=2023-02-11T03:09:04.662Z caller=node_exporter.go:117 level=info collector=arp
ts=2023-02-11T03:09:04.662Z caller=node_exporter.go:117 level=info collector=bcache
ts=2023-02-11T03:09:04.662Z caller=node_exporter.go:117 level=info collector=bonding
ts=2023-02-11T03:09:04.662Z caller=node_exporter.go:117 level=info collector=btrfs
ts=2023-02-11T03:09:04.662Z caller=node_exporter.go:117 level=info collector=conntrack
ts=2023-02-11T03:09:04.662Z caller=node_exporter.go:117 level=info collector=cpu
ts=2023-02-11T03:09:04.662Z caller=node_exporter.go:117 level=info collector=cpufreq
ts=2023-02-11T03:09:04.662Z caller=node_exporter.go:117 level=info collector=diskstats
ts=2023-02-11T03:09:04.662Z caller=node_exporter.go:117 level=info collector=dmi
ts=2023-02-11T03:09:04.662Z caller=node_exporter.go:117 level=info collector=edac
ts=2023-02-11T03:09:04.662Z caller=node_exporter.go:117 level=info collector=entropy
ts=2023-02-11T03:09:04.662Z caller=node_exporter.go:117 level=info collector=fibrechannel
ts=2023-02-11T03:09:04.662Z caller=node_exporter.go:117 level=info collector=filefd
ts=2023-02-11T03:09:04.662Z caller=node_exporter.go:117 level=info collector=filesystem
ts=2023-02-11T03:09:04.662Z caller=node_exporter.go:117 level=info collector=hwmon
ts=2023-02-11T03:09:04.662Z caller=node_exporter.go:117 level=info collector=infiniband
ts=2023-02-11T03:09:04.662Z caller=node_exporter.go:117 level=info collector=ipvs
ts=2023-02-11T03:09:04.662Z caller=node_exporter.go:117 level=info collector=loadavg
ts=2023-02-11T03:09:04.662Z caller=node_exporter.go:117 level=info collector=mdadm
・
・
・
ts=2023-02-11T03:09:04.662Z caller=node_exporter.go:117 level=info collector=vmstat
ts=2023-02-11T03:09:04.662Z caller=node_exporter.go:117 level=info collector=xfs
ts=2023-02-11T03:09:04.662Z caller=node_exporter.go:117 level=info collector=zfs
ts=2023-02-11T03:09:04.663Z caller=tls_config.go:232 level=info msg="Listening on" address=[::]:9100
ts=2023-02-11T03:09:04.663Z caller=tls_config.go:235 level=info msg="TLS is disabled." http2=false address=[::]:9100
- プロセスエクスポーターをテスト実行
- 実行するとポート9256でhttpを受け付ける
[opc@ol8-prome ~]$ /etc/prometheus/procExporter/process-exporter -procnames nginx
2023/02/11 07:05:31 Reading metrics from /proc for procnames: [nginx]
level=info ts=2023-02-11T07:05:31.194Z caller=tls_config.go:195 msg="TLS is disabled." http2=false
- もう1つのターミナルでcurlを叩いてメトリックを取得できていることを確認する
[opc@ol8-prome ~]$ curl http://localhost:9100/metrics
# HELP go_gc_duration_seconds A summary of the pause duration of garbage collection cycles.
# TYPE go_gc_duration_seconds summary
go_gc_duration_seconds{quantile="0"} 0
go_gc_duration_seconds{quantile="0.25"} 0
go_gc_duration_seconds{quantile="0.5"} 0
go_gc_duration_seconds{quantile="0.75"} 0
・
・
# HELP node_disk_discarded_sectors_total The total number of sectors discarded successfully.
# TYPE node_disk_discarded_sectors_total counter
node_disk_discarded_sectors_total{device="dm-0"} 0
node_disk_discarded_sectors_total{device="dm-1"} 0
node_disk_discarded_sectors_total{device="sda"} 0
# HELP node_disk_discards_completed_total The total number of discards completed successfully.
# TYPE node_disk_discards_completed_total counter
node_disk_discards_completed_total{device="dm-0"} 0
node_disk_discards_completed_total{device="dm-1"} 0
node_disk_discards_completed_total{device="sda"} 0
# HELP node_disk_discards_merged_total The total number of discards merged.
# TYPE node_disk_discards_merged_total counter
node_disk_discards_merged_total{device="dm-0"} 0
node_disk_discards_merged_total{device="dm-1"} 0
node_disk_discards_merged_total{device="sda"} 0
・
・
# HELP process_open_fds Number of open file descriptors.
# TYPE process_open_fds gauge
process_open_fds 9
# HELP process_resident_memory_bytes Resident memory size in bytes.
# TYPE process_resident_memory_bytes gauge
process_resident_memory_bytes 1.0653696e+07
# HELP process_start_time_seconds Start time of the process since unix epoch in seconds.
# TYPE process_start_time_seconds gauge
process_start_time_seconds 1.67609641001e+09
・
・
[opc@ol8-prome ~]$ curl http://localhost:9256/metrics
# HELP go_gc_duration_seconds A summary of the pause duration of garbage collection cycles.
# TYPE go_gc_duration_seconds summary
go_gc_duration_seconds{quantile="0"} 3.0598e-05
go_gc_duration_seconds{quantile="0.25"} 3.2981e-05
go_gc_duration_seconds{quantile="0.5"} 3.8733e-05
・
・
# HELP namedprocess_namegroup_context_switches_total Context switches
# TYPE namedprocess_namegroup_context_switches_total counter
namedprocess_namegroup_context_switches_total{ctxswitchtype="nonvoluntary",groupname="nginx"} 0
namedprocess_namegroup_context_switches_total{ctxswitchtype="voluntary",groupname="nginx"} 0
# HELP namedprocess_namegroup_cpu_seconds_total Cpu user usage in seconds
# TYPE namedprocess_namegroup_cpu_seconds_total counter
namedprocess_namegroup_cpu_seconds_total{groupname="nginx",mode="system"} 0
namedprocess_namegroup_cpu_seconds_total{groupname="nginx",mode="user"} 0
# HELP namedprocess_namegroup_major_page_faults_total Major page faults
# TYPE namedprocess_namegroup_major_page_faults_total counter
namedprocess_namegroup_major_page_faults_total{groupname="nginx"} 0
# HELP namedprocess_namegroup_memory_bytes number of bytes of memory in use
# TYPE namedprocess_namegroup_memory_bytes gauge
namedprocess_namegroup_memory_bytes{groupname="nginx",memtype="proportionalResident"} 0
namedprocess_namegroup_memory_bytes{groupname="nginx",memtype="proportionalSwapped"} 0
namedprocess_namegroup_memory_bytes{groupname="nginx",memtype="resident"} 2.6169344e+07
namedprocess_namegroup_memory_bytes{groupname="nginx",memtype="swapped"} 3.571712e+06
namedprocess_namegroup_memory_bytes{groupname="nginx",memtype="virtual"} 7.43964672e+08
・
・
・
参考:ノードエクスポーターデフォルトの全量を確認したい場合は展開してください
[opc@ol8-prome ~]$ curl http://localhost:9100/metrics
# HELP go_gc_duration_seconds A summary of the pause duration of garbage collection cycles.
# TYPE go_gc_duration_seconds summary
go_gc_duration_seconds{quantile="0"} 0
go_gc_duration_seconds{quantile="0.25"} 0
go_gc_duration_seconds{quantile="0.5"} 0
go_gc_duration_seconds{quantile="0.75"} 0
go_gc_duration_seconds{quantile="1"} 0
go_gc_duration_seconds_sum 0
go_gc_duration_seconds_count 0
# HELP go_goroutines Number of goroutines that currently exist.
# TYPE go_goroutines gauge
go_goroutines 7
# HELP go_info Information about the Go environment.
# TYPE go_info gauge
go_info{version="go1.19.3"} 1
# HELP go_memstats_alloc_bytes Number of bytes allocated and still in use.
# TYPE go_memstats_alloc_bytes gauge
go_memstats_alloc_bytes 918656
# HELP go_memstats_alloc_bytes_total Total number of bytes allocated, even if freed.
# TYPE go_memstats_alloc_bytes_total counter
go_memstats_alloc_bytes_total 918656
# HELP go_memstats_buck_hash_sys_bytes Number of bytes used by the profiling bucket hash table.
# TYPE go_memstats_buck_hash_sys_bytes gauge
go_memstats_buck_hash_sys_bytes 1.445739e+06
# HELP go_memstats_frees_total Total number of frees.
# TYPE go_memstats_frees_total counter
go_memstats_frees_total 645
# HELP go_memstats_gc_sys_bytes Number of bytes used for garbage collection system metadata.
# TYPE go_memstats_gc_sys_bytes gauge
go_memstats_gc_sys_bytes 8.067928e+06
# HELP go_memstats_heap_alloc_bytes Number of heap bytes allocated and still in use.
# TYPE go_memstats_heap_alloc_bytes gauge
go_memstats_heap_alloc_bytes 918656
# HELP go_memstats_heap_idle_bytes Number of heap bytes waiting to be used.
# TYPE go_memstats_heap_idle_bytes gauge
go_memstats_heap_idle_bytes 1.425408e+06
# HELP go_memstats_heap_inuse_bytes Number of heap bytes that are in use.
# TYPE go_memstats_heap_inuse_bytes gauge
go_memstats_heap_inuse_bytes 2.441216e+06
# HELP go_memstats_heap_objects Number of allocated objects.
# TYPE go_memstats_heap_objects gauge
go_memstats_heap_objects 7793
# HELP go_memstats_heap_released_bytes Number of heap bytes released to OS.
# TYPE go_memstats_heap_released_bytes gauge
go_memstats_heap_released_bytes 1.425408e+06
# HELP go_memstats_heap_sys_bytes Number of heap bytes obtained from system.
# TYPE go_memstats_heap_sys_bytes gauge
go_memstats_heap_sys_bytes 3.866624e+06
# HELP go_memstats_last_gc_time_seconds Number of seconds since 1970 of last garbage collection.
# TYPE go_memstats_last_gc_time_seconds gauge
go_memstats_last_gc_time_seconds 0
# HELP go_memstats_lookups_total Total number of pointer lookups.
# TYPE go_memstats_lookups_total counter
go_memstats_lookups_total 0
# HELP go_memstats_mallocs_total Total number of mallocs.
# TYPE go_memstats_mallocs_total counter
go_memstats_mallocs_total 8438
# HELP go_memstats_mcache_inuse_bytes Number of bytes in use by mcache structures.
# TYPE go_memstats_mcache_inuse_bytes gauge
go_memstats_mcache_inuse_bytes 1200
# HELP go_memstats_mcache_sys_bytes Number of bytes used for mcache structures obtained from system.
# TYPE go_memstats_mcache_sys_bytes gauge
go_memstats_mcache_sys_bytes 15600
# HELP go_memstats_mspan_inuse_bytes Number of bytes in use by mspan structures.
# TYPE go_memstats_mspan_inuse_bytes gauge
go_memstats_mspan_inuse_bytes 35904
# HELP go_memstats_mspan_sys_bytes Number of bytes used for mspan structures obtained from system.
# TYPE go_memstats_mspan_sys_bytes gauge
go_memstats_mspan_sys_bytes 48960
# HELP go_memstats_next_gc_bytes Number of heap bytes when next garbage collection will take place.
# TYPE go_memstats_next_gc_bytes gauge
go_memstats_next_gc_bytes 4.194304e+06
# HELP go_memstats_other_sys_bytes Number of bytes used for other system allocations.
# TYPE go_memstats_other_sys_bytes gauge
go_memstats_other_sys_bytes 888341
# HELP go_memstats_stack_inuse_bytes Number of bytes in use by the stack allocator.
# TYPE go_memstats_stack_inuse_bytes gauge
go_memstats_stack_inuse_bytes 327680
# HELP go_memstats_stack_sys_bytes Number of bytes obtained from system for stack allocator.
# TYPE go_memstats_stack_sys_bytes gauge
go_memstats_stack_sys_bytes 327680
# HELP go_memstats_sys_bytes Number of bytes obtained from system.
# TYPE go_memstats_sys_bytes gauge
go_memstats_sys_bytes 1.4660872e+07
# HELP go_threads Number of OS threads created.
# TYPE go_threads gauge
go_threads 5
# HELP node_arp_entries ARP entries by device
# TYPE node_arp_entries gauge
node_arp_entries{device="ens3"} 3
# HELP node_boot_time_seconds Node boot time, in unixtime.
# TYPE node_boot_time_seconds gauge
node_boot_time_seconds 1.676083511e+09
# HELP node_context_switches_total Total number of context switches.
# TYPE node_context_switches_total counter
node_context_switches_total 1.154348e+06
# HELP node_cooling_device_cur_state Current throttle state of the cooling device
# TYPE node_cooling_device_cur_state gauge
node_cooling_device_cur_state{name="0",type="Processor"} 0
node_cooling_device_cur_state{name="1",type="Processor"} 0
node_cooling_device_cur_state{name="2",type="Processor"} 0
node_cooling_device_cur_state{name="3",type="Processor"} 0
# HELP node_cooling_device_max_state Maximum throttle state of the cooling device
# TYPE node_cooling_device_max_state gauge
node_cooling_device_max_state{name="0",type="Processor"} 0
node_cooling_device_max_state{name="1",type="Processor"} 0
node_cooling_device_max_state{name="2",type="Processor"} 0
node_cooling_device_max_state{name="3",type="Processor"} 0
# HELP node_cpu_guest_seconds_total Seconds the CPUs spent in guests (VMs) for each mode.
# TYPE node_cpu_guest_seconds_total counter
node_cpu_guest_seconds_total{cpu="0",mode="nice"} 0
node_cpu_guest_seconds_total{cpu="0",mode="user"} 0
node_cpu_guest_seconds_total{cpu="1",mode="nice"} 0
node_cpu_guest_seconds_total{cpu="1",mode="user"} 0
node_cpu_guest_seconds_total{cpu="2",mode="nice"} 0
node_cpu_guest_seconds_total{cpu="2",mode="user"} 0
node_cpu_guest_seconds_total{cpu="3",mode="nice"} 0
node_cpu_guest_seconds_total{cpu="3",mode="user"} 0
# HELP node_cpu_seconds_total Seconds the CPUs spent in each mode.
# TYPE node_cpu_seconds_total counter
node_cpu_seconds_total{cpu="0",mode="idle"} 1499.28
node_cpu_seconds_total{cpu="0",mode="iowait"} 10.1
node_cpu_seconds_total{cpu="0",mode="irq"} 0
node_cpu_seconds_total{cpu="0",mode="nice"} 0
node_cpu_seconds_total{cpu="0",mode="softirq"} 0.55
node_cpu_seconds_total{cpu="0",mode="steal"} 0.08
node_cpu_seconds_total{cpu="0",mode="system"} 10.57
node_cpu_seconds_total{cpu="0",mode="user"} 61.46
node_cpu_seconds_total{cpu="1",mode="idle"} 1391.7
node_cpu_seconds_total{cpu="1",mode="iowait"} 9.43
node_cpu_seconds_total{cpu="1",mode="irq"} 0
node_cpu_seconds_total{cpu="1",mode="nice"} 0
node_cpu_seconds_total{cpu="1",mode="softirq"} 0.37
node_cpu_seconds_total{cpu="1",mode="steal"} 0.07
node_cpu_seconds_total{cpu="1",mode="system"} 12.27
node_cpu_seconds_total{cpu="1",mode="user"} 169.03
node_cpu_seconds_total{cpu="2",mode="idle"} 1480.62
node_cpu_seconds_total{cpu="2",mode="iowait"} 12.04
node_cpu_seconds_total{cpu="2",mode="irq"} 0
node_cpu_seconds_total{cpu="2",mode="nice"} 0
node_cpu_seconds_total{cpu="2",mode="softirq"} 0.16
node_cpu_seconds_total{cpu="2",mode="steal"} 0.05
node_cpu_seconds_total{cpu="2",mode="system"} 14.14
node_cpu_seconds_total{cpu="2",mode="user"} 75.29
node_cpu_seconds_total{cpu="3",mode="idle"} 1510.8
node_cpu_seconds_total{cpu="3",mode="iowait"} 15.92
node_cpu_seconds_total{cpu="3",mode="irq"} 0
node_cpu_seconds_total{cpu="3",mode="nice"} 0
node_cpu_seconds_total{cpu="3",mode="softirq"} 0.58
node_cpu_seconds_total{cpu="3",mode="steal"} 0.13
node_cpu_seconds_total{cpu="3",mode="system"} 11.03
node_cpu_seconds_total{cpu="3",mode="user"} 42.71
# HELP node_disk_device_mapper_info Info about disk device mapper.
# TYPE node_disk_device_mapper_info gauge
node_disk_device_mapper_info{device="dm-0",lv_layer="",lv_name="root",name="ocivolume-root",uuid="LVM-GOw9ydB8MO1MWds5aGSSU8H04MRuSKoCFVhnveRYmaG7SRZO5iY3K9j3XliHzEIi",vg_name="ocivolume"} 1
node_disk_device_mapper_info{device="dm-1",lv_layer="",lv_name="oled",name="ocivolume-oled",uuid="LVM-GOw9ydB8MO1MWds5aGSSU8H04MRuSKoC1THIXn9mnnS35MIGHSRd3L9CN3o63A7P",vg_name="ocivolume"} 1
# HELP node_disk_discard_time_seconds_total This is the total number of seconds spent by all discards.
# TYPE node_disk_discard_time_seconds_total counter
node_disk_discard_time_seconds_total{device="dm-0"} 0
node_disk_discard_time_seconds_total{device="dm-1"} 0
node_disk_discard_time_seconds_total{device="sda"} 0
# HELP node_disk_discarded_sectors_total The total number of sectors discarded successfully.
# TYPE node_disk_discarded_sectors_total counter
node_disk_discarded_sectors_total{device="dm-0"} 0
node_disk_discarded_sectors_total{device="dm-1"} 0
node_disk_discarded_sectors_total{device="sda"} 0
# HELP node_disk_discards_completed_total The total number of discards completed successfully.
# TYPE node_disk_discards_completed_total counter
node_disk_discards_completed_total{device="dm-0"} 0
node_disk_discards_completed_total{device="dm-1"} 0
node_disk_discards_completed_total{device="sda"} 0
# HELP node_disk_discards_merged_total The total number of discards merged.
# TYPE node_disk_discards_merged_total counter
node_disk_discards_merged_total{device="dm-0"} 0
node_disk_discards_merged_total{device="dm-1"} 0
node_disk_discards_merged_total{device="sda"} 0
# HELP node_disk_filesystem_info Info about disk filesystem.
# TYPE node_disk_filesystem_info gauge
node_disk_filesystem_info{device="dm-0",type="xfs",usage="filesystem",uuid="a2c46b56-da9f-4829-be87-1d87b18c8aeb",version=""} 1
node_disk_filesystem_info{device="dm-1",type="xfs",usage="filesystem",uuid="f9d1a191-470c-4bb2-ad65-58f895357a5d",version=""} 1
# HELP node_disk_info Info of /sys/block/<block_device>.
# TYPE node_disk_info gauge
node_disk_info{device="dm-0",major="252",minor="0",model="",path="",revision="",serial="",wwn=""} 1
node_disk_info{device="dm-1",major="252",minor="1",model="",path="",revision="",serial="",wwn=""} 1
node_disk_info{device="sda",major="8",minor="0",model="BlockVolume",path="pci-0000:00:04.0-scsi-0:0:0:1",revision="1.0",serial="60d1460ccb96414bbf8f4a35d6de420b",wwn="0x60d1460ccb96414b"} 1
# HELP node_disk_io_now The number of I/Os currently in progress.
# TYPE node_disk_io_now gauge
node_disk_io_now{device="dm-0"} 0
node_disk_io_now{device="dm-1"} 0
node_disk_io_now{device="sda"} 0
# HELP node_disk_io_time_seconds_total Total seconds spent doing I/Os.
# TYPE node_disk_io_time_seconds_total counter
node_disk_io_time_seconds_total{device="dm-0"} 94.364
node_disk_io_time_seconds_total{device="dm-1"} 0.81
node_disk_io_time_seconds_total{device="sda"} 96.97500000000001
# HELP node_disk_io_time_weighted_seconds_total The weighted # of seconds spent doing I/Os.
# TYPE node_disk_io_time_weighted_seconds_total counter
node_disk_io_time_weighted_seconds_total{device="dm-0"} 31455.522
node_disk_io_time_weighted_seconds_total{device="dm-1"} 1.56
node_disk_io_time_weighted_seconds_total{device="sda"} 843.393
# HELP node_disk_read_bytes_total The total number of bytes read successfully.
# TYPE node_disk_read_bytes_total counter
node_disk_read_bytes_total{device="dm-0"} 2.705654272e+09
node_disk_read_bytes_total{device="dm-1"} 7.131648e+06
node_disk_read_bytes_total{device="sda"} 2.747715584e+09
# HELP node_disk_read_time_seconds_total The total number of seconds spent by all reads.
# TYPE node_disk_read_time_seconds_total counter
node_disk_read_time_seconds_total{device="dm-0"} 143.707
node_disk_read_time_seconds_total{device="dm-1"} 0.381
node_disk_read_time_seconds_total{device="sda"} 125.063
# HELP node_disk_reads_completed_total The total number of reads completed successfully.
# TYPE node_disk_reads_completed_total counter
node_disk_reads_completed_total{device="dm-0"} 137032
node_disk_reads_completed_total{device="dm-1"} 455
node_disk_reads_completed_total{device="sda"} 118811
# HELP node_disk_reads_merged_total The total number of reads merged.
# TYPE node_disk_reads_merged_total counter
node_disk_reads_merged_total{device="dm-0"} 0
node_disk_reads_merged_total{device="dm-1"} 0
node_disk_reads_merged_total{device="sda"} 18984
# HELP node_disk_write_time_seconds_total This is the total number of seconds spent by all writes.
# TYPE node_disk_write_time_seconds_total counter
node_disk_write_time_seconds_total{device="dm-0"} 31311.815000000002
node_disk_write_time_seconds_total{device="dm-1"} 1.179
node_disk_write_time_seconds_total{device="sda"} 778.569
# HELP node_disk_writes_completed_total The total number of writes completed successfully.
# TYPE node_disk_writes_completed_total counter
node_disk_writes_completed_total{device="dm-0"} 157458
node_disk_writes_completed_total{device="dm-1"} 1019
node_disk_writes_completed_total{device="sda"} 17637
# HELP node_disk_writes_merged_total The number of writes merged.
# TYPE node_disk_writes_merged_total counter
node_disk_writes_merged_total{device="dm-0"} 0
node_disk_writes_merged_total{device="dm-1"} 0
node_disk_writes_merged_total{device="sda"} 142571
# HELP node_disk_written_bytes_total The total number of bytes written successfully.
# TYPE node_disk_written_bytes_total counter
node_disk_written_bytes_total{device="dm-0"} 2.631856128e+09
node_disk_written_bytes_total{device="dm-1"} 1.0416128e+07
node_disk_written_bytes_total{device="sda"} 2.676324864e+09
# HELP node_dmi_info A metric with a constant '1' value labeled by bios_date, bios_release, bios_vendor, bios_version, board_asset_tag, board_name, board_serial, board_vendor, board_version, chassis_asset_tag, chassis_serial, chassis_vendor, chassis_version, product_family, product_name, product_serial, product_sku, product_uuid, product_version, system_vendor if provided by DMI.
# TYPE node_dmi_info gauge
node_dmi_info{bios_date="06/16/2021",bios_vendor="EFI Development Kit II / OVMF",bios_version="1.5.1",chassis_asset_tag="OracleCloud.com",chassis_vendor="QEMU",chassis_version="pc-i440fx-4.2",product_family="",product_name="Standard PC (i440FX + PIIX, 1996)",product_sku="",product_version="pc-i440fx-4.2",system_vendor="QEMU"} 1
# HELP node_entropy_available_bits Bits of available entropy.
# TYPE node_entropy_available_bits gauge
node_entropy_available_bits 256
# HELP node_entropy_pool_size_bits Bits of entropy pool.
# TYPE node_entropy_pool_size_bits gauge
node_entropy_pool_size_bits 256
# HELP node_exporter_build_info A metric with a constant '1' value labeled by version, revision, branch, and goversion from which node_exporter was built.
# TYPE node_exporter_build_info gauge
node_exporter_build_info{branch="HEAD",goversion="go1.19.3",revision="1b48970ffcf5630534fb00bb0687d73c66d1c959",version="1.5.0"} 1
# HELP node_filefd_allocated File descriptor statistics: allocated.
# TYPE node_filefd_allocated gauge
node_filefd_allocated 2560
# HELP node_filefd_maximum File descriptor statistics: maximum.
# TYPE node_filefd_maximum gauge
node_filefd_maximum 161006
# HELP node_filesystem_avail_bytes Filesystem space available to non-root users in bytes.
# TYPE node_filesystem_avail_bytes gauge
node_filesystem_avail_bytes{device="/dev/mapper/ocivolume-oled",fstype="xfs",mountpoint="/var/oled"} 1.0615906304e+10
node_filesystem_avail_bytes{device="/dev/mapper/ocivolume-root",fstype="xfs",mountpoint="/"} 3.0296010752e+10
node_filesystem_avail_bytes{device="/dev/sda1",fstype="vfat",mountpoint="/boot/efi"} 9.9393536e+07
node_filesystem_avail_bytes{device="/dev/sda2",fstype="xfs",mountpoint="/boot"} 7.23591168e+08
node_filesystem_avail_bytes{device="tmpfs",fstype="tmpfs",mountpoint="/run"} 8.752128e+08
node_filesystem_avail_bytes{device="tmpfs",fstype="tmpfs",mountpoint="/run/user/0"} 1.76852992e+08
node_filesystem_avail_bytes{device="tmpfs",fstype="tmpfs",mountpoint="/run/user/1000"} 1.76852992e+08
node_filesystem_avail_bytes{device="tmpfs",fstype="tmpfs",mountpoint="/run/user/987"} 1.76852992e+08
# HELP node_filesystem_device_error Whether an error occurred while getting statistics for the given device.
# TYPE node_filesystem_device_error gauge
node_filesystem_device_error{device="/dev/mapper/ocivolume-oled",fstype="xfs",mountpoint="/var/oled"} 0
node_filesystem_device_error{device="/dev/mapper/ocivolume-root",fstype="xfs",mountpoint="/"} 0
node_filesystem_device_error{device="/dev/sda1",fstype="vfat",mountpoint="/boot/efi"} 0
node_filesystem_device_error{device="/dev/sda2",fstype="xfs",mountpoint="/boot"} 0
node_filesystem_device_error{device="tmpfs",fstype="tmpfs",mountpoint="/run"} 0
node_filesystem_device_error{device="tmpfs",fstype="tmpfs",mountpoint="/run/user/0"} 0
node_filesystem_device_error{device="tmpfs",fstype="tmpfs",mountpoint="/run/user/1000"} 0
node_filesystem_device_error{device="tmpfs",fstype="tmpfs",mountpoint="/run/user/987"} 0
# HELP node_filesystem_files Filesystem total file nodes.
# TYPE node_filesystem_files gauge
node_filesystem_files{device="/dev/mapper/ocivolume-oled",fstype="xfs",mountpoint="/var/oled"} 5.24288e+06
node_filesystem_files{device="/dev/mapper/ocivolume-root",fstype="xfs",mountpoint="/"} 1.8597888e+07
node_filesystem_files{device="/dev/sda1",fstype="vfat",mountpoint="/boot/efi"} 0
node_filesystem_files{device="/dev/sda2",fstype="xfs",mountpoint="/boot"} 524288
node_filesystem_files{device="tmpfs",fstype="tmpfs",mountpoint="/run"} 215885
node_filesystem_files{device="tmpfs",fstype="tmpfs",mountpoint="/run/user/0"} 215885
node_filesystem_files{device="tmpfs",fstype="tmpfs",mountpoint="/run/user/1000"} 215885
node_filesystem_files{device="tmpfs",fstype="tmpfs",mountpoint="/run/user/987"} 215885
# HELP node_filesystem_files_free Filesystem total free file nodes.
# TYPE node_filesystem_files_free gauge
node_filesystem_files_free{device="/dev/mapper/ocivolume-oled",fstype="xfs",mountpoint="/var/oled"} 5.242822e+06
node_filesystem_files_free{device="/dev/mapper/ocivolume-root",fstype="xfs",mountpoint="/"} 1.8434501e+07
node_filesystem_files_free{device="/dev/sda1",fstype="vfat",mountpoint="/boot/efi"} 0
node_filesystem_files_free{device="/dev/sda2",fstype="xfs",mountpoint="/boot"} 524262
node_filesystem_files_free{device="tmpfs",fstype="tmpfs",mountpoint="/run"} 215229
node_filesystem_files_free{device="tmpfs",fstype="tmpfs",mountpoint="/run/user/0"} 215880
node_filesystem_files_free{device="tmpfs",fstype="tmpfs",mountpoint="/run/user/1000"} 215880
node_filesystem_files_free{device="tmpfs",fstype="tmpfs",mountpoint="/run/user/987"} 215880
# HELP node_filesystem_free_bytes Filesystem free space in bytes.
# TYPE node_filesystem_free_bytes gauge
node_filesystem_free_bytes{device="/dev/mapper/ocivolume-oled",fstype="xfs",mountpoint="/var/oled"} 1.0615906304e+10
node_filesystem_free_bytes{device="/dev/mapper/ocivolume-root",fstype="xfs",mountpoint="/"} 3.0296010752e+10
node_filesystem_free_bytes{device="/dev/sda1",fstype="vfat",mountpoint="/boot/efi"} 9.9393536e+07
node_filesystem_free_bytes{device="/dev/sda2",fstype="xfs",mountpoint="/boot"} 7.23591168e+08
node_filesystem_free_bytes{device="tmpfs",fstype="tmpfs",mountpoint="/run"} 8.752128e+08
node_filesystem_free_bytes{device="tmpfs",fstype="tmpfs",mountpoint="/run/user/0"} 1.76852992e+08
node_filesystem_free_bytes{device="tmpfs",fstype="tmpfs",mountpoint="/run/user/1000"} 1.76852992e+08
node_filesystem_free_bytes{device="tmpfs",fstype="tmpfs",mountpoint="/run/user/987"} 1.76852992e+08
# HELP node_filesystem_readonly Filesystem read-only status.
# TYPE node_filesystem_readonly gauge
node_filesystem_readonly{device="/dev/mapper/ocivolume-oled",fstype="xfs",mountpoint="/var/oled"} 0
node_filesystem_readonly{device="/dev/mapper/ocivolume-root",fstype="xfs",mountpoint="/"} 0
node_filesystem_readonly{device="/dev/sda1",fstype="vfat",mountpoint="/boot/efi"} 0
node_filesystem_readonly{device="/dev/sda2",fstype="xfs",mountpoint="/boot"} 0
node_filesystem_readonly{device="tmpfs",fstype="tmpfs",mountpoint="/run"} 0
node_filesystem_readonly{device="tmpfs",fstype="tmpfs",mountpoint="/run/user/0"} 0
node_filesystem_readonly{device="tmpfs",fstype="tmpfs",mountpoint="/run/user/1000"} 0
node_filesystem_readonly{device="tmpfs",fstype="tmpfs",mountpoint="/run/user/987"} 0
# HELP node_filesystem_size_bytes Filesystem size in bytes.
# TYPE node_filesystem_size_bytes gauge
node_filesystem_size_bytes{device="/dev/mapper/ocivolume-oled",fstype="xfs",mountpoint="/var/oled"} 1.072693248e+10
node_filesystem_size_bytes{device="/dev/mapper/ocivolume-root",fstype="xfs",mountpoint="/"} 3.8069878784e+10
node_filesystem_size_bytes{device="/dev/sda1",fstype="vfat",mountpoint="/boot/efi"} 1.04634368e+08
node_filesystem_size_bytes{device="/dev/sda2",fstype="xfs",mountpoint="/boot"} 1.063256064e+09
node_filesystem_size_bytes{device="tmpfs",fstype="tmpfs",mountpoint="/run"} 8.8426496e+08
node_filesystem_size_bytes{device="tmpfs",fstype="tmpfs",mountpoint="/run/user/0"} 1.76852992e+08
node_filesystem_size_bytes{device="tmpfs",fstype="tmpfs",mountpoint="/run/user/1000"} 1.76852992e+08
node_filesystem_size_bytes{device="tmpfs",fstype="tmpfs",mountpoint="/run/user/987"} 1.76852992e+08
# HELP node_forks_total Total number of forks.
# TYPE node_forks_total counter
node_forks_total 15884
# HELP node_intr_total Total number of interrupts serviced.
# TYPE node_intr_total counter
node_intr_total 1.286652e+06
# HELP node_load1 1m load average.
# TYPE node_load1 gauge
node_load1 0.12
# HELP node_load15 15m load average.
# TYPE node_load15 gauge
node_load15 0.19
# HELP node_load5 5m load average.
# TYPE node_load5 gauge
node_load5 0.16
# HELP node_memory_Active_anon_bytes Memory information field Active_anon_bytes.
# TYPE node_memory_Active_anon_bytes gauge
node_memory_Active_anon_bytes 1.25939712e+08
# HELP node_memory_Active_bytes Memory information field Active_bytes.
# TYPE node_memory_Active_bytes gauge
node_memory_Active_bytes 6.64567808e+08
# HELP node_memory_Active_file_bytes Memory information field Active_file_bytes.
# TYPE node_memory_Active_file_bytes gauge
node_memory_Active_file_bytes 5.38628096e+08
# HELP node_memory_AnonHugePages_bytes Memory information field AnonHugePages_bytes.
# TYPE node_memory_AnonHugePages_bytes gauge
node_memory_AnonHugePages_bytes 1.572864e+08
# HELP node_memory_AnonPages_bytes Memory information field AnonPages_bytes.
# TYPE node_memory_AnonPages_bytes gauge
node_memory_AnonPages_bytes 4.54627328e+08
# HELP node_memory_Bounce_bytes Memory information field Bounce_bytes.
# TYPE node_memory_Bounce_bytes gauge
node_memory_Bounce_bytes 0
# HELP node_memory_Buffers_bytes Memory information field Buffers_bytes.
# TYPE node_memory_Buffers_bytes gauge
node_memory_Buffers_bytes 266240
# HELP node_memory_Cached_bytes Memory information field Cached_bytes.
# TYPE node_memory_Cached_bytes gauge
node_memory_Cached_bytes 7.45578496e+08
# HELP node_memory_CmaFree_bytes Memory information field CmaFree_bytes.
# TYPE node_memory_CmaFree_bytes gauge
node_memory_CmaFree_bytes 0
# HELP node_memory_CmaTotal_bytes Memory information field CmaTotal_bytes.
# TYPE node_memory_CmaTotal_bytes gauge
node_memory_CmaTotal_bytes 0
# HELP node_memory_CommitLimit_bytes Memory information field CommitLimit_bytes.
# TYPE node_memory_CommitLimit_bytes gauge
node_memory_CommitLimit_bytes 3.031744512e+09
# HELP node_memory_Committed_AS_bytes Memory information field Committed_AS_bytes.
# TYPE node_memory_Committed_AS_bytes gauge
node_memory_Committed_AS_bytes 2.46775808e+09
# HELP node_memory_DirectMap1G_bytes Memory information field DirectMap1G_bytes.
# TYPE node_memory_DirectMap1G_bytes gauge
node_memory_DirectMap1G_bytes 0
# HELP node_memory_DirectMap2M_bytes Memory information field DirectMap2M_bytes.
# TYPE node_memory_DirectMap2M_bytes gauge
node_memory_DirectMap2M_bytes 2.009071616e+09
# HELP node_memory_DirectMap4k_bytes Memory information field DirectMap4k_bytes.
# TYPE node_memory_DirectMap4k_bytes gauge
node_memory_DirectMap4k_bytes 1.32988928e+08
# HELP node_memory_Dirty_bytes Memory information field Dirty_bytes.
# TYPE node_memory_Dirty_bytes gauge
node_memory_Dirty_bytes 151552
# HELP node_memory_FileHugePages_bytes Memory information field FileHugePages_bytes.
# TYPE node_memory_FileHugePages_bytes gauge
node_memory_FileHugePages_bytes 0
# HELP node_memory_FilePmdMapped_bytes Memory information field FilePmdMapped_bytes.
# TYPE node_memory_FilePmdMapped_bytes gauge
node_memory_FilePmdMapped_bytes 0
# HELP node_memory_HardwareCorrupted_bytes Memory information field HardwareCorrupted_bytes.
# TYPE node_memory_HardwareCorrupted_bytes gauge
node_memory_HardwareCorrupted_bytes 0
# HELP node_memory_HugePages_Free Memory information field HugePages_Free.
# TYPE node_memory_HugePages_Free gauge
node_memory_HugePages_Free 0
# HELP node_memory_HugePages_Rsvd Memory information field HugePages_Rsvd.
# TYPE node_memory_HugePages_Rsvd gauge
node_memory_HugePages_Rsvd 0
# HELP node_memory_HugePages_Surp Memory information field HugePages_Surp.
# TYPE node_memory_HugePages_Surp gauge
node_memory_HugePages_Surp 0
# HELP node_memory_HugePages_Total Memory information field HugePages_Total.
# TYPE node_memory_HugePages_Total gauge
node_memory_HugePages_Total 0
# HELP node_memory_Hugepagesize_bytes Memory information field Hugepagesize_bytes.
# TYPE node_memory_Hugepagesize_bytes gauge
node_memory_Hugepagesize_bytes 2.097152e+06
# HELP node_memory_Hugetlb_bytes Memory information field Hugetlb_bytes.
# TYPE node_memory_Hugetlb_bytes gauge
node_memory_Hugetlb_bytes 0
# HELP node_memory_Inactive_anon_bytes Memory information field Inactive_anon_bytes.
# TYPE node_memory_Inactive_anon_bytes gauge
node_memory_Inactive_anon_bytes 3.53579008e+08
# HELP node_memory_Inactive_bytes Memory information field Inactive_bytes.
# TYPE node_memory_Inactive_bytes gauge
node_memory_Inactive_bytes 5.47463168e+08
# HELP node_memory_Inactive_file_bytes Memory information field Inactive_file_bytes.
# TYPE node_memory_Inactive_file_bytes gauge
node_memory_Inactive_file_bytes 1.9388416e+08
# HELP node_memory_KReclaimable_bytes Memory information field KReclaimable_bytes.
# TYPE node_memory_KReclaimable_bytes gauge
node_memory_KReclaimable_bytes 7.3007104e+07
# HELP node_memory_KernelStack_bytes Memory information field KernelStack_bytes.
# TYPE node_memory_KernelStack_bytes gauge
node_memory_KernelStack_bytes 5.210112e+06
# HELP node_memory_Mapped_bytes Memory information field Mapped_bytes.
# TYPE node_memory_Mapped_bytes gauge
node_memory_Mapped_bytes 2.33955328e+08
# HELP node_memory_MemAvailable_bytes Memory information field MemAvailable_bytes.
# TYPE node_memory_MemAvailable_bytes gauge
node_memory_MemAvailable_bytes 9.44439296e+08
# HELP node_memory_MemFree_bytes Memory information field MemFree_bytes.
# TYPE node_memory_MemFree_bytes gauge
node_memory_MemFree_bytes 3.08723712e+08
# HELP node_memory_MemTotal_bytes Memory information field MemTotal_bytes.
# TYPE node_memory_MemTotal_bytes gauge
node_memory_MemTotal_bytes 1.768534016e+09
# HELP node_memory_Mlocked_bytes Memory information field Mlocked_bytes.
# TYPE node_memory_Mlocked_bytes gauge
node_memory_Mlocked_bytes 1.2664832e+07
# HELP node_memory_NFS_Unstable_bytes Memory information field NFS_Unstable_bytes.
# TYPE node_memory_NFS_Unstable_bytes gauge
node_memory_NFS_Unstable_bytes 0
# HELP node_memory_PageTables_bytes Memory information field PageTables_bytes.
# TYPE node_memory_PageTables_bytes gauge
node_memory_PageTables_bytes 1.3717504e+07
# HELP node_memory_Percpu_bytes Memory information field Percpu_bytes.
# TYPE node_memory_Percpu_bytes gauge
node_memory_Percpu_bytes 2.899968e+06
# HELP node_memory_SReclaimable_bytes Memory information field SReclaimable_bytes.
# TYPE node_memory_SReclaimable_bytes gauge
node_memory_SReclaimable_bytes 7.3007104e+07
# HELP node_memory_SUnreclaim_bytes Memory information field SUnreclaim_bytes.
# TYPE node_memory_SUnreclaim_bytes gauge
node_memory_SUnreclaim_bytes 8.6687744e+07
# HELP node_memory_ShmemHugePages_bytes Memory information field ShmemHugePages_bytes.
# TYPE node_memory_ShmemHugePages_bytes gauge
node_memory_ShmemHugePages_bytes 0
# HELP node_memory_ShmemPmdMapped_bytes Memory information field ShmemPmdMapped_bytes.
# TYPE node_memory_ShmemPmdMapped_bytes gauge
node_memory_ShmemPmdMapped_bytes 0
# HELP node_memory_Shmem_bytes Memory information field Shmem_bytes.
# TYPE node_memory_Shmem_bytes gauge
node_memory_Shmem_bytes 2.502656e+06
# HELP node_memory_Slab_bytes Memory information field Slab_bytes.
# TYPE node_memory_Slab_bytes gauge
node_memory_Slab_bytes 1.59694848e+08
# HELP node_memory_SwapCached_bytes Memory information field SwapCached_bytes.
# TYPE node_memory_SwapCached_bytes gauge
node_memory_SwapCached_bytes 4.968448e+07
# HELP node_memory_SwapFree_bytes Memory information field SwapFree_bytes.
# TYPE node_memory_SwapFree_bytes gauge
node_memory_SwapFree_bytes 1.889267712e+09
# HELP node_memory_SwapTotal_bytes Memory information field SwapTotal_bytes.
# TYPE node_memory_SwapTotal_bytes gauge
node_memory_SwapTotal_bytes 2.147479552e+09
# HELP node_memory_Unevictable_bytes Memory information field Unevictable_bytes.
# TYPE node_memory_Unevictable_bytes gauge
node_memory_Unevictable_bytes 1.2664832e+07
# HELP node_memory_VmallocChunk_bytes Memory information field VmallocChunk_bytes.
# TYPE node_memory_VmallocChunk_bytes gauge
node_memory_VmallocChunk_bytes 0
# HELP node_memory_VmallocTotal_bytes Memory information field VmallocTotal_bytes.
# TYPE node_memory_VmallocTotal_bytes gauge
node_memory_VmallocTotal_bytes 3.5184372087808e+13
# HELP node_memory_VmallocUsed_bytes Memory information field VmallocUsed_bytes.
# TYPE node_memory_VmallocUsed_bytes gauge
node_memory_VmallocUsed_bytes 1.6482304e+07
# HELP node_memory_WritebackTmp_bytes Memory information field WritebackTmp_bytes.
# TYPE node_memory_WritebackTmp_bytes gauge
node_memory_WritebackTmp_bytes 0
# HELP node_memory_Writeback_bytes Memory information field Writeback_bytes.
# TYPE node_memory_Writeback_bytes gauge
node_memory_Writeback_bytes 0
# HELP node_netstat_Icmp6_InErrors Statistic Icmp6InErrors.
# TYPE node_netstat_Icmp6_InErrors untyped
node_netstat_Icmp6_InErrors 0
# HELP node_netstat_Icmp6_InMsgs Statistic Icmp6InMsgs.
# TYPE node_netstat_Icmp6_InMsgs untyped
node_netstat_Icmp6_InMsgs 0
# HELP node_netstat_Icmp6_OutMsgs Statistic Icmp6OutMsgs.
# TYPE node_netstat_Icmp6_OutMsgs untyped
node_netstat_Icmp6_OutMsgs 23
# HELP node_netstat_Icmp_InErrors Statistic IcmpInErrors.
# TYPE node_netstat_Icmp_InErrors untyped
node_netstat_Icmp_InErrors 0
# HELP node_netstat_Icmp_InMsgs Statistic IcmpInMsgs.
# TYPE node_netstat_Icmp_InMsgs untyped
node_netstat_Icmp_InMsgs 3
# HELP node_netstat_Icmp_OutMsgs Statistic IcmpOutMsgs.
# TYPE node_netstat_Icmp_OutMsgs untyped
node_netstat_Icmp_OutMsgs 3
# HELP node_netstat_Ip6_InOctets Statistic Ip6InOctets.
# TYPE node_netstat_Ip6_InOctets untyped
node_netstat_Ip6_InOctets 2623
# HELP node_netstat_Ip6_OutOctets Statistic Ip6OutOctets.
# TYPE node_netstat_Ip6_OutOctets untyped
node_netstat_Ip6_OutOctets 4143
# HELP node_netstat_IpExt_InOctets Statistic IpExtInOctets.
# TYPE node_netstat_IpExt_InOctets untyped
node_netstat_IpExt_InOctets 9.61574646e+08
# HELP node_netstat_IpExt_OutOctets Statistic IpExtOutOctets.
# TYPE node_netstat_IpExt_OutOctets untyped
node_netstat_IpExt_OutOctets 3.70958545e+08
# HELP node_netstat_Ip_Forwarding Statistic IpForwarding.
# TYPE node_netstat_Ip_Forwarding untyped
node_netstat_Ip_Forwarding 2
# HELP node_netstat_TcpExt_ListenDrops Statistic TcpExtListenDrops.
# TYPE node_netstat_TcpExt_ListenDrops untyped
node_netstat_TcpExt_ListenDrops 0
# HELP node_netstat_TcpExt_ListenOverflows Statistic TcpExtListenOverflows.
# TYPE node_netstat_TcpExt_ListenOverflows untyped
node_netstat_TcpExt_ListenOverflows 0
# HELP node_netstat_TcpExt_SyncookiesFailed Statistic TcpExtSyncookiesFailed.
# TYPE node_netstat_TcpExt_SyncookiesFailed untyped
node_netstat_TcpExt_SyncookiesFailed 0
# HELP node_netstat_TcpExt_SyncookiesRecv Statistic TcpExtSyncookiesRecv.
# TYPE node_netstat_TcpExt_SyncookiesRecv untyped
node_netstat_TcpExt_SyncookiesRecv 0
# HELP node_netstat_TcpExt_SyncookiesSent Statistic TcpExtSyncookiesSent.
# TYPE node_netstat_TcpExt_SyncookiesSent untyped
node_netstat_TcpExt_SyncookiesSent 0
# HELP node_netstat_TcpExt_TCPSynRetrans Statistic TcpExtTCPSynRetrans.
# TYPE node_netstat_TcpExt_TCPSynRetrans untyped
node_netstat_TcpExt_TCPSynRetrans 0
# HELP node_netstat_TcpExt_TCPTimeouts Statistic TcpExtTCPTimeouts.
# TYPE node_netstat_TcpExt_TCPTimeouts untyped
node_netstat_TcpExt_TCPTimeouts 18
# HELP node_netstat_Tcp_ActiveOpens Statistic TcpActiveOpens.
# TYPE node_netstat_Tcp_ActiveOpens untyped
node_netstat_Tcp_ActiveOpens 620
# HELP node_netstat_Tcp_CurrEstab Statistic TcpCurrEstab.
# TYPE node_netstat_Tcp_CurrEstab untyped
node_netstat_Tcp_CurrEstab 8
# HELP node_netstat_Tcp_InErrs Statistic TcpInErrs.
# TYPE node_netstat_Tcp_InErrs untyped
node_netstat_Tcp_InErrs 0
# HELP node_netstat_Tcp_InSegs Statistic TcpInSegs.
# TYPE node_netstat_Tcp_InSegs untyped
node_netstat_Tcp_InSegs 48537
# HELP node_netstat_Tcp_OutRsts Statistic TcpOutRsts.
# TYPE node_netstat_Tcp_OutRsts untyped
node_netstat_Tcp_OutRsts 117
# HELP node_netstat_Tcp_OutSegs Statistic TcpOutSegs.
# TYPE node_netstat_Tcp_OutSegs untyped
node_netstat_Tcp_OutSegs 31670
# HELP node_netstat_Tcp_PassiveOpens Statistic TcpPassiveOpens.
# TYPE node_netstat_Tcp_PassiveOpens untyped
node_netstat_Tcp_PassiveOpens 92
# HELP node_netstat_Tcp_RetransSegs Statistic TcpRetransSegs.
# TYPE node_netstat_Tcp_RetransSegs untyped
node_netstat_Tcp_RetransSegs 24
# HELP node_netstat_Udp6_InDatagrams Statistic Udp6InDatagrams.
# TYPE node_netstat_Udp6_InDatagrams untyped
node_netstat_Udp6_InDatagrams 0
# HELP node_netstat_Udp6_InErrors Statistic Udp6InErrors.
# TYPE node_netstat_Udp6_InErrors untyped
node_netstat_Udp6_InErrors 0
# HELP node_netstat_Udp6_NoPorts Statistic Udp6NoPorts.
# TYPE node_netstat_Udp6_NoPorts untyped
node_netstat_Udp6_NoPorts 0
# HELP node_netstat_Udp6_OutDatagrams Statistic Udp6OutDatagrams.
# TYPE node_netstat_Udp6_OutDatagrams untyped
node_netstat_Udp6_OutDatagrams 0
# HELP node_netstat_Udp6_RcvbufErrors Statistic Udp6RcvbufErrors.
# TYPE node_netstat_Udp6_RcvbufErrors untyped
node_netstat_Udp6_RcvbufErrors 0
# HELP node_netstat_Udp6_SndbufErrors Statistic Udp6SndbufErrors.
# TYPE node_netstat_Udp6_SndbufErrors untyped
node_netstat_Udp6_SndbufErrors 0
# HELP node_netstat_UdpLite6_InErrors Statistic UdpLite6InErrors.
# TYPE node_netstat_UdpLite6_InErrors untyped
node_netstat_UdpLite6_InErrors 0
# HELP node_netstat_UdpLite_InErrors Statistic UdpLiteInErrors.
# TYPE node_netstat_UdpLite_InErrors untyped
node_netstat_UdpLite_InErrors 0
# HELP node_netstat_Udp_InDatagrams Statistic UdpInDatagrams.
# TYPE node_netstat_Udp_InDatagrams untyped
node_netstat_Udp_InDatagrams 532
# HELP node_netstat_Udp_InErrors Statistic UdpInErrors.
# TYPE node_netstat_Udp_InErrors untyped
node_netstat_Udp_InErrors 0
# HELP node_netstat_Udp_NoPorts Statistic UdpNoPorts.
# TYPE node_netstat_Udp_NoPorts untyped
node_netstat_Udp_NoPorts 2
# HELP node_netstat_Udp_OutDatagrams Statistic UdpOutDatagrams.
# TYPE node_netstat_Udp_OutDatagrams untyped
node_netstat_Udp_OutDatagrams 534
# HELP node_netstat_Udp_RcvbufErrors Statistic UdpRcvbufErrors.
# TYPE node_netstat_Udp_RcvbufErrors untyped
node_netstat_Udp_RcvbufErrors 0
# HELP node_netstat_Udp_SndbufErrors Statistic UdpSndbufErrors.
# TYPE node_netstat_Udp_SndbufErrors untyped
node_netstat_Udp_SndbufErrors 0
# HELP node_network_address_assign_type Network device property: address_assign_type
# TYPE node_network_address_assign_type gauge
node_network_address_assign_type{device="ens3"} 0
node_network_address_assign_type{device="lo"} 0
# HELP node_network_carrier Network device property: carrier
# TYPE node_network_carrier gauge
node_network_carrier{device="ens3"} 1
node_network_carrier{device="lo"} 1
# HELP node_network_carrier_changes_total Network device property: carrier_changes_total
# TYPE node_network_carrier_changes_total counter
node_network_carrier_changes_total{device="ens3"} 2
node_network_carrier_changes_total{device="lo"} 0
# HELP node_network_carrier_down_changes_total Network device property: carrier_down_changes_total
# TYPE node_network_carrier_down_changes_total counter
node_network_carrier_down_changes_total{device="ens3"} 1
node_network_carrier_down_changes_total{device="lo"} 0
# HELP node_network_carrier_up_changes_total Network device property: carrier_up_changes_total
# TYPE node_network_carrier_up_changes_total counter
node_network_carrier_up_changes_total{device="ens3"} 1
node_network_carrier_up_changes_total{device="lo"} 0
# HELP node_network_device_id Network device property: device_id
# TYPE node_network_device_id gauge
node_network_device_id{device="ens3"} 0
node_network_device_id{device="lo"} 0
# HELP node_network_dormant Network device property: dormant
# TYPE node_network_dormant gauge
node_network_dormant{device="ens3"} 0
node_network_dormant{device="lo"} 0
# HELP node_network_flags Network device property: flags
# TYPE node_network_flags gauge
node_network_flags{device="ens3"} 4099
node_network_flags{device="lo"} 9
# HELP node_network_iface_id Network device property: iface_id
# TYPE node_network_iface_id gauge
node_network_iface_id{device="ens3"} 2
node_network_iface_id{device="lo"} 1
# HELP node_network_iface_link Network device property: iface_link
# TYPE node_network_iface_link gauge
node_network_iface_link{device="ens3"} 2
node_network_iface_link{device="lo"} 1
# HELP node_network_iface_link_mode Network device property: iface_link_mode
# TYPE node_network_iface_link_mode gauge
node_network_iface_link_mode{device="ens3"} 0
node_network_iface_link_mode{device="lo"} 0
# HELP node_network_info Non-numeric data from /sys/class/net/<iface>, value is always 1.
# TYPE node_network_info gauge
node_network_info{address="00:00:00:00:00:00",broadcast="00:00:00:00:00:00",device="lo",duplex="",ifalias="",operstate="unknown"} 1
node_network_info{address="02:00:17:0c:8e:8f",broadcast="ff:ff:ff:ff:ff:ff",device="ens3",duplex="unknown",ifalias="",operstate="up"} 1
# HELP node_network_mtu_bytes Network device property: mtu_bytes
# TYPE node_network_mtu_bytes gauge
node_network_mtu_bytes{device="ens3"} 9000
node_network_mtu_bytes{device="lo"} 65536
# HELP node_network_name_assign_type Network device property: name_assign_type
# TYPE node_network_name_assign_type gauge
node_network_name_assign_type{device="ens3"} 4
# HELP node_network_net_dev_group Network device property: net_dev_group
# TYPE node_network_net_dev_group gauge
node_network_net_dev_group{device="ens3"} 0
node_network_net_dev_group{device="lo"} 0
# HELP node_network_protocol_type Network device property: protocol_type
# TYPE node_network_protocol_type gauge
node_network_protocol_type{device="ens3"} 1
node_network_protocol_type{device="lo"} 772
# HELP node_network_receive_bytes_total Network device statistic receive_bytes.
# TYPE node_network_receive_bytes_total counter
node_network_receive_bytes_total{device="ens3"} 5.999876e+08
node_network_receive_bytes_total{device="lo"} 3.62216225e+08
# HELP node_network_receive_compressed_total Network device statistic receive_compressed.
# TYPE node_network_receive_compressed_total counter
node_network_receive_compressed_total{device="ens3"} 0
node_network_receive_compressed_total{device="lo"} 0
# HELP node_network_receive_drop_total Network device statistic receive_drop.
# TYPE node_network_receive_drop_total counter
node_network_receive_drop_total{device="ens3"} 0
node_network_receive_drop_total{device="lo"} 0
# HELP node_network_receive_errs_total Network device statistic receive_errs.
# TYPE node_network_receive_errs_total counter
node_network_receive_errs_total{device="ens3"} 0
node_network_receive_errs_total{device="lo"} 0
# HELP node_network_receive_fifo_total Network device statistic receive_fifo.
# TYPE node_network_receive_fifo_total counter
node_network_receive_fifo_total{device="ens3"} 0
node_network_receive_fifo_total{device="lo"} 0
# HELP node_network_receive_frame_total Network device statistic receive_frame.
# TYPE node_network_receive_frame_total counter
node_network_receive_frame_total{device="ens3"} 0
node_network_receive_frame_total{device="lo"} 0
# HELP node_network_receive_multicast_total Network device statistic receive_multicast.
# TYPE node_network_receive_multicast_total counter
node_network_receive_multicast_total{device="ens3"} 0
node_network_receive_multicast_total{device="lo"} 0
# HELP node_network_receive_nohandler_total Network device statistic receive_nohandler.
# TYPE node_network_receive_nohandler_total counter
node_network_receive_nohandler_total{device="ens3"} 0
node_network_receive_nohandler_total{device="lo"} 0
# HELP node_network_receive_packets_total Network device statistic receive_packets.
# TYPE node_network_receive_packets_total counter
node_network_receive_packets_total{device="ens3"} 39604
node_network_receive_packets_total{device="lo"} 10901
# HELP node_network_speed_bytes Network device property: speed_bytes
# TYPE node_network_speed_bytes gauge
node_network_speed_bytes{device="ens3"} -125000
# HELP node_network_transmit_bytes_total Network device statistic transmit_bytes.
# TYPE node_network_transmit_bytes_total counter
node_network_transmit_bytes_total{device="ens3"} 9.047229e+06
node_network_transmit_bytes_total{device="lo"} 3.62216225e+08
# HELP node_network_transmit_carrier_total Network device statistic transmit_carrier.
# TYPE node_network_transmit_carrier_total counter
node_network_transmit_carrier_total{device="ens3"} 0
node_network_transmit_carrier_total{device="lo"} 0
# HELP node_network_transmit_colls_total Network device statistic transmit_colls.
# TYPE node_network_transmit_colls_total counter
node_network_transmit_colls_total{device="ens3"} 0
node_network_transmit_colls_total{device="lo"} 0
# HELP node_network_transmit_compressed_total Network device statistic transmit_compressed.
# TYPE node_network_transmit_compressed_total counter
node_network_transmit_compressed_total{device="ens3"} 0
node_network_transmit_compressed_total{device="lo"} 0
# HELP node_network_transmit_drop_total Network device statistic transmit_drop.
# TYPE node_network_transmit_drop_total counter
node_network_transmit_drop_total{device="ens3"} 0
node_network_transmit_drop_total{device="lo"} 0
# HELP node_network_transmit_errs_total Network device statistic transmit_errs.
# TYPE node_network_transmit_errs_total counter
node_network_transmit_errs_total{device="ens3"} 0
node_network_transmit_errs_total{device="lo"} 0
# HELP node_network_transmit_fifo_total Network device statistic transmit_fifo.
# TYPE node_network_transmit_fifo_total counter
node_network_transmit_fifo_total{device="ens3"} 0
node_network_transmit_fifo_total{device="lo"} 0
# HELP node_network_transmit_packets_total Network device statistic transmit_packets.
# TYPE node_network_transmit_packets_total counter
node_network_transmit_packets_total{device="ens3"} 21159
node_network_transmit_packets_total{device="lo"} 10901
# HELP node_network_transmit_queue_length Network device property: transmit_queue_length
# TYPE node_network_transmit_queue_length gauge
node_network_transmit_queue_length{device="ens3"} 1000
node_network_transmit_queue_length{device="lo"} 1000
# HELP node_network_up Value is 1 if operstate is 'up', 0 otherwise.
# TYPE node_network_up gauge
node_network_up{device="ens3"} 1
node_network_up{device="lo"} 0
# HELP node_nf_conntrack_entries Number of currently allocated flow entries for connection tracking.
# TYPE node_nf_conntrack_entries gauge
node_nf_conntrack_entries 80
# HELP node_nf_conntrack_entries_limit Maximum size of connection tracking table.
# TYPE node_nf_conntrack_entries_limit gauge
node_nf_conntrack_entries_limit 65536
# HELP node_nf_conntrack_stat_drop Number of packets dropped due to conntrack failure.
# TYPE node_nf_conntrack_stat_drop gauge
node_nf_conntrack_stat_drop 0
# HELP node_nf_conntrack_stat_early_drop Number of dropped conntrack entries to make room for new ones, if maximum table size was reached.
# TYPE node_nf_conntrack_stat_early_drop gauge
node_nf_conntrack_stat_early_drop 0
# HELP node_nf_conntrack_stat_found Number of searched entries which were successful.
# TYPE node_nf_conntrack_stat_found gauge
node_nf_conntrack_stat_found 0
# HELP node_nf_conntrack_stat_ignore Number of packets seen which are already connected to a conntrack entry.
# TYPE node_nf_conntrack_stat_ignore gauge
node_nf_conntrack_stat_ignore 10895
# HELP node_nf_conntrack_stat_insert Number of entries inserted into the list.
# TYPE node_nf_conntrack_stat_insert gauge
node_nf_conntrack_stat_insert 0
# HELP node_nf_conntrack_stat_insert_failed Number of entries for which list insertion was attempted but failed.
# TYPE node_nf_conntrack_stat_insert_failed gauge
node_nf_conntrack_stat_insert_failed 0
# HELP node_nf_conntrack_stat_invalid Number of packets seen which can not be tracked.
# TYPE node_nf_conntrack_stat_invalid gauge
node_nf_conntrack_stat_invalid 37
# HELP node_nf_conntrack_stat_search_restart Number of conntrack table lookups which had to be restarted due to hashtable resizes.
# TYPE node_nf_conntrack_stat_search_restart gauge
node_nf_conntrack_stat_search_restart 3
# HELP node_os_info A metric with a constant '1' value labeled by build_id, id, id_like, image_id, image_version, name, pretty_name, variant, variant_id, version, version_codename, version_id.
# TYPE node_os_info gauge
node_os_info{build_id="",id="ol",id_like="fedora",image_id="",image_version="",name="Oracle Linux Server",pretty_name="Oracle Linux Server 8.6",variant="Server",variant_id="server",version="8.6",version_codename="",version_id="8.6"} 1
# HELP node_os_version Metric containing the major.minor part of the OS version.
# TYPE node_os_version gauge
node_os_version{id="ol",id_like="fedora",name="Oracle Linux Server"} 8.6
# HELP node_procs_blocked Number of processes blocked waiting for I/O to complete.
# TYPE node_procs_blocked gauge
node_procs_blocked 0
# HELP node_procs_running Number of processes in runnable state.
# TYPE node_procs_running gauge
node_procs_running 1
# HELP node_schedstat_running_seconds_total Number of seconds CPU spent running a process.
# TYPE node_schedstat_running_seconds_total counter
node_schedstat_running_seconds_total{cpu="0"} 74.026142871
node_schedstat_running_seconds_total{cpu="1"} 183.008754225
node_schedstat_running_seconds_total{cpu="2"} 91.247592586
node_schedstat_running_seconds_total{cpu="3"} 55.623781603
# HELP node_schedstat_timeslices_total Number of timeslices executed by CPU.
# TYPE node_schedstat_timeslices_total counter
node_schedstat_timeslices_total{cpu="0"} 163102
node_schedstat_timeslices_total{cpu="1"} 149405
node_schedstat_timeslices_total{cpu="2"} 147411
node_schedstat_timeslices_total{cpu="3"} 164618
# HELP node_schedstat_waiting_seconds_total Number of seconds spent by processing waiting for this CPU.
# TYPE node_schedstat_waiting_seconds_total counter
node_schedstat_waiting_seconds_total{cpu="0"} 10.277864151
node_schedstat_waiting_seconds_total{cpu="1"} 4.821453028
node_schedstat_waiting_seconds_total{cpu="2"} 9.013271414
node_schedstat_waiting_seconds_total{cpu="3"} 7.166381553
# HELP node_scrape_collector_duration_seconds node_exporter: Duration of a collector scrape.
# TYPE node_scrape_collector_duration_seconds gauge
node_scrape_collector_duration_seconds{collector="arp"} 4.142e-05
node_scrape_collector_duration_seconds{collector="bcache"} 2.3014e-05
node_scrape_collector_duration_seconds{collector="bonding"} 1.1392e-05
node_scrape_collector_duration_seconds{collector="btrfs"} 0.005778469
node_scrape_collector_duration_seconds{collector="conntrack"} 0.000140566
node_scrape_collector_duration_seconds{collector="cpu"} 0.000399397
node_scrape_collector_duration_seconds{collector="cpufreq"} 4.697e-05
node_scrape_collector_duration_seconds{collector="diskstats"} 0.000360112
node_scrape_collector_duration_seconds{collector="dmi"} 1.551e-05
node_scrape_collector_duration_seconds{collector="edac"} 2.7671e-05
node_scrape_collector_duration_seconds{collector="entropy"} 0.002769182
node_scrape_collector_duration_seconds{collector="fibrechannel"} 2.2292e-05
node_scrape_collector_duration_seconds{collector="filefd"} 0.000112154
node_scrape_collector_duration_seconds{collector="filesystem"} 0.000565072
node_scrape_collector_duration_seconds{collector="hwmon"} 1.7835e-05
node_scrape_collector_duration_seconds{collector="infiniband"} 1.4307e-05
node_scrape_collector_duration_seconds{collector="ipvs"} 1.075e-05
node_scrape_collector_duration_seconds{collector="loadavg"} 4.4333e-05
node_scrape_collector_duration_seconds{collector="mdadm"} 4.5427e-05
node_scrape_collector_duration_seconds{collector="meminfo"} 0.000167979
node_scrape_collector_duration_seconds{collector="netclass"} 0.001037468
node_scrape_collector_duration_seconds{collector="netdev"} 0.000209057
node_scrape_collector_duration_seconds{collector="netstat"} 0.0008332
node_scrape_collector_duration_seconds{collector="nfs"} 2.0438e-05
node_scrape_collector_duration_seconds{collector="nfsd"} 8.3488e-05
node_scrape_collector_duration_seconds{collector="nvme"} 1.8665e-05
node_scrape_collector_duration_seconds{collector="os"} 9.5281e-05
node_scrape_collector_duration_seconds{collector="powersupplyclass"} 2.6621e-05
node_scrape_collector_duration_seconds{collector="pressure"} 4.7271e-05
node_scrape_collector_duration_seconds{collector="rapl"} 1.8856e-05
node_scrape_collector_duration_seconds{collector="schedstat"} 8.5433e-05
node_scrape_collector_duration_seconds{collector="selinux"} 0.000269051
node_scrape_collector_duration_seconds{collector="sockstat"} 0.000114286
node_scrape_collector_duration_seconds{collector="softnet"} 4.9835e-05
node_scrape_collector_duration_seconds{collector="stat"} 0.000117193
node_scrape_collector_duration_seconds{collector="tapestats"} 1.2433e-05
node_scrape_collector_duration_seconds{collector="textfile"} 9.517e-06
node_scrape_collector_duration_seconds{collector="thermal_zone"} 0.000203546
node_scrape_collector_duration_seconds{collector="time"} 0.000125489
node_scrape_collector_duration_seconds{collector="timex"} 1.6231e-05
node_scrape_collector_duration_seconds{collector="udp_queues"} 0.00012672
node_scrape_collector_duration_seconds{collector="uname"} 9.389e-06
node_scrape_collector_duration_seconds{collector="vmstat"} 0.00013166
node_scrape_collector_duration_seconds{collector="xfs"} 0.000576824
node_scrape_collector_duration_seconds{collector="zfs"} 1.3345e-05
# HELP node_scrape_collector_success node_exporter: Whether a collector succeeded.
# TYPE node_scrape_collector_success gauge
node_scrape_collector_success{collector="arp"} 1
node_scrape_collector_success{collector="bcache"} 1
node_scrape_collector_success{collector="bonding"} 0
node_scrape_collector_success{collector="btrfs"} 1
node_scrape_collector_success{collector="conntrack"} 1
node_scrape_collector_success{collector="cpu"} 1
node_scrape_collector_success{collector="cpufreq"} 1
node_scrape_collector_success{collector="diskstats"} 1
node_scrape_collector_success{collector="dmi"} 1
node_scrape_collector_success{collector="edac"} 1
node_scrape_collector_success{collector="entropy"} 1
node_scrape_collector_success{collector="fibrechannel"} 0
node_scrape_collector_success{collector="filefd"} 1
node_scrape_collector_success{collector="filesystem"} 1
node_scrape_collector_success{collector="hwmon"} 1
node_scrape_collector_success{collector="infiniband"} 0
node_scrape_collector_success{collector="ipvs"} 0
node_scrape_collector_success{collector="loadavg"} 1
node_scrape_collector_success{collector="mdadm"} 1
node_scrape_collector_success{collector="meminfo"} 1
node_scrape_collector_success{collector="netclass"} 1
node_scrape_collector_success{collector="netdev"} 1
node_scrape_collector_success{collector="netstat"} 1
node_scrape_collector_success{collector="nfs"} 0
node_scrape_collector_success{collector="nfsd"} 0
node_scrape_collector_success{collector="nvme"} 1
node_scrape_collector_success{collector="os"} 1
node_scrape_collector_success{collector="powersupplyclass"} 1
node_scrape_collector_success{collector="pressure"} 0
node_scrape_collector_success{collector="rapl"} 1
node_scrape_collector_success{collector="schedstat"} 1
node_scrape_collector_success{collector="selinux"} 1
node_scrape_collector_success{collector="sockstat"} 1
node_scrape_collector_success{collector="softnet"} 1
node_scrape_collector_success{collector="stat"} 1
node_scrape_collector_success{collector="tapestats"} 0
node_scrape_collector_success{collector="textfile"} 1
node_scrape_collector_success{collector="thermal_zone"} 1
node_scrape_collector_success{collector="time"} 1
node_scrape_collector_success{collector="timex"} 1
node_scrape_collector_success{collector="udp_queues"} 1
node_scrape_collector_success{collector="uname"} 1
node_scrape_collector_success{collector="vmstat"} 1
node_scrape_collector_success{collector="xfs"} 1
node_scrape_collector_success{collector="zfs"} 0
# HELP node_selinux_config_mode Configured SELinux enforcement mode
# TYPE node_selinux_config_mode gauge
node_selinux_config_mode 1
# HELP node_selinux_current_mode Current SELinux enforcement mode
# TYPE node_selinux_current_mode gauge
node_selinux_current_mode 1
# HELP node_selinux_enabled SELinux is enabled, 1 is true, 0 is false
# TYPE node_selinux_enabled gauge
node_selinux_enabled 1
# HELP node_sockstat_FRAG6_inuse Number of FRAG6 sockets in state inuse.
# TYPE node_sockstat_FRAG6_inuse gauge
node_sockstat_FRAG6_inuse 0
# HELP node_sockstat_FRAG6_memory Number of FRAG6 sockets in state memory.
# TYPE node_sockstat_FRAG6_memory gauge
node_sockstat_FRAG6_memory 0
# HELP node_sockstat_FRAG_inuse Number of FRAG sockets in state inuse.
# TYPE node_sockstat_FRAG_inuse gauge
node_sockstat_FRAG_inuse 0
# HELP node_sockstat_FRAG_memory Number of FRAG sockets in state memory.
# TYPE node_sockstat_FRAG_memory gauge
node_sockstat_FRAG_memory 0
# HELP node_sockstat_RAW6_inuse Number of RAW6 sockets in state inuse.
# TYPE node_sockstat_RAW6_inuse gauge
node_sockstat_RAW6_inuse 0
# HELP node_sockstat_RAW_inuse Number of RAW sockets in state inuse.
# TYPE node_sockstat_RAW_inuse gauge
node_sockstat_RAW_inuse 0
# HELP node_sockstat_TCP6_inuse Number of TCP6 sockets in state inuse.
# TYPE node_sockstat_TCP6_inuse gauge
node_sockstat_TCP6_inuse 11
# HELP node_sockstat_TCP_alloc Number of TCP sockets in state alloc.
# TYPE node_sockstat_TCP_alloc gauge
node_sockstat_TCP_alloc 21
# HELP node_sockstat_TCP_inuse Number of TCP sockets in state inuse.
# TYPE node_sockstat_TCP_inuse gauge
node_sockstat_TCP_inuse 10
# HELP node_sockstat_TCP_mem Number of TCP sockets in state mem.
# TYPE node_sockstat_TCP_mem gauge
node_sockstat_TCP_mem 9
# HELP node_sockstat_TCP_mem_bytes Number of TCP sockets in state mem_bytes.
# TYPE node_sockstat_TCP_mem_bytes gauge
node_sockstat_TCP_mem_bytes 36864
# HELP node_sockstat_TCP_orphan Number of TCP sockets in state orphan.
# TYPE node_sockstat_TCP_orphan gauge
node_sockstat_TCP_orphan 0
# HELP node_sockstat_TCP_tw Number of TCP sockets in state tw.
# TYPE node_sockstat_TCP_tw gauge
node_sockstat_TCP_tw 2
# HELP node_sockstat_UDP6_inuse Number of UDP6 sockets in state inuse.
# TYPE node_sockstat_UDP6_inuse gauge
node_sockstat_UDP6_inuse 2
# HELP node_sockstat_UDPLITE6_inuse Number of UDPLITE6 sockets in state inuse.
# TYPE node_sockstat_UDPLITE6_inuse gauge
node_sockstat_UDPLITE6_inuse 0
# HELP node_sockstat_UDPLITE_inuse Number of UDPLITE sockets in state inuse.
# TYPE node_sockstat_UDPLITE_inuse gauge
node_sockstat_UDPLITE_inuse 0
# HELP node_sockstat_UDP_inuse Number of UDP sockets in state inuse.
# TYPE node_sockstat_UDP_inuse gauge
node_sockstat_UDP_inuse 3
# HELP node_sockstat_UDP_mem Number of UDP sockets in state mem.
# TYPE node_sockstat_UDP_mem gauge
node_sockstat_UDP_mem 0
# HELP node_sockstat_UDP_mem_bytes Number of UDP sockets in state mem_bytes.
# TYPE node_sockstat_UDP_mem_bytes gauge
node_sockstat_UDP_mem_bytes 0
# HELP node_sockstat_sockets_used Number of IPv4 sockets in use.
# TYPE node_sockstat_sockets_used gauge
node_sockstat_sockets_used 273
# HELP node_softnet_dropped_total Number of dropped packets
# TYPE node_softnet_dropped_total counter
node_softnet_dropped_total{cpu="0"} 0
node_softnet_dropped_total{cpu="1"} 0
node_softnet_dropped_total{cpu="2"} 0
node_softnet_dropped_total{cpu="3"} 0
# HELP node_softnet_processed_total Number of processed packets
# TYPE node_softnet_processed_total counter
node_softnet_processed_total{cpu="0"} 3214
node_softnet_processed_total{cpu="1"} 3119
node_softnet_processed_total{cpu="2"} 3658
node_softnet_processed_total{cpu="3"} 39226
# HELP node_softnet_times_squeezed_total Number of times processing packets ran out of quota
# TYPE node_softnet_times_squeezed_total counter
node_softnet_times_squeezed_total{cpu="0"} 0
node_softnet_times_squeezed_total{cpu="1"} 0
node_softnet_times_squeezed_total{cpu="2"} 0
node_softnet_times_squeezed_total{cpu="3"} 0
# HELP node_textfile_scrape_error 1 if there was an error opening or reading a file, 0 otherwise
# TYPE node_textfile_scrape_error gauge
node_textfile_scrape_error 0
# HELP node_time_clocksource_available_info Available clocksources read from '/sys/devices/system/clocksource'.
# TYPE node_time_clocksource_available_info gauge
node_time_clocksource_available_info{clocksource="acpi_pm",device="0"} 1
node_time_clocksource_available_info{clocksource="hpet",device="0"} 1
node_time_clocksource_available_info{clocksource="kvm-clock",device="0"} 1
# HELP node_time_clocksource_current_info Current clocksource read from '/sys/devices/system/clocksource'.
# TYPE node_time_clocksource_current_info gauge
node_time_clocksource_current_info{clocksource="kvm-clock",device="0"} 1
# HELP node_time_seconds System time in seconds since epoch (1970).
# TYPE node_time_seconds gauge
node_time_seconds 1.676085095654785e+09
# HELP node_time_zone_offset_seconds System time zone offset in seconds.
# TYPE node_time_zone_offset_seconds gauge
node_time_zone_offset_seconds{time_zone="GMT"} 0
# HELP node_timex_estimated_error_seconds Estimated error in seconds.
# TYPE node_timex_estimated_error_seconds gauge
node_timex_estimated_error_seconds 6e-06
# HELP node_timex_frequency_adjustment_ratio Local clock frequency adjustment.
# TYPE node_timex_frequency_adjustment_ratio gauge
node_timex_frequency_adjustment_ratio 1.0000125175170897
# HELP node_timex_loop_time_constant Phase-locked loop time constant.
# TYPE node_timex_loop_time_constant gauge
node_timex_loop_time_constant 2
# HELP node_timex_maxerror_seconds Maximum error in seconds.
# TYPE node_timex_maxerror_seconds gauge
node_timex_maxerror_seconds 0.009134
# HELP node_timex_offset_seconds Time offset in between local system and reference clock.
# TYPE node_timex_offset_seconds gauge
node_timex_offset_seconds 0
# HELP node_timex_pps_calibration_total Pulse per second count of calibration intervals.
# TYPE node_timex_pps_calibration_total counter
node_timex_pps_calibration_total 0
# HELP node_timex_pps_error_total Pulse per second count of calibration errors.
# TYPE node_timex_pps_error_total counter
node_timex_pps_error_total 0
# HELP node_timex_pps_frequency_hertz Pulse per second frequency.
# TYPE node_timex_pps_frequency_hertz gauge
node_timex_pps_frequency_hertz 0
# HELP node_timex_pps_jitter_seconds Pulse per second jitter.
# TYPE node_timex_pps_jitter_seconds gauge
node_timex_pps_jitter_seconds 0
# HELP node_timex_pps_jitter_total Pulse per second count of jitter limit exceeded events.
# TYPE node_timex_pps_jitter_total counter
node_timex_pps_jitter_total 0
# HELP node_timex_pps_shift_seconds Pulse per second interval duration.
# TYPE node_timex_pps_shift_seconds gauge
node_timex_pps_shift_seconds 0
# HELP node_timex_pps_stability_exceeded_total Pulse per second count of stability limit exceeded events.
# TYPE node_timex_pps_stability_exceeded_total counter
node_timex_pps_stability_exceeded_total 0
# HELP node_timex_pps_stability_hertz Pulse per second stability, average of recent frequency changes.
# TYPE node_timex_pps_stability_hertz gauge
node_timex_pps_stability_hertz 0
# HELP node_timex_status Value of the status array bits.
# TYPE node_timex_status gauge
node_timex_status 0
# HELP node_timex_sync_status Is clock synchronized to a reliable server (1 = yes, 0 = no).
# TYPE node_timex_sync_status gauge
node_timex_sync_status 1
# HELP node_timex_tai_offset_seconds International Atomic Time (TAI) offset.
# TYPE node_timex_tai_offset_seconds gauge
node_timex_tai_offset_seconds 37
# HELP node_timex_tick_seconds Seconds between clock ticks.
# TYPE node_timex_tick_seconds gauge
node_timex_tick_seconds 0.01
# HELP node_udp_queues Number of allocated memory in the kernel for UDP datagrams in bytes.
# TYPE node_udp_queues gauge
node_udp_queues{ip="v4",queue="rx"} 0
node_udp_queues{ip="v4",queue="tx"} 0
node_udp_queues{ip="v6",queue="rx"} 0
node_udp_queues{ip="v6",queue="tx"} 0
# HELP node_uname_info Labeled system information as provided by the uname system call.
# TYPE node_uname_info gauge
node_uname_info{domainname="(none)",machine="x86_64",nodename="ol8-prome",release="5.4.17-2136.314.6.2.el8uek.x86_64",sysname="Linux",version="#2 SMP Fri Dec 9 16:25:48 PST 2022"} 1
# HELP node_vmstat_oom_kill /proc/vmstat information field oom_kill.
# TYPE node_vmstat_oom_kill untyped
node_vmstat_oom_kill 0
# HELP node_vmstat_pgfault /proc/vmstat information field pgfault.
# TYPE node_vmstat_pgfault untyped
node_vmstat_pgfault 7.239004e+06
# HELP node_vmstat_pgmajfault /proc/vmstat information field pgmajfault.
# TYPE node_vmstat_pgmajfault untyped
node_vmstat_pgmajfault 30157
# HELP node_vmstat_pgpgin /proc/vmstat information field pgpgin.
# TYPE node_vmstat_pgpgin untyped
node_vmstat_pgpgin 2.683316e+06
# HELP node_vmstat_pgpgout /proc/vmstat information field pgpgout.
# TYPE node_vmstat_pgpgout untyped
node_vmstat_pgpgout 2.613606e+06
# HELP node_vmstat_pswpin /proc/vmstat information field pswpin.
# TYPE node_vmstat_pswpin untyped
node_vmstat_pswpin 39823
# HELP node_vmstat_pswpout /proc/vmstat information field pswpout.
# TYPE node_vmstat_pswpout untyped
node_vmstat_pswpout 107286
# HELP node_xfs_allocation_btree_compares_total Number of allocation B-tree compares for a filesystem.
# TYPE node_xfs_allocation_btree_compares_total counter
node_xfs_allocation_btree_compares_total{device="dm-0"} 0
node_xfs_allocation_btree_compares_total{device="dm-1"} 0
node_xfs_allocation_btree_compares_total{device="sda2"} 0
# HELP node_xfs_allocation_btree_lookups_total Number of allocation B-tree lookups for a filesystem.
# TYPE node_xfs_allocation_btree_lookups_total counter
node_xfs_allocation_btree_lookups_total{device="dm-0"} 0
node_xfs_allocation_btree_lookups_total{device="dm-1"} 0
node_xfs_allocation_btree_lookups_total{device="sda2"} 0
# HELP node_xfs_allocation_btree_records_deleted_total Number of allocation B-tree records deleted for a filesystem.
# TYPE node_xfs_allocation_btree_records_deleted_total counter
node_xfs_allocation_btree_records_deleted_total{device="dm-0"} 0
node_xfs_allocation_btree_records_deleted_total{device="dm-1"} 0
node_xfs_allocation_btree_records_deleted_total{device="sda2"} 0
# HELP node_xfs_allocation_btree_records_inserted_total Number of allocation B-tree records inserted for a filesystem.
# TYPE node_xfs_allocation_btree_records_inserted_total counter
node_xfs_allocation_btree_records_inserted_total{device="dm-0"} 0
node_xfs_allocation_btree_records_inserted_total{device="dm-1"} 0
node_xfs_allocation_btree_records_inserted_total{device="sda2"} 0
# HELP node_xfs_block_map_btree_compares_total Number of block map B-tree compares for a filesystem.
# TYPE node_xfs_block_map_btree_compares_total counter
node_xfs_block_map_btree_compares_total{device="dm-0"} 0
node_xfs_block_map_btree_compares_total{device="dm-1"} 0
node_xfs_block_map_btree_compares_total{device="sda2"} 0
# HELP node_xfs_block_map_btree_lookups_total Number of block map B-tree lookups for a filesystem.
# TYPE node_xfs_block_map_btree_lookups_total counter
node_xfs_block_map_btree_lookups_total{device="dm-0"} 0
node_xfs_block_map_btree_lookups_total{device="dm-1"} 0
node_xfs_block_map_btree_lookups_total{device="sda2"} 0
# HELP node_xfs_block_map_btree_records_deleted_total Number of block map B-tree records deleted for a filesystem.
# TYPE node_xfs_block_map_btree_records_deleted_total counter
node_xfs_block_map_btree_records_deleted_total{device="dm-0"} 0
node_xfs_block_map_btree_records_deleted_total{device="dm-1"} 0
node_xfs_block_map_btree_records_deleted_total{device="sda2"} 0
# HELP node_xfs_block_map_btree_records_inserted_total Number of block map B-tree records inserted for a filesystem.
# TYPE node_xfs_block_map_btree_records_inserted_total counter
node_xfs_block_map_btree_records_inserted_total{device="dm-0"} 0
node_xfs_block_map_btree_records_inserted_total{device="dm-1"} 0
node_xfs_block_map_btree_records_inserted_total{device="sda2"} 0
# HELP node_xfs_block_mapping_extent_list_compares_total Number of extent list compares for a filesystem.
# TYPE node_xfs_block_mapping_extent_list_compares_total counter
node_xfs_block_mapping_extent_list_compares_total{device="dm-0"} 0
node_xfs_block_mapping_extent_list_compares_total{device="dm-1"} 0
node_xfs_block_mapping_extent_list_compares_total{device="sda2"} 0
# HELP node_xfs_block_mapping_extent_list_deletions_total Number of extent list deletions for a filesystem.
# TYPE node_xfs_block_mapping_extent_list_deletions_total counter
node_xfs_block_mapping_extent_list_deletions_total{device="dm-0"} 3386
node_xfs_block_mapping_extent_list_deletions_total{device="dm-1"} 297
node_xfs_block_mapping_extent_list_deletions_total{device="sda2"} 1
# HELP node_xfs_block_mapping_extent_list_insertions_total Number of extent list insertions for a filesystem.
# TYPE node_xfs_block_mapping_extent_list_insertions_total counter
node_xfs_block_mapping_extent_list_insertions_total{device="dm-0"} 78215
node_xfs_block_mapping_extent_list_insertions_total{device="dm-1"} 506
node_xfs_block_mapping_extent_list_insertions_total{device="sda2"} 8
# HELP node_xfs_block_mapping_extent_list_lookups_total Number of extent list lookups for a filesystem.
# TYPE node_xfs_block_mapping_extent_list_lookups_total counter
node_xfs_block_mapping_extent_list_lookups_total{device="dm-0"} 1.459605e+06
node_xfs_block_mapping_extent_list_lookups_total{device="dm-1"} 44986
node_xfs_block_mapping_extent_list_lookups_total{device="sda2"} 318
# HELP node_xfs_block_mapping_reads_total Number of block map for read operations for a filesystem.
# TYPE node_xfs_block_mapping_reads_total counter
node_xfs_block_mapping_reads_total{device="dm-0"} 968957
node_xfs_block_mapping_reads_total{device="dm-1"} 582
node_xfs_block_mapping_reads_total{device="sda2"} 52
# HELP node_xfs_block_mapping_unmaps_total Number of block unmaps (deletes) for a filesystem.
# TYPE node_xfs_block_mapping_unmaps_total counter
node_xfs_block_mapping_unmaps_total{device="dm-0"} 40725
node_xfs_block_mapping_unmaps_total{device="dm-1"} 523
node_xfs_block_mapping_unmaps_total{device="sda2"} 1
# HELP node_xfs_block_mapping_writes_total Number of block map for write operations for a filesystem.
# TYPE node_xfs_block_mapping_writes_total counter
node_xfs_block_mapping_writes_total{device="dm-0"} 360642
node_xfs_block_mapping_writes_total{device="dm-1"} 42963
node_xfs_block_mapping_writes_total{device="sda2"} 254
# HELP node_xfs_directory_operation_create_total Number of times a new directory entry was created for a filesystem.
# TYPE node_xfs_directory_operation_create_total counter
node_xfs_directory_operation_create_total{device="dm-0"} 80409
node_xfs_directory_operation_create_total{device="dm-1"} 900
node_xfs_directory_operation_create_total{device="sda2"} 1
# HELP node_xfs_directory_operation_getdents_total Number of times the directory getdents operation was performed for a filesystem.
# TYPE node_xfs_directory_operation_getdents_total counter
node_xfs_directory_operation_getdents_total{device="dm-0"} 43714
node_xfs_directory_operation_getdents_total{device="dm-1"} 2080
node_xfs_directory_operation_getdents_total{device="sda2"} 16
# HELP node_xfs_directory_operation_lookup_total Number of file name directory lookups which miss the operating systems directory name lookup cache.
# TYPE node_xfs_directory_operation_lookup_total counter
node_xfs_directory_operation_lookup_total{device="dm-0"} 197691
node_xfs_directory_operation_lookup_total{device="dm-1"} 169
node_xfs_directory_operation_lookup_total{device="sda2"} 13
# HELP node_xfs_directory_operation_remove_total Number of times an existing directory entry was created for a filesystem.
# TYPE node_xfs_directory_operation_remove_total counter
node_xfs_directory_operation_remove_total{device="dm-0"} 38477
node_xfs_directory_operation_remove_total{device="dm-1"} 846
node_xfs_directory_operation_remove_total{device="sda2"} 0
# HELP node_xfs_extent_allocation_blocks_allocated_total Number of blocks allocated for a filesystem.
# TYPE node_xfs_extent_allocation_blocks_allocated_total counter
node_xfs_extent_allocation_blocks_allocated_total{device="dm-0"} 1.076959e+06
node_xfs_extent_allocation_blocks_allocated_total{device="dm-1"} 1151
node_xfs_extent_allocation_blocks_allocated_total{device="sda2"} 8176
# HELP node_xfs_extent_allocation_blocks_freed_total Number of blocks freed for a filesystem.
# TYPE node_xfs_extent_allocation_blocks_freed_total counter
node_xfs_extent_allocation_blocks_freed_total{device="dm-0"} 142750
node_xfs_extent_allocation_blocks_freed_total{device="dm-1"} 648
node_xfs_extent_allocation_blocks_freed_total{device="sda2"} 407
# HELP node_xfs_extent_allocation_extents_allocated_total Number of extents allocated for a filesystem.
# TYPE node_xfs_extent_allocation_extents_allocated_total counter
node_xfs_extent_allocation_extents_allocated_total{device="dm-0"} 40430
node_xfs_extent_allocation_extents_allocated_total{device="dm-1"} 224
node_xfs_extent_allocation_extents_allocated_total{device="sda2"} 3
# HELP node_xfs_extent_allocation_extents_freed_total Number of extents freed for a filesystem.
# TYPE node_xfs_extent_allocation_extents_freed_total counter
node_xfs_extent_allocation_extents_freed_total{device="dm-0"} 1780
node_xfs_extent_allocation_extents_freed_total{device="dm-1"} 85
node_xfs_extent_allocation_extents_freed_total{device="sda2"} 1
# HELP node_xfs_inode_operation_attempts_total Number of times the OS looked for an XFS inode in the inode cache.
# TYPE node_xfs_inode_operation_attempts_total counter
node_xfs_inode_operation_attempts_total{device="dm-0"} 138477
node_xfs_inode_operation_attempts_total{device="dm-1"} 949
node_xfs_inode_operation_attempts_total{device="sda2"} 15
# HELP node_xfs_inode_operation_attribute_changes_total Number of times the OS explicitly changed the attributes of an XFS inode.
# TYPE node_xfs_inode_operation_attribute_changes_total counter
node_xfs_inode_operation_attribute_changes_total{device="dm-0"} 126466
node_xfs_inode_operation_attribute_changes_total{device="dm-1"} 680
node_xfs_inode_operation_attribute_changes_total{device="sda2"} 0
# HELP node_xfs_inode_operation_duplicates_total Number of times the OS tried to add a missing XFS inode to the inode cache, but found it had already been added by another process.
# TYPE node_xfs_inode_operation_duplicates_total counter
node_xfs_inode_operation_duplicates_total{device="dm-0"} 0
node_xfs_inode_operation_duplicates_total{device="dm-1"} 0
node_xfs_inode_operation_duplicates_total{device="sda2"} 0
# HELP node_xfs_inode_operation_found_total Number of times the OS looked for and found an XFS inode in the inode cache.
# TYPE node_xfs_inode_operation_found_total counter
node_xfs_inode_operation_found_total{device="dm-0"} 33368
node_xfs_inode_operation_found_total{device="dm-1"} 811
node_xfs_inode_operation_found_total{device="sda2"} 0
# HELP node_xfs_inode_operation_missed_total Number of times the OS looked for an XFS inode in the cache, but did not find it.
# TYPE node_xfs_inode_operation_missed_total counter
node_xfs_inode_operation_missed_total{device="dm-0"} 105109
node_xfs_inode_operation_missed_total{device="dm-1"} 138
node_xfs_inode_operation_missed_total{device="sda2"} 15
# HELP node_xfs_inode_operation_reclaims_total Number of times the OS reclaimed an XFS inode from the inode cache to free memory for another purpose.
# TYPE node_xfs_inode_operation_reclaims_total counter
node_xfs_inode_operation_reclaims_total{device="dm-0"} 79927
node_xfs_inode_operation_reclaims_total{device="dm-1"} 70
node_xfs_inode_operation_reclaims_total{device="sda2"} 8
# HELP node_xfs_inode_operation_recycled_total Number of times the OS found an XFS inode in the cache, but could not use it as it was being recycled.
# TYPE node_xfs_inode_operation_recycled_total counter
node_xfs_inode_operation_recycled_total{device="dm-0"} 0
node_xfs_inode_operation_recycled_total{device="dm-1"} 0
node_xfs_inode_operation_recycled_total{device="sda2"} 0
# HELP node_xfs_read_calls_total Number of read(2) system calls made to files in a filesystem.
# TYPE node_xfs_read_calls_total counter
node_xfs_read_calls_total{device="dm-0"} 3.268559e+06
node_xfs_read_calls_total{device="dm-1"} 811
node_xfs_read_calls_total{device="sda2"} 4
# HELP node_xfs_vnode_active_total Number of vnodes not on free lists for a filesystem.
# TYPE node_xfs_vnode_active_total counter
node_xfs_vnode_active_total{device="dm-0"} 25182
node_xfs_vnode_active_total{device="dm-1"} 68
node_xfs_vnode_active_total{device="sda2"} 7
# HELP node_xfs_vnode_allocate_total Number of times vn_alloc called for a filesystem.
# TYPE node_xfs_vnode_allocate_total counter
node_xfs_vnode_allocate_total{device="dm-0"} 0
node_xfs_vnode_allocate_total{device="dm-1"} 0
node_xfs_vnode_allocate_total{device="sda2"} 0
# HELP node_xfs_vnode_get_total Number of times vn_get called for a filesystem.
# TYPE node_xfs_vnode_get_total counter
node_xfs_vnode_get_total{device="dm-0"} 0
node_xfs_vnode_get_total{device="dm-1"} 0
node_xfs_vnode_get_total{device="sda2"} 0
# HELP node_xfs_vnode_hold_total Number of times vn_hold called for a filesystem.
# TYPE node_xfs_vnode_hold_total counter
node_xfs_vnode_hold_total{device="dm-0"} 0
node_xfs_vnode_hold_total{device="dm-1"} 0
node_xfs_vnode_hold_total{device="sda2"} 0
# HELP node_xfs_vnode_reclaim_total Number of times vn_reclaim called for a filesystem.
# TYPE node_xfs_vnode_reclaim_total counter
node_xfs_vnode_reclaim_total{device="dm-0"} 82056
node_xfs_vnode_reclaim_total{device="dm-1"} 885
node_xfs_vnode_reclaim_total{device="sda2"} 8
# HELP node_xfs_vnode_release_total Number of times vn_rele called for a filesystem.
# TYPE node_xfs_vnode_release_total counter
node_xfs_vnode_release_total{device="dm-0"} 82056
node_xfs_vnode_release_total{device="dm-1"} 885
node_xfs_vnode_release_total{device="sda2"} 8
# HELP node_xfs_vnode_remove_total Number of times vn_remove called for a filesystem.
# TYPE node_xfs_vnode_remove_total counter
node_xfs_vnode_remove_total{device="dm-0"} 82056
node_xfs_vnode_remove_total{device="dm-1"} 885
node_xfs_vnode_remove_total{device="sda2"} 8
# HELP node_xfs_write_calls_total Number of write(2) system calls made to files in a filesystem.
# TYPE node_xfs_write_calls_total counter
node_xfs_write_calls_total{device="dm-0"} 265740
node_xfs_write_calls_total{device="dm-1"} 42590
node_xfs_write_calls_total{device="sda2"} 243
# HELP process_cpu_seconds_total Total user and system CPU time spent in seconds.
# TYPE process_cpu_seconds_total counter
process_cpu_seconds_total 0
# HELP process_max_fds Maximum number of open file descriptors.
# TYPE process_max_fds gauge
process_max_fds 262144
# HELP process_open_fds Number of open file descriptors.
# TYPE process_open_fds gauge
process_open_fds 9
# HELP process_resident_memory_bytes Resident memory size in bytes.
# TYPE process_resident_memory_bytes gauge
process_resident_memory_bytes 1.2234752e+07
# HELP process_start_time_seconds Start time of the process since unix epoch in seconds.
# TYPE process_start_time_seconds gauge
process_start_time_seconds 1.67608494413e+09
# HELP process_virtual_memory_bytes Virtual memory size in bytes.
# TYPE process_virtual_memory_bytes gauge
process_virtual_memory_bytes 7.42846464e+08
# HELP process_virtual_memory_max_bytes Maximum amount of virtual memory available in bytes.
# TYPE process_virtual_memory_max_bytes gauge
process_virtual_memory_max_bytes 1.8446744073709552e+19
# HELP promhttp_metric_handler_errors_total Total number of internal errors encountered by the promhttp metric handler.
# TYPE promhttp_metric_handler_errors_total counter
promhttp_metric_handler_errors_total{cause="encoding"} 0
promhttp_metric_handler_errors_total{cause="gathering"} 0
# HELP promhttp_metric_handler_requests_in_flight Current number of scrapes being served.
# TYPE promhttp_metric_handler_requests_in_flight gauge
promhttp_metric_handler_requests_in_flight 1
# HELP promhttp_metric_handler_requests_total Total number of scrapes by HTTP status code.
# TYPE promhttp_metric_handler_requests_total counter
promhttp_metric_handler_requests_total{code="200"} 0
promhttp_metric_handler_requests_total{code="500"} 0
promhttp_metric_handler_requests_total{code="503"} 0
③ エクスポーターをサービス化して常駐させる
- (本手順外)SElinux無効化を先に実施しています
- サービス化のためのユニットファイルを作成する
- ノードエクスポーターの場合、プロセス起動時に以下を指定し特定のコレクタのみに指定(★重要)
-
--collector.disable-defaultsでエクスポーターのデフォルトでたくさんセットされているコレクタ(メトリック群)を一旦すべて無効化 -
---collector.XXXXXでエクスポーターで必要なコレクタグループのみ出力する- 参考:https://github.com/prometheus/node_exporter
- HELPでも確認できます
./node_exporter -h
- OCIモニタリング+Cloud Agentでは拾うことができない「filesystem」のみにフィルタ
-
[Unit]
Description=Prometheus Node Exporter for OCI Monitoring

[Service]
Type=simple
ExecStart=/etc/prometheus/nodeExporter/node_exporter --collector.disable-defaults --collector.filesystem
ExecStop=/bin/kill -s HUP ${MAINPID}
Restart=always
TimeoutStopSec=5s

[Install]
WantedBy=multi-user.target
- プロセスエクスポーターの場合、ここでNginxプロセスのみ
[Unit]
Description=Promethe Process Exporter for OCI Monitoring

[Service]
Type=simple
ExecStart=/etc/prometheus/processExporter/process-exporter -procnames nginx
ExecStop=/bin/kill -s HUP ${MAINPID}
Restart=always
TimeoutStopSec=5s

[Install]
WantedBy=multi-user.target
- 自動起動を有効化
[opc@ol8-prome ~]$ sudo systemctl enable prometheus-nodeExporter.service
Created symlink /etc/systemd/system/multi-user.target.wants/prometheus_node_exporter.service → /etc/systemd/system/prometheus_node_exporter.service.

[opc@ol8-prome ~]$ sudo systemctl enable prometheus-procExporter.service
Created symlink /etc/systemd/system/multi-user.target.wants/prometheus_process_exporter.service → /etc/systemd/system/prometheus_process_exporter.service.

[opc@ol8-prome ~]$ sudo reboot
- ここまでの手順でSELinux有効化や、テスト実行しているプロセスもあるので一旦再起動
④ 管理エージェントからエクスポーターを統合(CUI)
-
以下を設定してpropatiesファイルを2つ作成する
- url:必須:
http://localhost:9100/metricsを記載 - namespace:必須:OCIモニタリングのカスタムメトリックのネームスペース名を任意に記載
- compartmentId:必須:OCIモニタリング、メトリック出力先のコンパートメントを指定
- allowMetrics:任意だがほぼ必須で設定する事。アスタリスク * 指定ですべてのメトリックをアップロード。デフォルトが大量なのでフィルタする。
- メトリック名についてはOS内で
curl https://localhost:9100 |grep XXXXなどで、実際のメトリック値を確認します。- node_filesystem_size_bytes ・・・ファイルシステムのサイズ(Bytes)
- node_filesystem_avail_bytes・・・空サイズ(Bytes)
- namedprocess_namegroup_num_procs・・・プロセス数
- namedprocess_namegroup_num_threads・・・プロセスのスレッド数
- メトリック名についてはOS内で
- proxyUrl:任意:プロキシサーバ経由の場合は指定
- metricDimensions:任意:OCIモニタリングのカスタムメトリックのディメンション名を任意に記載
- url:必須:
-
ノードエクスポーター用
url=http://localhost:9100/metrics
namespace=custom_prometheus
compartmentId=ocid1.tenancy.oc1..aaaaaaaaqhcdnsrd2ac7gscc7samplesamplesamplesamplesamplesamplesample
metricDimensions="type":"nodeExporter"
allowMetrics=node_filesystem_size_bytes,node_filesystem_avail_bytes
- プロセスエクスポーター用(ここではネームスペースをノードエクスポーターと意図的に分けた)
url=http://localhost:9256/metrics
namespace=custom_prometheus_proc
compartmentId=ocid1.tenancy.oc1..aaaaaaaaqhcdnsrd2ac7samplesamplesamplesamplesamplesamplesample
metricDimensions="type":"procExporter"
allowMetrics=namedprocess_namegroup_num_procs,namedprocess_namegroup_num_threads
- 管理エージェントを再起動する
[opc@ol8-prome ~]$ sudo systemctl restart oracle-cloud-agent.service

# OCIコンピュート以外の管理エージェントの場合
[root@ol8-prome ~]# systemctl restart mgmt_agent
- 【手順外参考】OCIコンピュート以外のオンプレミス環境などの管理エージェントの場合は
/opt/oracle/mgmt_agent/agent_inst/discovery/PrometheusEmitter/にpropatiesファイルを作成する- 本記事では紹介しないがオンプレミス環境など管理エージェントのインストール以後の手順は以下
④ 管理エージェントからエクスポーターを統合(GUI)
(2024/5/14に追記:2024年2月月頃の更新でGUIからできるようになりました。)
参考ドキュメント:https://docs.oracle.com/ja-jp/iaas/management-agents/doc/management-agents-administration-tasks.html#GUID-8409DD3B-B674-45AB-9B17-B467191FE0CA
- [管理エージェント]-[エージェントとゲートウェイ]-[エージェント] を開きます。
- 対象のエージェントを開き、[Manage DataSources]ボタンを押下
- DataSource Typeには「Prometheus」しかないので、他を入力。基本的にはCUIの設定と同じ。

項目説明
- Name・・・(必須)管理エージェント画面内での識別で利用する名前。記号はアンダースコアのみ記載できる。
- Metric namespace・・・(必須)OCIモニタリングにカスタムメトリックとしてアップロードする際、モニタリングのメトリック・ネームスペースとなる。こちらも記号はアンダースコアのみ。
- URL・・・(必須)Prometheus Exporter のURLを記入
- Custom metric dimensions・・・(option)OCIモニタリングにカスタムメトリックとしてアップロードする際、ディメンションとして、所定メトリック名を更にフィルタする場合に利用するタグのようなもの。デフォルトでもホスト名や、メトリックに合わせて自動付与されるが、別途付与できる。空でも構わない。
- Optional propaties・・・(option)オプションだが特に「allowMetrics」はデフォルトの「*」ではなく、所定のメトリックのみをカスタムメトリックとしてアップロードするように記載しておくこと。
- allowMetrics・・・ここで指定したメトリック単位のみOCIカスタムメトリックにアップロードを行う。メトリックをカンマ区切りで記載する。メトリック名についてはOS内で
curl https://localhost:9100 |grep XXXXなどで、実際のメトリック値を確認します。- node_filesystem_size_bytes ・・・ファイルシステムのサイズ(Bytes)
- node_filesystem_avail_bytes・・・空サイズ(Bytes)
- namedprocess_namegroup_num_procs・・・プロセス数
- namedprocess_namegroup_num_threads・・・プロセスのスレッド数
- resourceGroup・・・OCIモニタリングにカスタムメトリックとしてアップロードする際、所定のグループとして格納できる設定。これはカスタムメトリックのみの設定であり、デフォルトのOCI各種リソースには存在しない設定。
- shceduleMins・・・OCIモニタリングにカスタムメトリックとしてアップロードする間隔(分)
- 他、タイムアウトやプロキシがあればそのURLなど。
- allowMetrics・・・ここで指定したメトリック単位のみOCIカスタムメトリックにアップロードを行う。メトリックをカンマ区切りで記載する。メトリック名についてはOS内で
以下はNodeExporterの設定例。


以下はProcExporterの設定例。オプションのみ。

⑤ OCIモニタリングでエクスポーターからPutされたメトリックを確認
ノードエクスポーターの確認
-
OCIにログインし、メトリック・エクスプローラ を開く
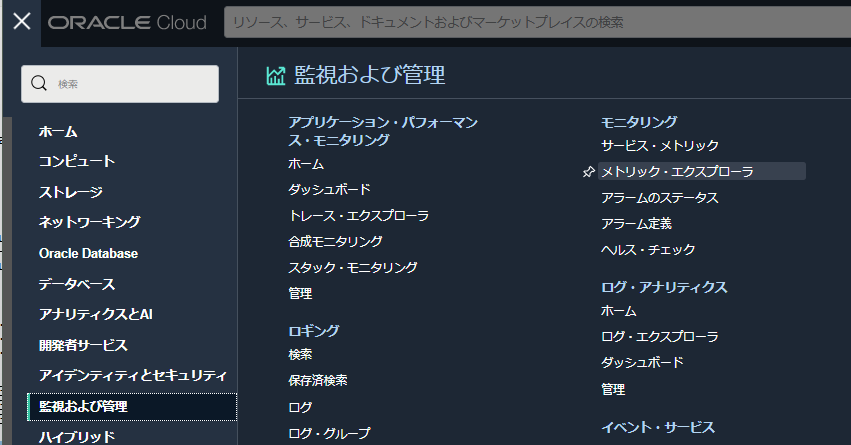
-
ネームスペースに手順 ③ で設定した
custom_prometheusがあることが分かる -
ここではメトリック
node_filesystem_free_bytes(空き容量) を確認
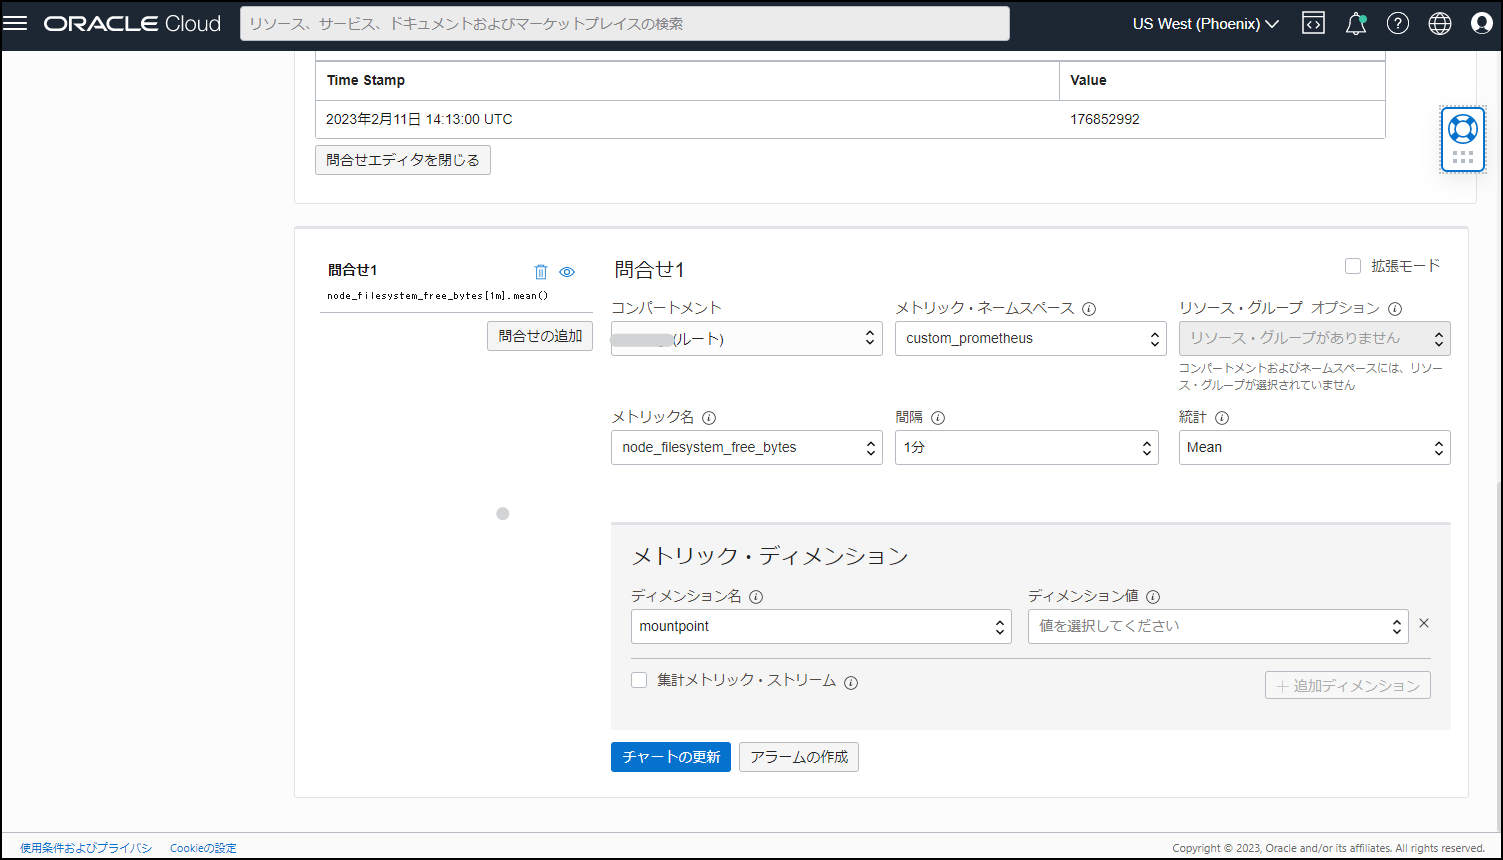
- ファイルシステム毎の空き容量(Bytes)を確認できた
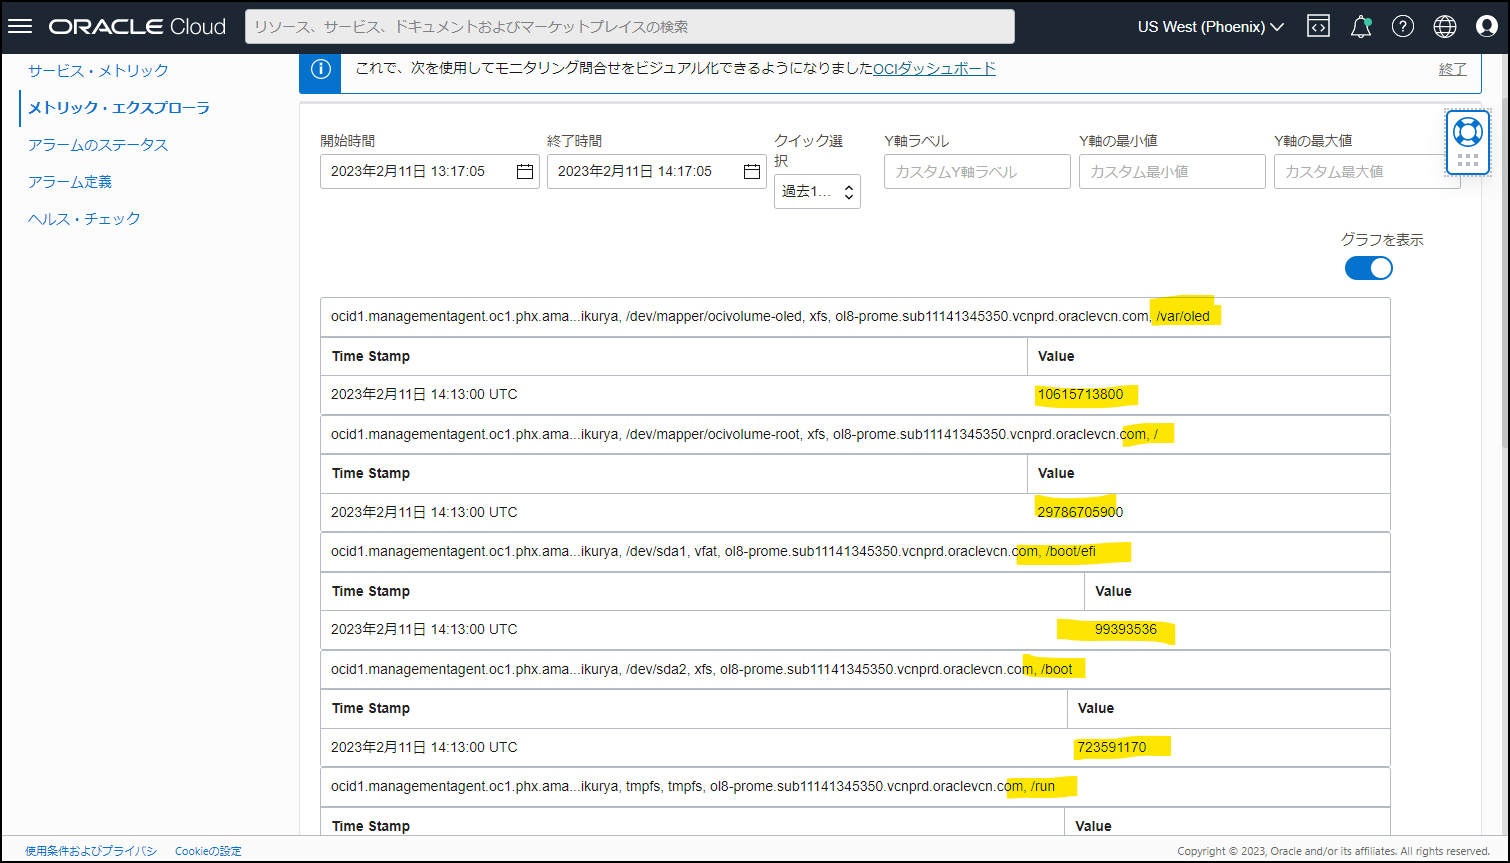
プロセスエクスポーターの確認
-
OCIにログインし、メトリック・エクスプローラ を開く
(省略) -
ネームスペースに手順 ③ で設定した
custom_prometheus_procがあることが分かる -
ここではメトリック
namedprocess_namegroup_num_procs(プロセス数) を確認
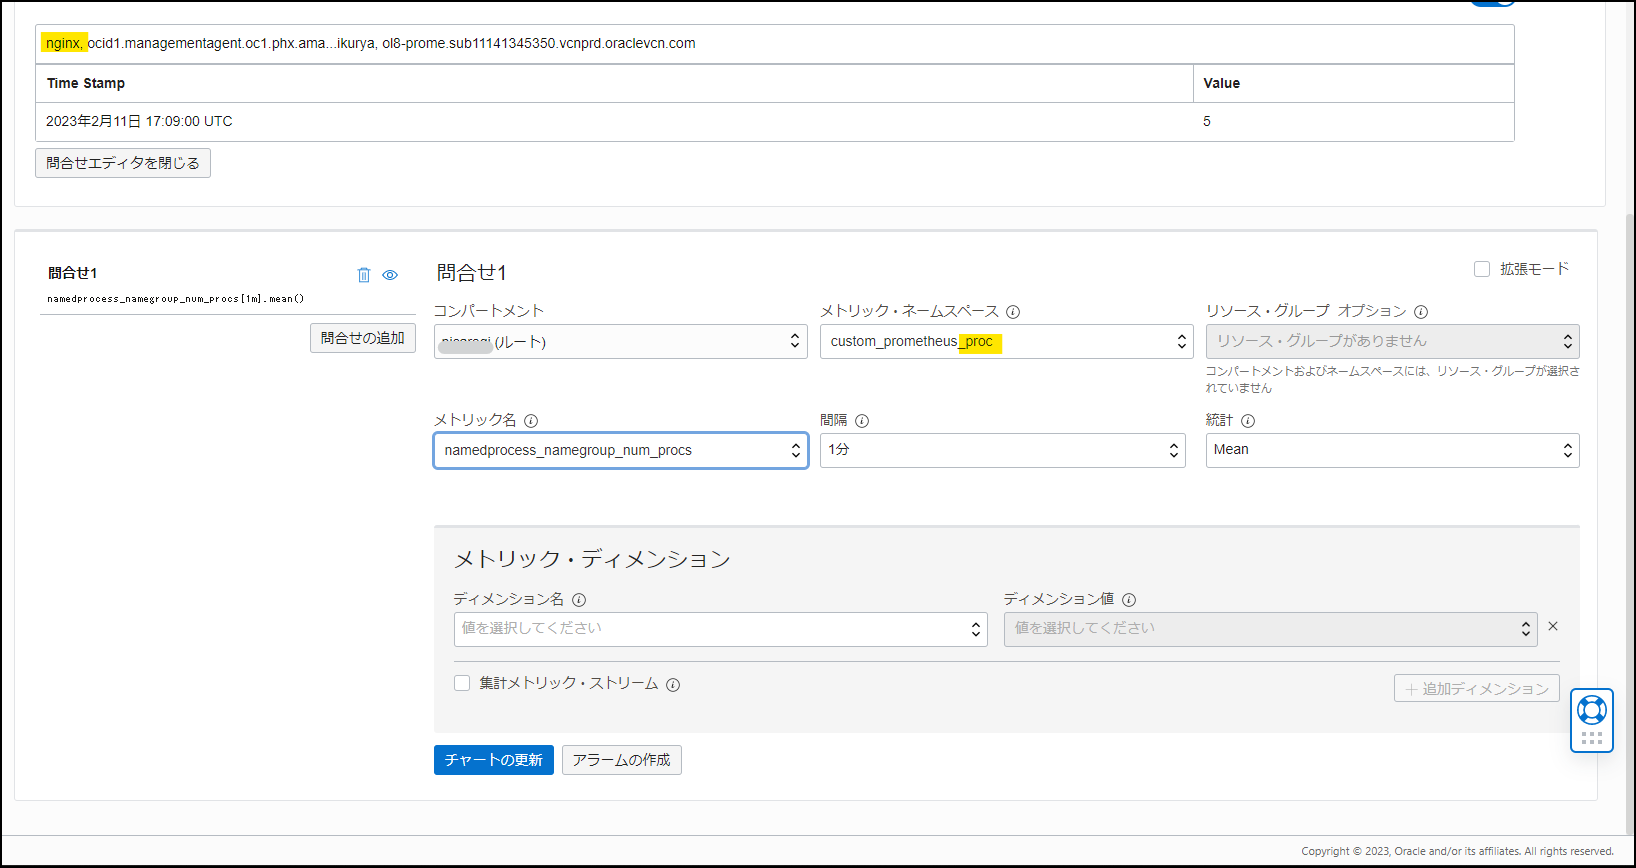
⑥ NginxプロセスをOCIアラームで閾値設定して検知 → メール通知確認
参考:https://docs.oracle.com/ja-jp/iaas/management-agents/doc/set-alarms-oci-monitoring-prometheus.html
- 次のようなアラームを作成し、Nginxを止めたときに通知がくるか確認する
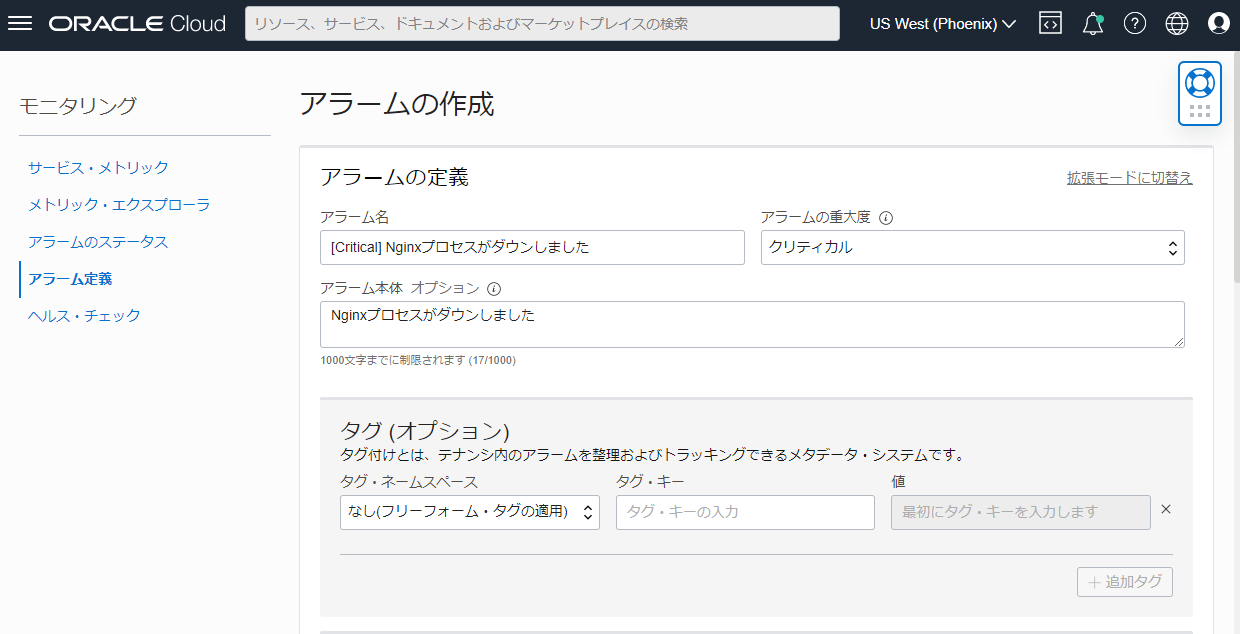
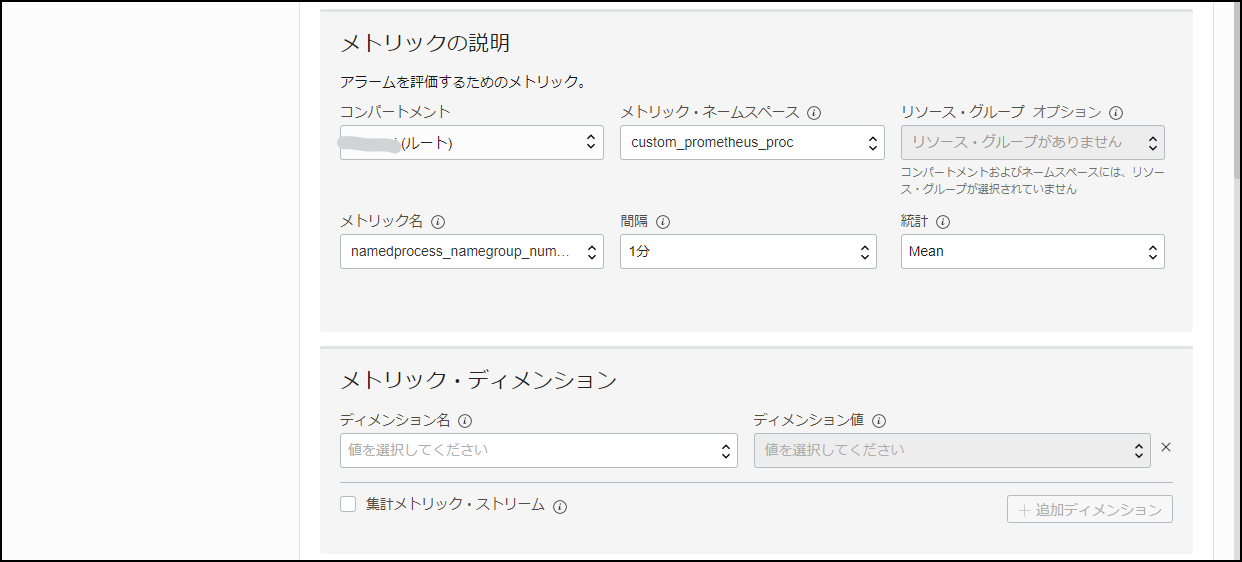
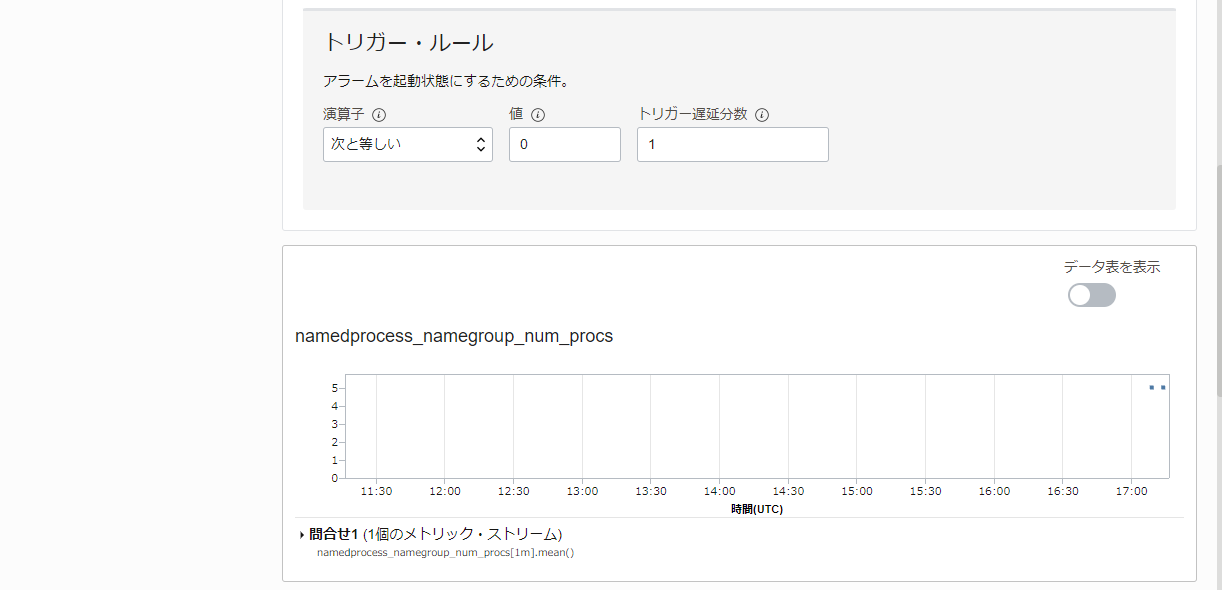
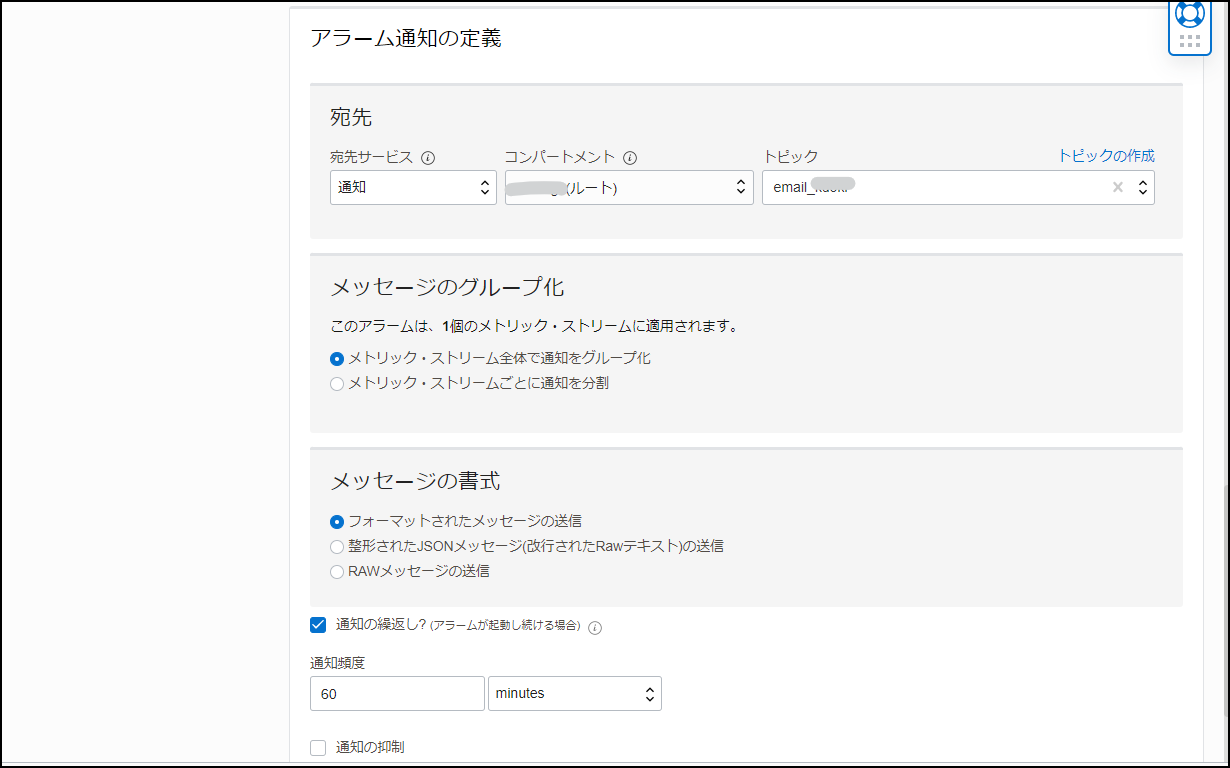
-
正常時(Nginx起動中)
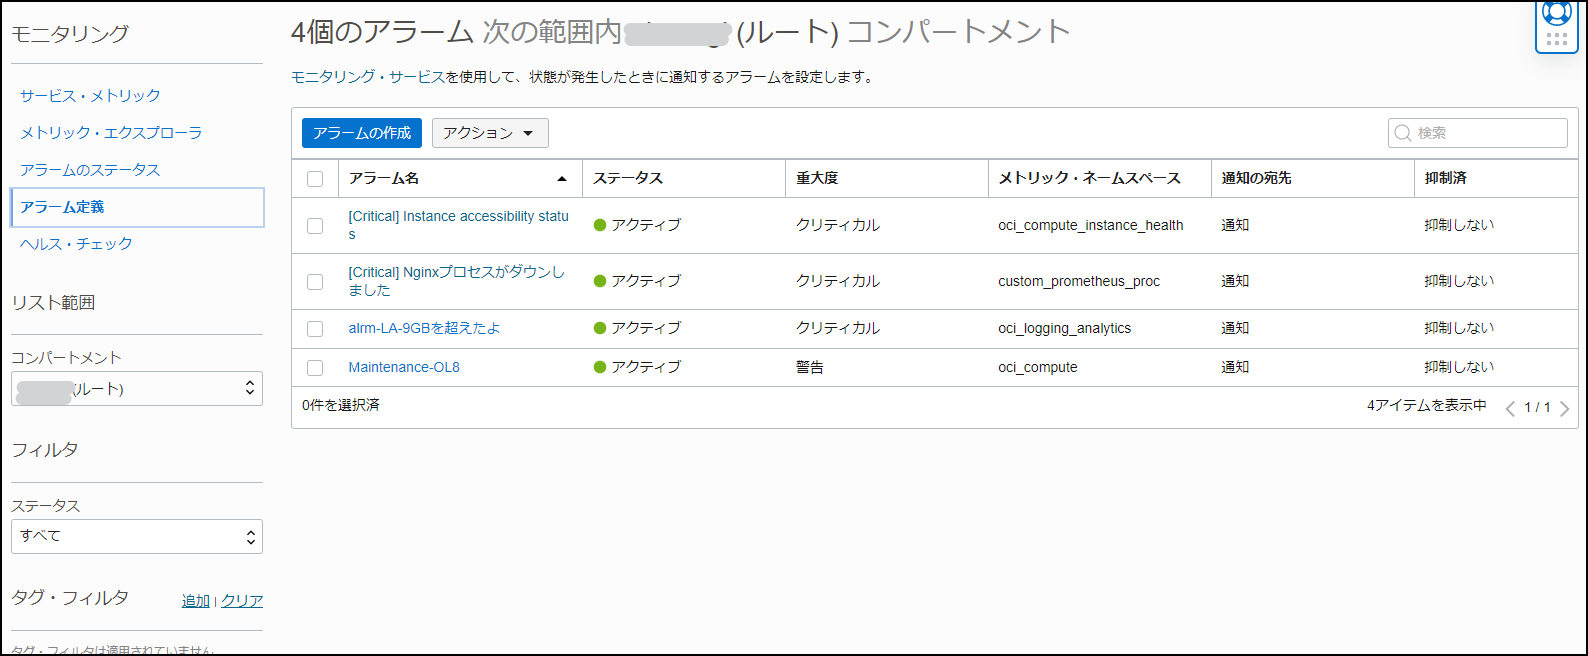
-
異常発生(Nginxをstop)
# いまは起動中
[root@ol8-prome ~]# systemctl status nginx
● nginx.service - The nginx HTTP and reverse proxy server
   Loaded: loaded (/usr/lib/systemd/system/nginx.service; enabled; vendor preset: disabled)
   Active: active (running) since Sun 2023-02-12 01:50:40 JST; 30min ago
  Process: 2033 ExecStart=/usr/sbin/nginx (code=exited, status=0/SUCCESS)
  Process: 1923 ExecStartPre=/usr/sbin/nginx -t (code=exited, status=0/SUCCESS)
  Process: 1911 ExecStartPre=/usr/bin/rm -f /run/nginx.pid (code=exited, status=0/SUCCESS)
 Main PID: 2049 (nginx)
    Tasks: 5 (limit: 10273)
   Memory: 6.4M
   CGroup: /system.slice/nginx.service
           ├─2049 nginx: master process /usr/sbin/nginx
           ├─2050 nginx: worker process
           ├─2051 nginx: worker process
           ├─2052 nginx: worker process
           └─2053 nginx: worker process

Feb 12 01:50:40 ol8-prome systemd[1]: Starting The nginx HTTP and reverse proxy server...
Feb 12 01:50:40 ol8-prome nginx[1923]: nginx: the configuration file /etc/nginx/nginx.conf syntax is ok
Feb 12 01:50:40 ol8-prome nginx[1923]: nginx: configuration file /etc/nginx/nginx.conf test is successful
Feb 12 01:50:40 ol8-prome systemd[1]: Started The nginx HTTP and reverse proxy server.

# 停止
[root@ol8-prome ~]# systemctl stop nginx

# 停止タイミング (UTCで 2/11 17:21)
[root@ol8-prome ~]# date
Sun Feb 12 02:21:45 JST 2023
- OCIアラームで検知できた
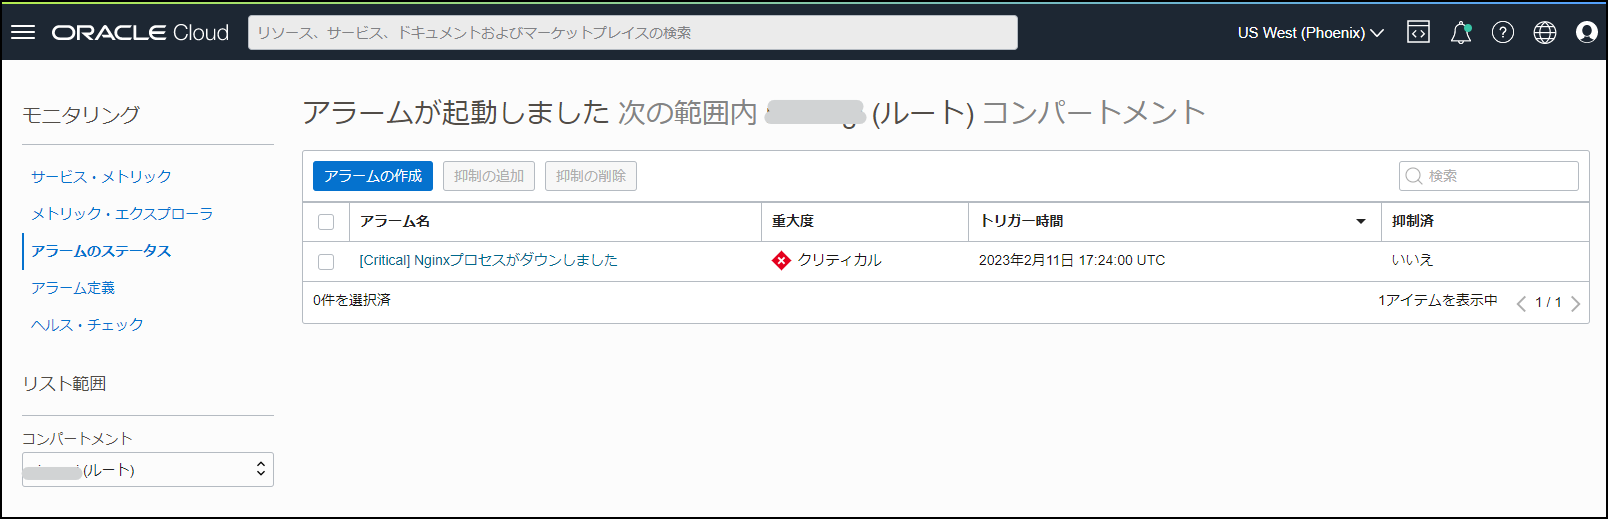
- メールも受信
- UTC 2/11 17:21 にプロセス停止し、17:24に検知、17:27にメール受信 (発生から約6分のラグ)
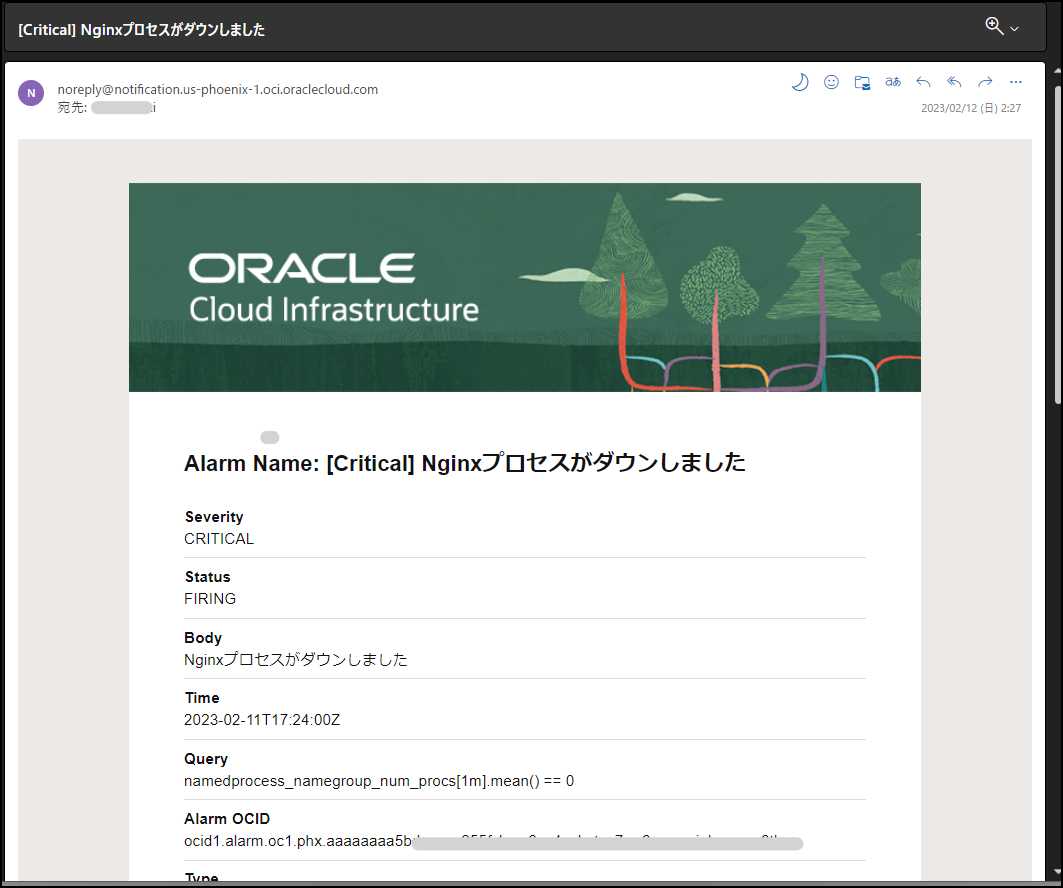
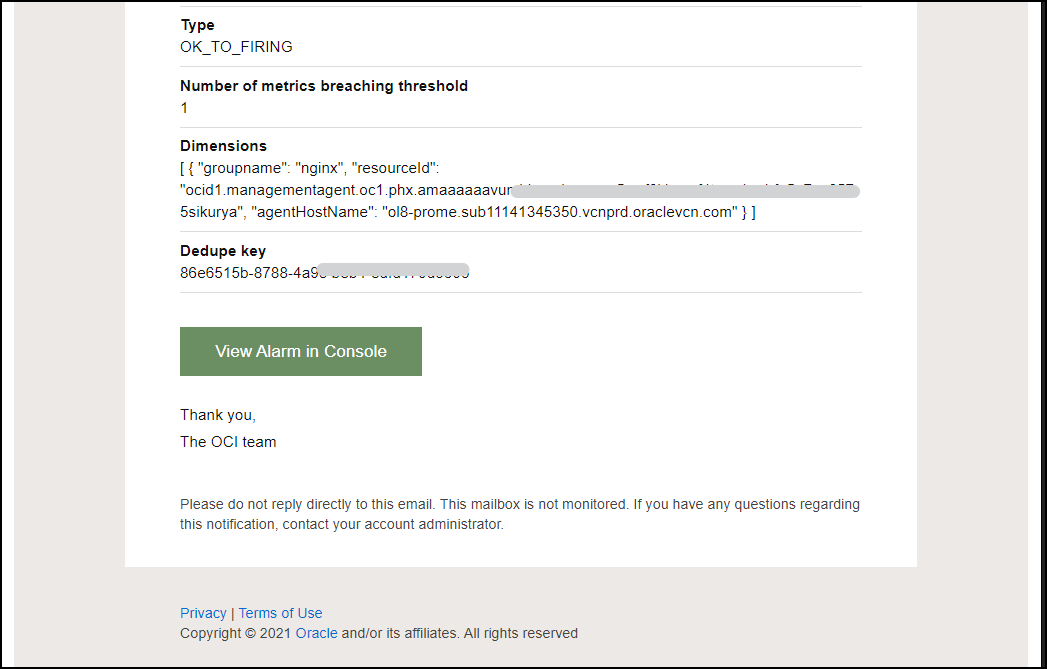
以上
Appendix:TIPS
- OCIモニタリングにPUTするメトリックを限定したい場合、手順④ [allowMetrics=*]を指定することで可能
- メトリック名についてはOS内で
curl https://localhost:9100 |grep XXXXなどで、実際のメトリック値を確認します。- node_filesystem_size_bytes ・・・ファイルシステムのサイズ(Bytes)
- node_filesystem_avail_bytes・・・空サイズ(Bytes)
- メトリック名についてはOS内で
- 本番環境のデプロイではAnsibleで一発設定するようにしよう
- (Cloud-initではできそうにない。管理エージェントの動作として、初回起動時(Cloud init 処理後)に初回だけクラウドから設定ファイルをダウンロードして展開するため、その後に手順④を実施しないといけない。Cloud init で設定してしまうと、設定が上書きされてしまう。
- Prometheus Node Exporterはリアルタイムにメトリックを取得するが、管理エージェントからOCIモニタリングにPUTされるメトリック間隔は5分毎。
Appendix:トラブルシューティング方法
- Cloud Agentの再起動
systemctl restart oracle-cloud-agent
- ログ: mgmt_agent.log
- 以下のログで「PrometheusEmitter」で検索すればエラーしているかどうか確認できる
grep PrometheusEmitter /var/lib/oracle-cloud-agent/plugins/oci-managementagent/polaris/agent_inst/log/mgmt_agent.log
- ログ: mgmt_agent_client.log
- OCI側へアップロードしている際に404エラーが出ている例
# tail -n 20 /var/lib/oracle-cloud-agent/plugins/oci-managementagent/polaris/agent_inst/log/mgmt_agent_client.log

2025-03-18 04:05:23,334 [SendQueue.1 (SenderManager_sender)-34] INFO  - MetricUploadInvocation -->req[LBN24FBXU65ACM646LIVW3SLBT15ARX3]--> POST https://telemetry-ingestion.us-phoenix-1.oraclecloud.com/20180401/metrics [SourceID[id=PrometheusEmitter.prometheus_node_expoter]  2025-03-18 04:03:56]
2025-03-18 04:05:23,352 [SendQueue.0 (SenderManager_sender)-33] INFO  - MetricUploadInvocation <--rsp[USFJM3U0JQ4D3C1UUTMUR79CVADB7BUC/445B9B05E50E87A5FE829077153B3131/C229F7A236FB8A13847958A453F38391,USFJM3U0JQ4D3C1UUTMUR79CVADB7BUC/445B9B05E50E87A5FE829077153B3131/C229F7A236FB8A13847958A453F38391]<-- POST https://telemetry-ingestion.us-phoenix-1.oraclecloud.com/20180401/metrics: [404]
2025-03-18 04:05:23,364 [SendQueue.0 (SenderManager_sender)-33] INFO  - MetricUploadInvocation -->req[PT3FVEQ9GQPRQEEN7OPLH1DFI4LG53LC]--> POST https://telemetry-ingestion.us-phoenix-1.oraclecloud.com/20180401/metrics [SourceID[id=PrometheusEmitter.prometheus_proc_expoter]  2025-03-18 04:04:14]
2025-03-18 04:05:23,379 [SendQueue.1 (SenderManager_sender)-34] INFO  - MetricUploadInvocation <--rsp[LBN24FBXU65ACM646LIVW3SLBT15ARX3/4F5267847C4C59C14AAEA94E81540D9B/E79AD5324762958E20CB868CD8F16ACC,LBN24FBXU65ACM646LIVW3SLBT15ARX3/4F5267847C4C59C14AAEA94E81540D9B/E79AD5324762958E20CB868CD8F16ACC]<-- POST https://telemetry-ingestion.us-phoenix-1.oraclecloud.com/20180401/metrics: [404]
2025-03-18 04:05:23,384 [SendQueue.0 (SenderManager_sender)-33] INFO  - MetricUploadInvocation <--rsp[PT3FVEQ9GQPRQEEN7OPLH1DFI4LG53LC/B9656AE7E24261F115591FF16F3A23F3/23951551A907A53B4291016150551731,PT3FVEQ9GQPRQEEN7OPLH1DFI4LG53LC/B9656AE7E24261F115591FF16F3A23F3/23951551A907A53B4291016150551731]<-- POST https://telemetry-ingestion.us-phoenix-1.oraclecloud.com/20180401/metrics: [404]
2025-03-18 04:05:23,394 [SendQueue.2 (SenderManager_sender)-35] INFO  - MetricUploadInvocation <--rsp[PT1E3BI290B0RYTKOUSPD3L2YTO66B5G/C2775C8814A0A9BCD62B9C5CED62F9B9/E6DF21243D31548B070A93665591A3C4,PT1E3BI290B0RYTKOUSPD3L2YTO66B5G/C2775C8814A0A9BCD62B9C5CED62F9B9/E6DF21243D31548B070A93665591A3C4]<-- POST https://telemetry-ingestion.us-phoenix-1.oraclecloud.com/20180401/metrics: [404]
2025-03-18 04:05:23,399 [SendQueue.2 (SenderManager_sender)-35] INFO  - MetricUploadInvocation -->req[Y3ND64HFSAR208XIMDTFBGNMGIXM6ALB]--> POST https://telemetry-ingestion.us-phoenix-1.oraclecloud.com/20180401/metrics [SourceID[id=agent.ocid1.managementagent.oc1.phx.amaaaaaavun44myauc52ewy6wmc2nokjse65zve72gw2hss4vv7v2cwszqaa] serviceHealth 2025-03-18 04:04:40]
2025-03-18 04:05:23,902 [SendQueue.1 (SenderManager_sender)-34] INFO  - MetricUploadInvocation -->req[LBN24FBX5JKP2558BLTP4U1S26UHS358]--> POST https://telemetry-ingestion.us-phoenix-1.oraclecloud.com/20180401/metrics [SourceID[id=PrometheusEmitter.prometheus_node_expoter]  2025-03-18 04:03:56]
2025-03-18 04:05:23,908 [SendQueue.0 (SenderManager_sender)-33] INFO  - MetricUploadInvocation -->req[PT3FVEQ91KN0FYTB5BF4ICL2UHXBFV2B]--> POST https://telemetry-ingestion.us-phoenix-1.oraclecloud.com/20180401/metrics [SourceID[id=PrometheusEmitter.prometheus_proc_expoter]  2025-03-18 04:04:14]
2025-03-18 04:05:23,924 [SendQueue.1 (SenderManager_sender)-34] INFO  - MetricUploadInvocation <--rsp[LBN24FBX5JKP2558BLTP4U1S26UHS358/DCEB7DBED4FA71A6EBB7060B67A36313/AB2B6621875AA58A6E7B971E86343ACB,LBN24FBX5JKP2558BLTP4U1S26UHS358/DCEB7DBED4FA71A6EBB7060B67A36313/AB2B6621875AA58A6E7B971E86343ACB]<-- POST https://telemetry-ingestion.us-phoenix-1.oraclecloud.com/20180401/metrics: [404]
2025-03-18 04:05:23,936 [SendQueue.0 (SenderManager_sender)-33] INFO  - MetricUploadInvocation <--rsp[PT3FVEQ91KN0FYTB5BF4ICL2UHXBFV2B/433CDBF2B617090926454A6F49ED1857/ADE9B72A31D96BA1C81862E79EB6D7F7,PT3FVEQ91KN0FYTB5BF4ICL2UHXBFV2B/433CDBF2B617090926454A6F49ED1857/ADE9B72A31D96BA1C81862E79EB6D7F7]<-- POST https://telemetry-ingestion.us-phoenix-1.oraclecloud.com/20180401/metrics: [404]
2025-03-18 04:05:24,139 [SendQueue.2 (SenderManager_sender)-35] INFO  - MetricUploadInvocation <--rsp[Y3ND64HFSAR208XIMDTFBGNMGIXM6ALB/44280EB767CD84915CE0C96830743A92/8031B54A1A2C87D1FA5BF6451CB7AD33]<-- POST https://telemetry-ingestion.us-phoenix-1.oraclecloud.com/20180401/metrics: [200]
2025-03-18 04:05:24,148 [SendQueue.2 (SenderManager_sender)-35] INFO  - MetricUploadInvocation -->req[F6P6817PBU7ITALDAOQH98VY3XCGNWWU]--> POST https://telemetry-ingestion.us-phoenix-1.oraclecloud.com/20180401/metrics [SourceID[id=agent.ocid1.managementagent.oc1.phx.amaaaaaavun44myauc52ewy6wmc2nokjse65zve72gw2hss4vv7v2cwszqaa] usage 2025-03-18 04:04:44]
2025-03-18 04:05:24,379 [SendQueue.2 (SenderManager_sender)-35] INFO  - MetricUploadInvocation <--rsp[F6P6817PBU7ITALDAOQH98VY3XCGNWWU/55286AF28B9858519E0379871EE136CA/E1C1BCA31A7090B35773497D36BC0166]<-- POST https://telemetry-ingestion.us-phoenix-1.oraclecloud.com/20180401/metrics: [200]
2025-03-18 04:05:24,384 [SendQueue.2 (SenderManager_sender)-35] INFO  - MetricUploadInvocation -->req[PQKG9P69T6JVL88BYWB3E00DCKIB5V0V]--> POST https://telemetry-ingestion.us-phoenix-1.oraclecloud.com/20180401/metrics [SourceID[id=agent.ocid1.managementagent.oc1.phx.amaaaaaavun44myauc52ewy6wmc2nokjse65zve72gw2hss4vv7v2cwszqaa] agentHealth 2025-03-18 04:04:48]
2025-03-18 04:05:24,437 [SendQueue.1 (SenderManager_sender)-34] INFO  - MetricUploadInvocation -->req[LBN24FBXTSKA63T4NP2EG0YE0T7SDASL]--> POST https://telemetry-ingestion.us-phoenix-1.oraclecloud.com/20180401/metrics [SourceID[id=PrometheusEmitter.prometheus_node_expoter]  2025-03-18 04:03:56]
2025-03-18 04:05:24,450 [SendQueue.0 (SenderManager_sender)-33] INFO  - MetricUploadInvocation -->req[PT3FVEQ90FAWRKU2XULATSLLNA7C7UM3]--> POST https://telemetry-ingestion.us-phoenix-1.oraclecloud.com/20180401/metrics [SourceID[id=PrometheusEmitter.prometheus_proc_expoter]  2025-03-18 04:04:14]
2025-03-18 04:05:24,486 [SendQueue.0 (SenderManager_sender)-33] INFO  - MetricUploadInvocation <--rsp[PT3FVEQ90FAWRKU2XULATSLLNA7C7UM3/9CD97766A7595F8C99208964134739E0/6C546ECAF180962874F23A13DD0AEDC8,PT3FVEQ90FAWRKU2XULATSLLNA7C7UM3/9CD97766A7595F8C99208964134739E0/6C546ECAF180962874F23A13DD0AEDC8]<-- POST https://telemetry-ingestion.us-phoenix-1.oraclecloud.com/20180401/metrics: [404]
2025-03-18 04:05:24,579 [SendQueue.1 (SenderManager_sender)-34] INFO  - MetricUploadInvocation <--rsp[LBN24FBXTSKA63T4NP2EG0YE0T7SDASL/794513CFD17CBE74AFD37E5690A635BE/BDC54D8EA621DEDD9A4AFED61D6D6DB5,LBN24FBXTSKA63T4NP2EG0YE0T7SDASL/794513CFD17CBE74AFD37E5690A635BE/BDC54D8EA621DEDD9A4AFED61D6D6DB5]<-- POST https://telemetry-ingestion.us-phoenix-1.oraclecloud.com/20180401/metrics: [404]
2025-03-18 04:05:25,378 [SendQueue.2 (SenderManager_sender)-35] INFO  - MetricUploadInvocation <--rsp[PQKG9P69T6JVL88BYWB3E00DCKIB5V0V/EB47B0C3B54F95BBED4D24218FDBF45D/440C6788503BE6FB3B45D67A2E33C1DF]<-- POST https://telemetry-ingestion.us-phoenix-1.oraclecloud.com/20180401/metrics: [200]
- GUIで設定すると以下に設定が入る
/var/lib/oracle-cloud-agent/plugins/oci-managementagent/polaris/agent_inst/config/sources/
例:
# ll /var/lib/oracle-cloud-agent/plugins/oci-managementagent/polaris/agent_inst/config/sources/
total 20
-rwxr-x---. 1 oracle-cloud-agent oracle-cloud-agent 139 Mar 17 15:26 OCI.Agent.AgentExtension.1.StackMonitoringMetricReceiver.json
-rw-r--r--. 1 oracle-cloud-agent oracle-cloud-agent 432 Mar 18 03:43 OCI.Agent.PrometheusEmitter.1.prometheus_node_expoter.json
-rwxr-x---. 1 oracle-cloud-agent oracle-cloud-agent 491 Mar 17 16:07 OCI.Agent.PrometheusEmitter.1.prometheus_node_expoter.json.bak
-rw-r--r--. 1 oracle-cloud-agent oracle-cloud-agent 446 Mar 18 03:45 OCI.Agent.PrometheusEmitter.1.prometheus_proc_expoter.json
-rwxr-x---. 1 oracle-cloud-agent oracle-cloud-agent 505 Mar 17 15:42 OCI.Agent.PrometheusEmitter.1.prometheus_proc_expoter.json.bak

# cat /var/lib/oracle-cloud-agent/plugins/oci-managementagent/polaris/agent_inst/config/sources/OCI.Agent.PrometheusEmitter.1.prometheus_proc_expoter.json | jq

{
    "type": "PrometheusEmitter",
    "displayName": null,
    "name": "prometheus_proc_expoter",
    "destination": "OCI",
    "service": "Agent",
    "properties": {
        "compartmentId": "ocid1.compartment.oc1..aaaaaaaa2yafhzfyvt7owczzxfd5wsefk7tdvttgntvkggmcgntnck7obpiq",
        "resourceGroup": "oraclelinux",
        "system": "web",
        "namespace": "custom_prometheus_proc",
        "allowMetrics": "namedprocess_namegroup_num_procs,namedprocess_namegroup_num_threads",
        "scheduleMins": "1",
        "metricDimensions": "env,system",
        "env": "prd",
        "url": "http://localhost:9256/metrics"
    }
}
参考情報
-
[OCI]Set Up Management Agents to Collect Metrics in Prometheus Format
-
[OCI]Blog:OCI Management Agent を使用してクラウドネイティブ環境のパフォーマンス メトリックを収集する
-
[OSS公式]Prometheus Node Exporter
-
[OSSサードパーティー]Process Exportor
-
[OSS公式]NODE EXPORTER を使用した LINUX ホスト メトリックのモニタリング