住んでいる街の中で,最寄駅から遠い場所はどこらへんなのかが気になりました.という訳で色々と調べながら最寄駅までの直線距離の視覚化地図を作ってみることにしました.
問題の定式化
緯度(Latitude)を$y$,経度(Longitude)を$x$,地図上の座標を$r=(y,x)$,考える領域の集合を$A$,考慮する駅の個数を$S$,駅の座標を$s_i=(y_i, x_i),~i\in\{1,\ldots,S\}$とします.また,座標同士$(r_1,r_2)$の距離を$\mathcal D(r_1,r_2)$と表記します.
座標の表現について:今回主に使うライブラリ,geopyやFoliumでは,(緯度, 経度)の順番で座標を記述するのが標準的なようです.なので,座標は$(x,y)$ではなく$(y,x)$と表すことにします.
座標同士の距離について:$\mathcal D$として,geopyのgeodesicを選びました.このメソッドは球面を考慮した(?)直線距離を計算してくれるそうです.
from geopy.distance import geodesic
D = geodesic(r_1, r_2).m
これらを使い,ある地点$r \in A$における最寄駅までの距離$d(r)$を次のように定義します:
d(r) := \min_{i\in \{1,\ldots,S\} } \mathcal D(r,s_i).
となると,領域$A$内で最寄駅までの距離が最も遠い地点は次のように表されますね:
\arg \max_{r \in A} d(r) ~=~ \arg \max_{r \in A} \min_{i\in \{1,\ldots,S\}} \mathcal D(r,s_i).
最寄駅までの距離が最も遠い地点は,ボロノイ図を描くと分かります.ボロノイ図の線の交点のどれかが,最寄駅までの距離が最も遠い地点です.ただ,今回は最も遠い地点(点)というよりは,どこら辺の地域が駅から遠いのかというふわっとした事を知ることをゴールとします.
市のシェイプを描こう
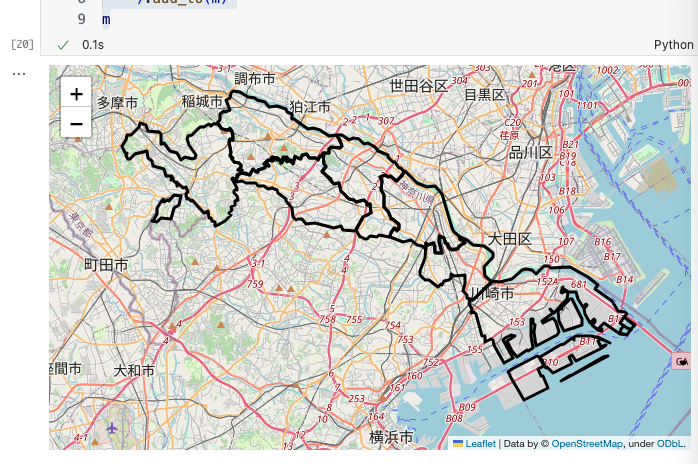
今回は神奈川県川崎市を対象の領域$A$とし,このシェイプを描いていこうと思います.
シェイプデータのダウンロード:国土交通省の国土数値情報ダウンロードサイトから神奈川県のデータをダウンロードします.この中に入っているファイルN03-20240101_14.geojsonに神奈川県内の市や区のシェイプが記述されています.ここから川崎市のシェイプを取り出します.
川崎市のシェイプは区(川崎区,幸区,...)ごとにあることに注意が必要です.また,元データは(経度,緯度)の順番に並んでいるので,これを入れ替えて(緯度,経度)にしておきます.
# 川崎市のシェイプ
with open("./N03-20240101_14.geojson", "r") as file:
    kanagawa_polygons = json.load(file)
kawasaki_shape_data_lonlat = []
for item in kanagawa_polygons["features"]:
    if item["properties"]["N03_004"] == "川崎市":
        kawasaki_shape_data_lonlat.append(item["geometry"]["coordinates"][0])

## 経度,緯度から緯度,経度にする
kawasaki_shape_data = []
for lonlat_list in kawasaki_shape_data_lonlat:
    latlon_list = [(lat,lon) for lon,lat in lonlat_list]
    kawasaki_shape_data.append(latlon_list)
kawasaki_shape_data
[[(35.50000023, 139.70540167),
  (35.5, 139.7054018),
  (35.49952578, 139.70571538),
  (35.49852051, 139.7063765),
...
シェイプを描く:Foliumを使用します.
m = folium.Map(
    location=(35.55, 139.62),
    zoom_start=11
)
for polygon in kawasaki_shape_data:
    folium.Polygon(
        polygon, color="black", fill_color=""
    ).add_to(m)
m
Jupyter Notebookなどで実行すると,地図が表示されます.

備考:ドキュメンテーションについて
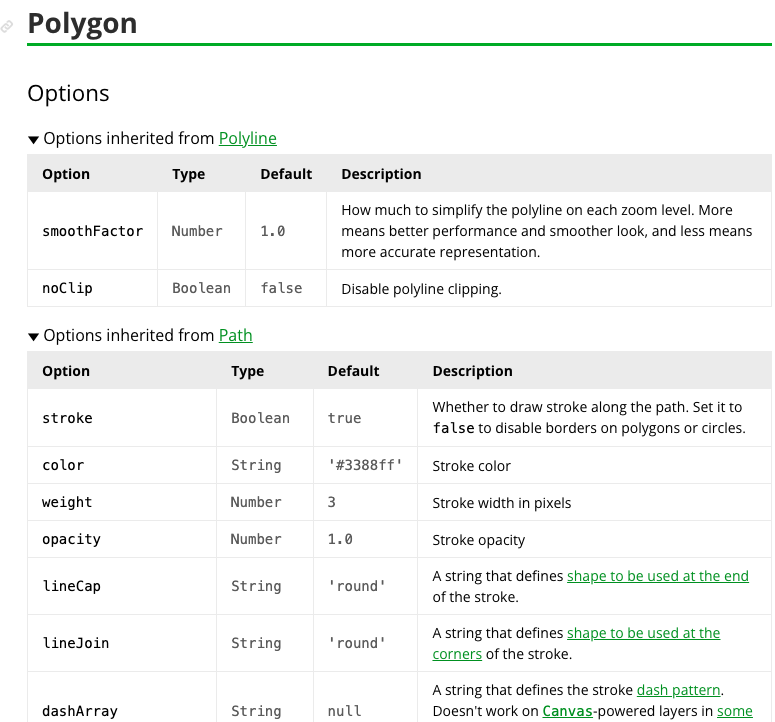
Foliumのドキュメンテーションはちょっとクセがあります.FoliumはJavaScriptの地図ライブラリLeafletのラッパーのような存在で,機能の大半がLeaflet由来のものです.
なので,folium.Polygonのドキュメンテーションには「LeafletのPolygonのドキュメンテーションも見てね」という説明があります.そして,大抵後者の方に欲しい情報があります.
で,そのLeafletにも少しクセがあります.色んなオプション値が別々のクラスから由来しているらしく,Oprions Inherited from ### を片っ端から開いていかないと所望のオプションに辿り着けないことがあります.
駅データ
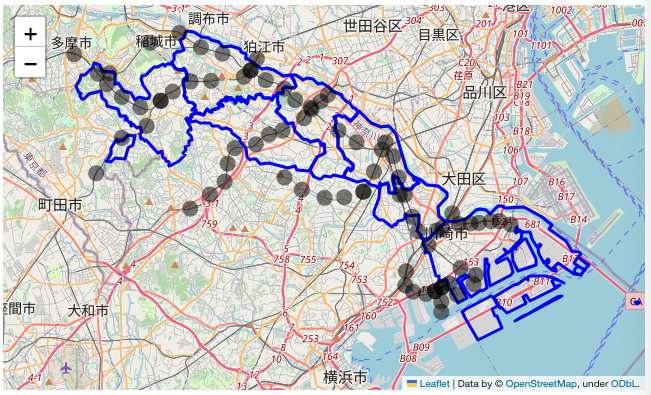
様々なサイトで駅の座標データが公開されています.それらから駅の座標データを取得します.
川崎市内であっても川崎市外にある駅が最寄駅になることもあり得るので,川崎市の周辺にある駅も取得しました.
こんな感じでCSVにまとめます.
Name,Lat,Lon
川崎,35.531328,139.696899
尻手,35.531064,139.684389
矢向,35.538933,139.680422
鹿島田,35.551331,139.675131
平間,35.56104,139.671039
向河原,35.572908,139.667242
それぞれの駅を丸で描きます.
stations = pd.read_csv("./StationLocations.csv")

m = folium.Map(location=(35.55, 139.62), zoom_start=11)

# 川崎市のシェイプ
for polygon in kawasaki_shape_data:
    folium.Polygon(
        polygon, color="blue", fill_color="",
    ).add_to(m)

# 駅を描画
for station in stations.iloc:
    folium.Circle(
        location=[station["Lat"], station["Lon"]],
        radius=500,
        color="",
        fill_color="black",
        fill_opacity=0.5,
        popup=station["Name"],
    ).add_to(m)
m
各点の最寄駅までの距離を測定する
$A$内の各点$r$における$d(r)$を測定します.ここからは領域を有限個のメッシュに分けて,各メッシュ$(j,i)$の中心点と各駅間の距離を考えることにします.
今回は川崎市が収まる矩形内をメッシュに分けることにします.かなり横浜とかも入るけど...
mesh_lat_list = np.linspace(35.4675590919722, 35.6441932982837, num=100)
mesh_lon_list = np.linspace(139.44241944614294, 139.8003619201857, num=100)
dlat = mesh_lat_list[1]-mesh_lat_list[0]
dlat_half = dlat/2
dlon = mesh_lon_list[1]-mesh_lon_list[0]
dlon_half = dlon/2
メッシュ判定メソッド:各駅がどのメッシュに属するのかを判定する際などに使うメソッドを作ります.
def get_latlon_idxs(latlon: Tuple[float,float]) -> Tuple[int, int]:
    lat, lon = latlon
    lat_idx = np.abs(mesh_lat_list - lat).argmin()
    lon_idx = np.abs(mesh_lon_list - lon).argmin()
    return lat_idx, lon_idx
捜索範囲判定メソッド:計算効率のため,各駅は,その駅を中心とした一辺$2r_\max$の正方形内にあるメッシュだけを対象に,距離を測定するとします.その正方形の範囲を調べるメソッドを作ります.
def get_search_bound(center_latlon: Tuple[float,float], rmax: float) -> Tuple[Tuple[int,int], Tuple[int,int]]:
    clat, clon = center_latlon
    clat_idx, clon_idx = get_latlon_idxs(center_latlon)
    # 西へ
    for west in reversed(range(0, clon_idx)):
        d = geodesic(center_latlon, (clat, mesh_lon_list[west])).m
        if d > rmax:
            break
    # 東へ
    for east in range(clon_idx, len(mesh_lon_list)):
        d = geodesic(center_latlon, (clat, mesh_lon_list[east])).m
        if d > rmax:
            break
    # 南へ
    for south in reversed(range(0, clat_idx)):
        d = geodesic(center_latlon, (mesh_lat_list[south], clon)).m
        if d > rmax:
            break
    # 北へ
    for north in range(clat_idx, len(mesh_lat_list)):
        d = geodesic(center_latlon, (mesh_lat_list[north], clon)).m
        if d > rmax:
            break
    return (south, west), (north, east)
駅までの距離行列を作る:駅$s$から各メッシュ$(j,i)$までの距離を測り,行列にします.ただし距離の探索範囲は上で実装したget_search_boundが示す範囲内までとします.範囲外は一律で$\infty$と定めておきます.
def get_distance_matrix_around(center_latlon:Tuple[float,float], rmax:float)->np.ndarray:
    M:np.ndarray = np.zeros(shape=(len(mesh_lat_list), len(mesh_lon_list)), dtype=float)
    M.fill(float("inf"))
    (south, west), (north, east) = get_search_bound(center_latlon, rmax)
    for lat_idx in range(south, north):
        lat = mesh_lat_list[lat_idx]
        for lon_idx in range(west, east):
            lon = mesh_lon_list[lon_idx]
            d = geodesic(center_latlon, (lat, lon)).m
            M[lat_idx, lon_idx] = d
    return M

# 各駅について調べる
distance_matrix_data = {}
for station in tqdm(list(stations.iloc)):
    M = get_distance_matrix_around(
        center_latlon=(station["Lat"], station["Lon"]),
        rmax=5000
    )
    distance_matrix_data[station["Name"]] = M
探索範囲を5 kmとしました.結構重い処理ですね!
最寄駅までの距離を求める:distance_matrix_dataには各駅の距離マップが格納されています.各メッシュにおいて最小の値を持ってきます.
# 各点における駅s∈全ての駅までの最小距離
distance_matrixs_tensor = np.array(list(distance_matrix_data.values()))
elementwise_distance_matrix = distance_matrixs_tensor.transpose(1, 2, 0)
nearest_distance_matrix = elementwise_distance_matrix.min(axis=2)
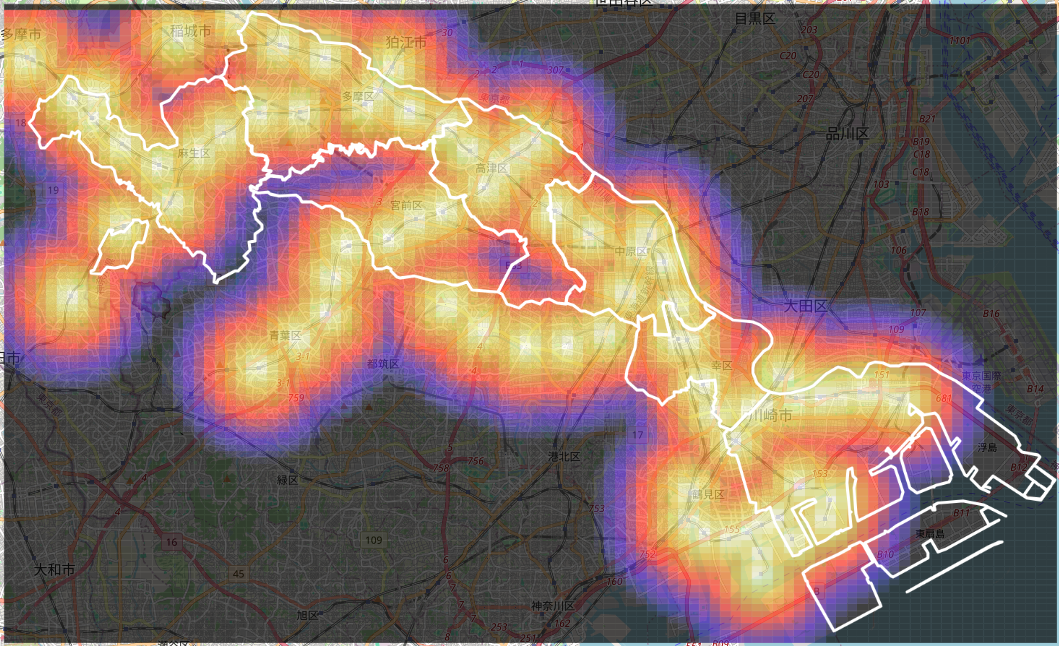
地図に描画:距離を色で表すことにします.各メッシュを距離に対応した色で塗りつぶして描画します.
from matplotlib import cm, colors
colormap = cm.CMRmap_r

dmax = 3000
m = folium.Map(
    location=(mesh_lat_list.mean(), mesh_lon_list.mean()),
    zoom_start=11
)

# 最寄り駅までの距離
for lat_idx, lat in tqdm(list(enumerate(mesh_lat_list))):
    for lon_idx, lon in enumerate(mesh_lon_list):
        d = nearest_distance_matrix[lat_idx, lon_idx]
        color = colors.to_hex(colormap(d / dmax))
        folium.Rectangle(
            bounds=(
                (lat - dlat_half, lon - dlon_half),
                (lat + dlat_half, lon + dlon_half),
            ),
            color="",
            fill_color=color,
            fill_opacity=0.7,
        ).add_to(m)
完成した地図を見てみる
こうみると,川崎市の中で最寄駅から遠めの地域がいくつかあるのが分かります.
- 川崎区の東京湾に面したところ,東扇島や浮島など.めちゃくちゃ遠いですが,ここは人工島だし住む目的の場所じゃないのでいいでしょう,
- 高津区と宮前区の境目付近,野川など.武蔵野貨物線の地上施設がありますね.ここら辺に駅を作るとしたら,この基地を駅化するとか?
- 宮前区と多摩区の境目付近,菅生など.
- 居住区域で一番遠いのは,麻生区の王禅寺や虹ヶ丘,早野などですね.ほぼ黒いです.バスが充実していたのを覚えています.
私の個人サイトにもデプロイしました▼サイズが5 MBくらいあるのでご注意ください.
http://omiyayimo.starfree.jp/piakawasaki/


