昨夜は、【データサイエンティスト入門】科学計算、データ加工、グラフ描画ライブラリの使い方の基礎としてPandasの基礎をまとめましたが、今夜はグラフ描画LibraryのMatplotlibの基礎をまとめます。本書に乗った解説を補足することとします。
【注意】
「東京大学のデータサイエンティスト育成講座」を読んで、ちょっと疑問を持ったところや有用だと感じた部分をまとめて行こうと思う。
したがって、あらすじはまんまになると思うが内容は本書とは関係ないと思って読んでいただきたい。
Chapter 2-5 Matplotlibの基礎
2-5-1 Matplotlibを使うための準備
ほぼ、三行目のpltを使うことが多いです。
以下で使っているので、numpyも記載しておく。
import matplotlb as mlp
import seaborn as sns
import matplotlib.pyplot as plt
import numpy as np
2-5-2 散布図
x,y与えて散布図を描く
np.random.seed(0)
x = np.random.randn(30)
y = np.sin(x) + np.random.randn(30)
plt.figure(figsize=(20,6))
plt.plot(x,y, 'o')  #alphabet o
# plt.scatter(x,y)
plt.title('Title name')
plt.xlabel('X')
plt.ylabel('Y')
plt.grid(True)
plt.show()
xを時系列データのように連続数にする
データ数を10倍にした
y軸の変動のsin曲線が見えるように、乱数成分を半分に減らした。
以下は、プロットの点oを止め折れ線で結ぶ。
np.random.seed(0)
x = np.arange(30)
y = np.sin(x) + 0.5*np.random.randn(30) #乱数効果半減
plt.figure(figsize=(20,6))
plt.plot(x,y, label = 'Label') #'o'を消し線で結ぶ
plt.legend()

plt.title('Title name')
plt.xlabel('X')
plt.ylabel('Y')
plt.grid(True)
plt.show()
| 指定 | 備考 |
|---|---|
| color='red' | 色指定:blue, green, black, yellow, pink,... |
| lw=1 | 線幅,1,2,3,...,10,.. |
| linestyle='-' | 線:'--', '-', '--', '-.', ':', 'None', ' ', '', 'solid', 'dashed', 'dashdot', 'dotted',.. |
| marker='o' | プロット形状:'.', ... |
| matplotlib:Specifying Colors;colorの実際の見え方の対比表 | |
| matplotlib.markersにplotの記号と実際のマーカー対比表 | |
plt.plot(x,y,color='red', lw=1, linestyle='-',marker='o', label = 'Label') |
|
 |
データ数を300に増やして5周期描画に調整
np.random.seed(0)
x = np.arange(300)
y = np.sin(np.pi*x/30) + 0.5*np.random.randn(300)
plt.figure(figsize=(20,6))
plt.plot(x,y,color='blue', lw=1, linestyle='-',marker='o', label = 'Label') #linestyle='--' 'red'
plt.legend()

plt.title('Title name')
plt.xlabel('X')
plt.ylabel('Y')
plt.grid(True)
plt.show()
時系列に対するランダムウォークを描画する
np.random.seed(0)
x = np.arange(300)
y = np.random.randn(300).cumsum() #ここを累積和cumsumに変更
plt.figure(figsize=(20,6))
plt.plot(x,y,color='blue', lw=1, linestyle='-',marker='o', label = 'Label')
plt.legend()

plt.title('Title name')
plt.xlabel('X')
plt.ylabel('Y')
plt.grid(True)
plt.show()
x = np.arange(300)かx = np.linspace(0,299,300)、それともx = np.arange(0.,300.,1.)か(補足)
泥臭い話だけど、補足します。
結果は以下のようになっています。
※端点(境界値)と扱っている数字の属性に注意
x = np.arange(300)
print(type(x),len(x),type(x[0]),x)
# <class 'numpy.ndarray'> 300 <class 'numpy.int32'> [  0   1   2...299]
x = np.linspace(0,299,300)
print(type(x),len(x),x)
# <class 'numpy.ndarray'> 300 <class 'numpy.float64'> [  0.   1.   2. ...299.]
x = np.arange(0,300,1)
print(type(x),len(x),type(x[0]),x)
# <class 'numpy.ndarray'> 300 <class 'numpy.int32'> [  0   1   2 ...299]
x = np.arange(0.,300.,1.)
print(type(x),len(x),type(x[0]),x)
# <class 'numpy.ndarray'> 300 <class 'numpy.float64'> [  0.   1.   2. ...299.]
2-5-3 グラフの分割(以下軸ラベル等端折っています)
plt.figure(figsize=(20,6))

plt.subplot(2,1,1)
x = np.linspace(-10,10,100)
plt.plot(x,np.sin(x))

plt.subplot(2,1,2)
y = np.linspace(-10,10,100)
plt.plot(y,np.sin(2*y))

plt.grid(True)
plt.show()
plt.figure(figsize=(20,6))
x = np.linspace(-10,10,100)
plt.subplot(2,2,1)
plt.plot(x,np.sin(x))
plt.subplot(2,2,2)
plt.plot(x,np.sin(2*x))
plt.subplot(2,2,3)
plt.plot(x,np.sin(3*x))
plt.subplot(2,2,4)
plt.plot(x,np.sin(4*x))
plt.grid(True)
plt.show()
plt.figure(figsize=(20,6))
x = np.linspace(-10,10,100)
for n in range(1,5,1):
    plt.subplot(2,2,n)
    plt.plot(x,np.sin(n*x))
plt.grid(True)
plt.show()
通常は、以下のように描いている。
グラフの内容は難しいが、体裁は分かり易いと思う。
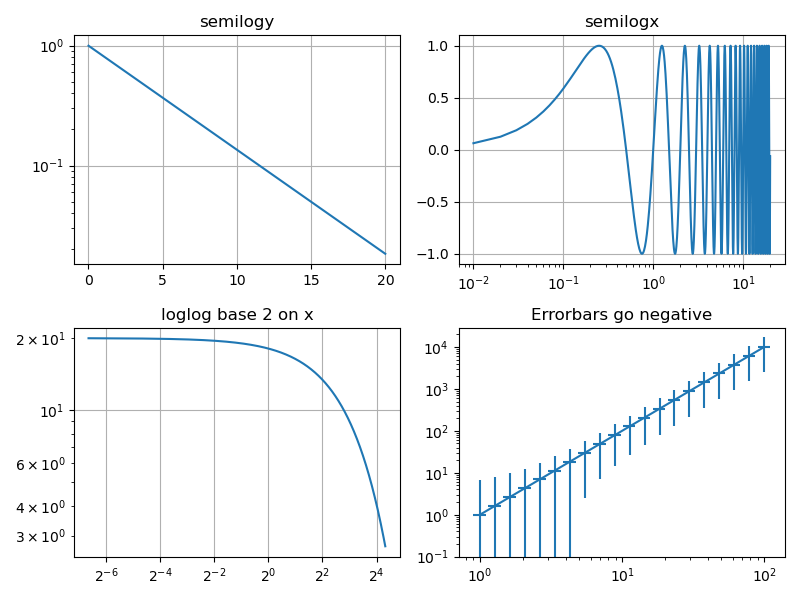
※底が2(任意)の対数目盛のグラフも普通に描ける
【参考】
・Matplotlib Log Demo
import numpy as np
import matplotlib.pyplot as plt

# Data for plotting
t = np.arange(0.01, 20.0, 0.01)

# Create figure
fig, ((ax1, ax2), (ax3, ax4)) = plt.subplots(2, 2, figsize=(8,6))

# log y axis
ax1.semilogy(t, np.exp(-t / 5.0))
ax1.set(title='semilogy')
ax1.grid()

# log x axis
ax2.semilogx(t, np.sin(2 * np.pi * t))
ax2.set(title='semilogx')
ax2.grid()

# log x and y axis
ax3.loglog(t, 20 * np.exp(-t / 10.0), basex=2)
ax3.set(title='loglog base 2 on x')
ax3.grid()

# With errorbars: clip non-positive values
# Use new data for plotting
x = 10.0**np.linspace(0.0, 2.0, 20)
y = x**2.0

ax4.set_xscale("log", nonposx='clip')
ax4.set_yscale("log", nonposy='clip')
ax4.set(title='Errorbars go negative')
ax4.errorbar(x, y, xerr=0.1 * x, yerr=5.0 + 0.75 * y)
# ylim must be set after errorbar to allow errorbar to autoscale limits
ax4.set_ylim(bottom=0.1)

fig.tight_layout()
plt.show()
2-5-4 関数グラフの描画
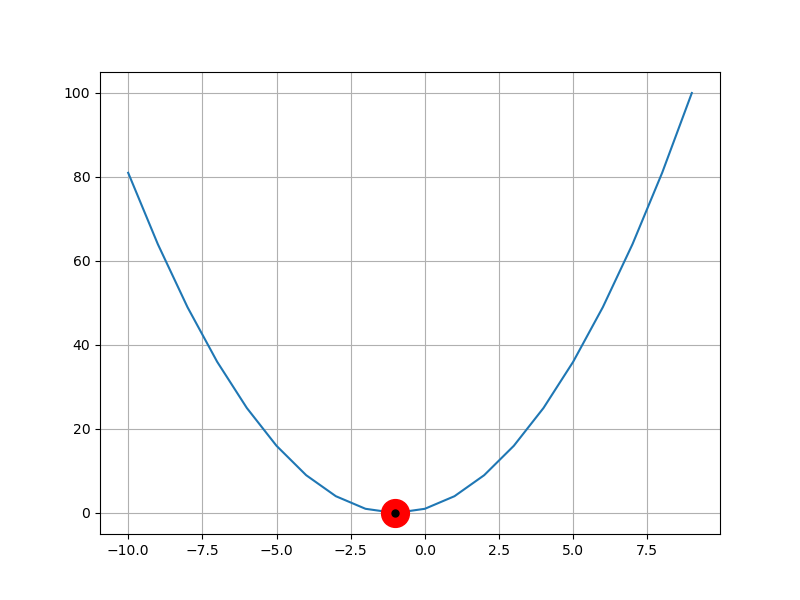
Newton法で使った以下の関数のグラフを表示する。
合わせてNewton法で求めた解をプロットする。
f(x) = x^2 + 2x + 1
def my_function(x):
    return x**2 + 2 * x + 1

from scipy.optimize import newton
x0 = newton(my_function,0)

x = np.arange(-10,10)
plt.figure(figsize = (8, 6))
plt.plot(x, my_function(x))
plt.plot(x0, 0, 'red', marker = 'o',markersize=20)
plt.plot(x0, 0, 'black', marker = 'o',markersize=5)
plt.grid(True)
plt.show()
def my_function(x):
    return x**3 + 2 * x + 1
不安定そうだが、解が求まっている。
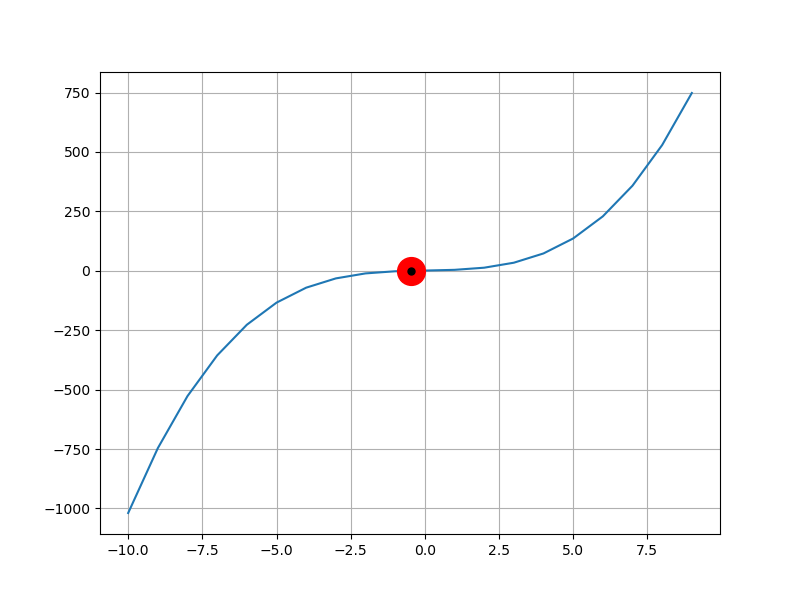
ここでは、マーカーのプロットを工夫しているが、
Marker referenceにmarkerの属性の解説があり、以下の例があり参考にした。
marker_style = dict(linestyle=':', color='0.8', markersize=10,
                    markerfacecolor="tab:blue", markeredgecolor="tab:blue")
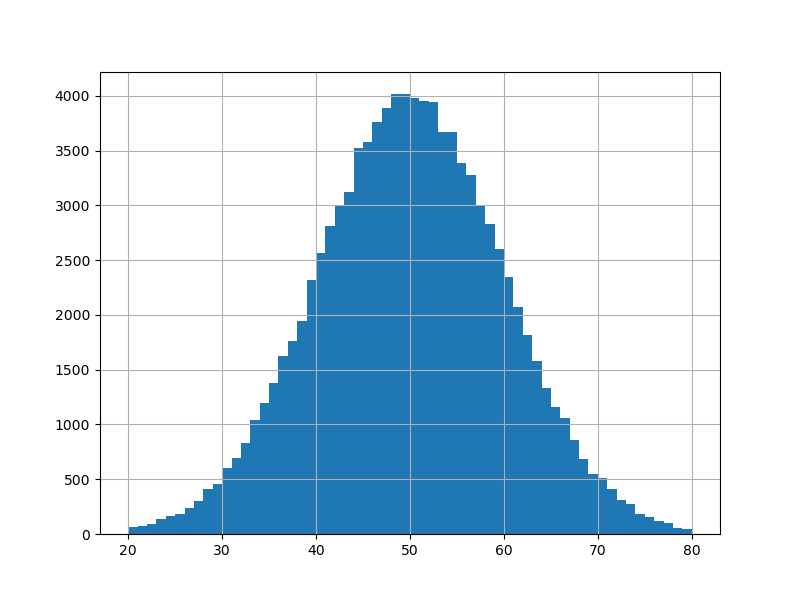
2-5-5 ヒストグラム
np.random.seed(0)
plt.figure(figsize = (8,6))
y = np.random.randn(10**5)*10 + 50
plt.hist(y, bins = 60, range =(20,80))
plt.grid(True)
plt.show()
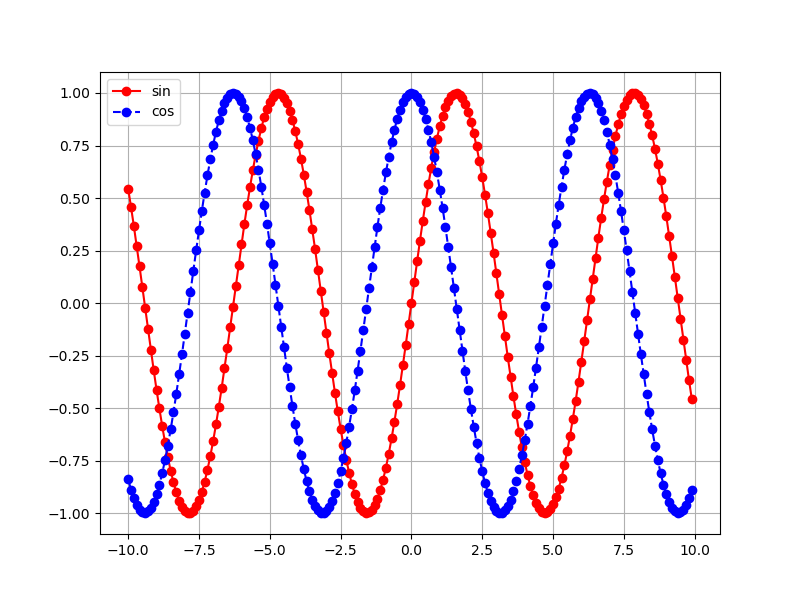
練習問題2-11
x = np.arange(-10,10,0.1)
plt.figure(figsize = (8, 6))
plt.plot(x, np.sin(x), 'red', marker = 'o', linestyle = '-', label = 'sin')
plt.plot(x, np.cos(x), 'blue', marker = 'o', linestyle = '--', label = 'cos')
plt.legend()
plt.grid(True)
plt.show()
plt.close()
練習問題2-12
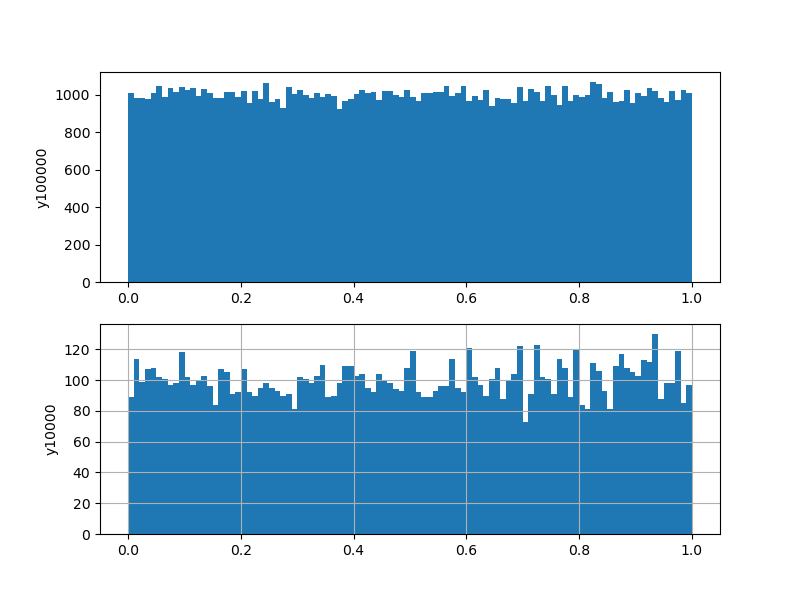
fig, (ax1, ax2) = plt.subplots(2, 1, figsize=(8,6))
np.random.seed(0)
y1 = np.random.uniform(0.0,1.0,100000)
ax1.hist(y1, bins = 100, range =(0.0,1.0))
ax1.set_ylabel('y100000')
y2 = np.random.uniform(0.0,1.0,10000)
ax2.hist(y2, bins = 100, range =(0.0,1.0))
ax2.set_ylabel('y10000')
plt.grid(True)
plt.show()
総合問題
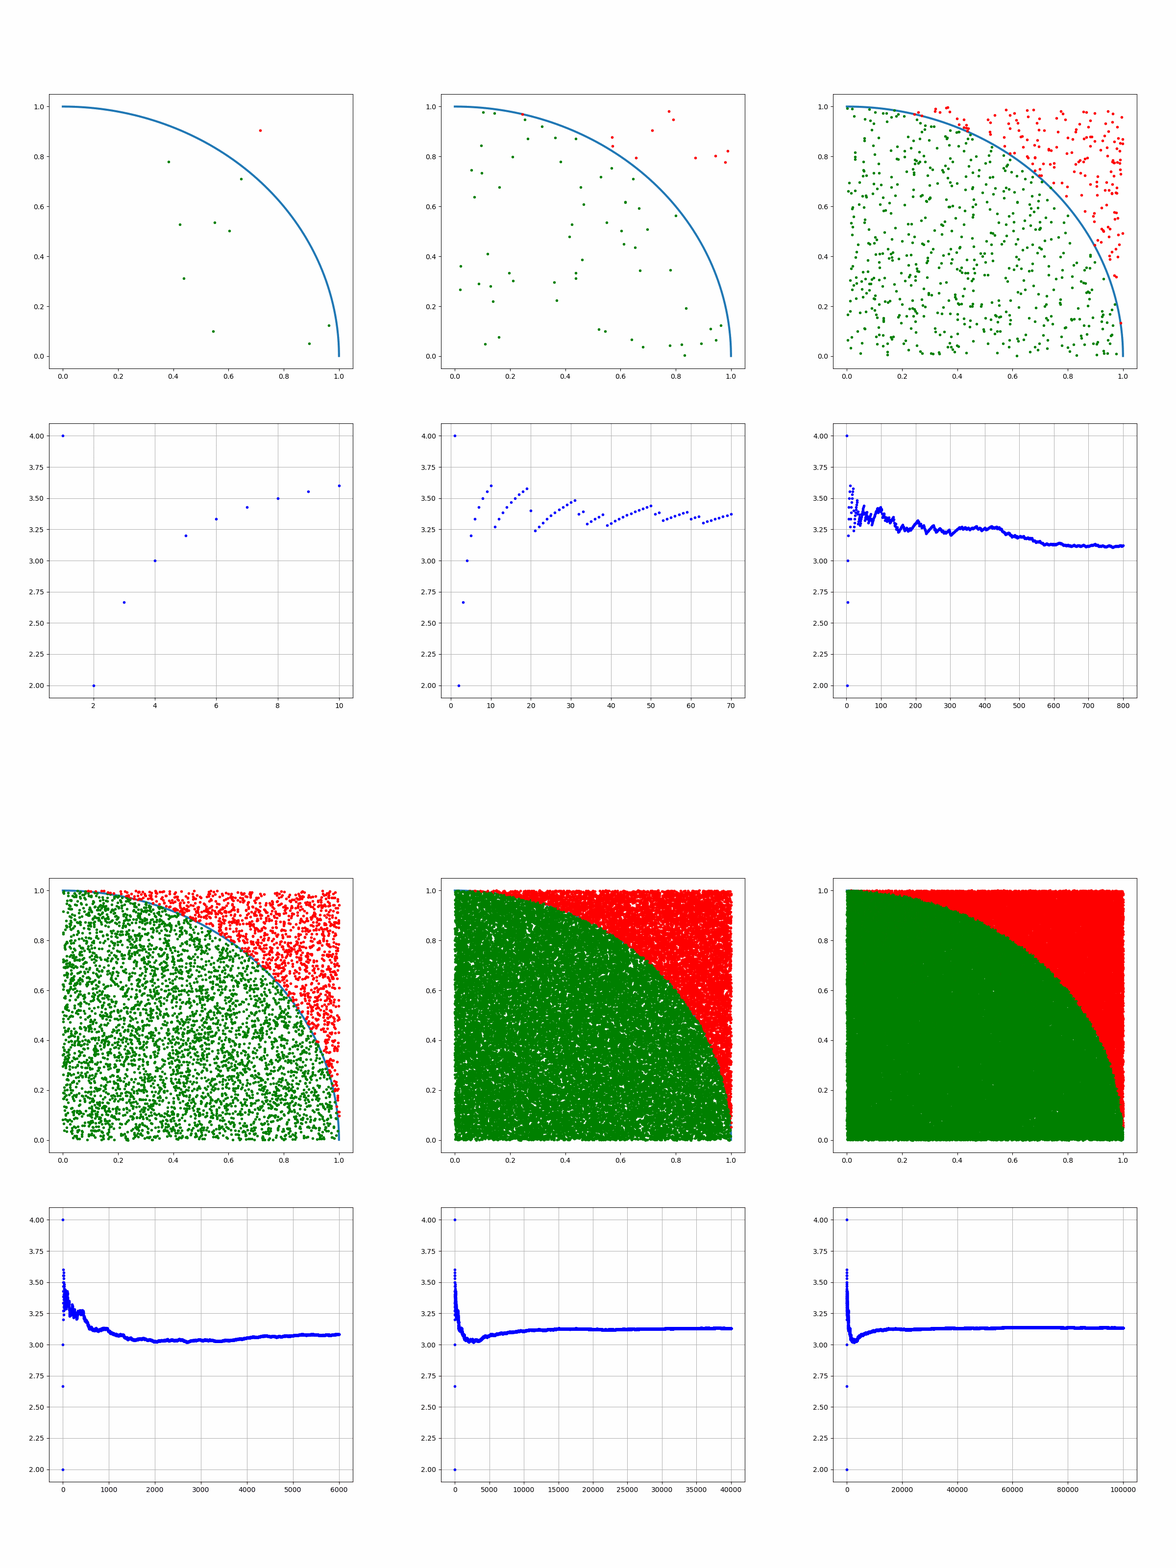
・二組の0-1の一様乱数を使って、円と正方形に入る頻度から、円周率を求める。
・グラフ化する
>python pipi.py
pipi= 3.6 9 10
pipi= 3.4 17 20
pipi= 3.466666666666667 26 30
pipi= 3.3 33 40
pipi= 3.44 43 50
pipi= 3.3333333333333335 50 60
pipi= 3.3714285714285714 59 70
pipi= 3.35 67 80
pipi= 3.422222222222222 77 90
pipi= 3.4 85 100
pipi= 3.3 165 200
pipi= 3.26 326 400
pipi= 3.1266666666666665 469 600
pipi= 3.12 624 800
pipi= 3.104 776 1000
pipi= 3.024 1512 2000
pipi= 3.036 2277 3000
pipi= 3.054 3054 4000
pipi= 3.0712 3839 5000
pipi= 3.082666666666667 4624 6000
pipi= 3.0908571428571427 5409 7000
pipi= 3.0985 6197 8000
pipi= 3.104 6984 9000
pipi= 3.1068 7767 10000
pipi= 3.1224 15612 20000
pipi= 3.126 23445 30000
pipi= 3.1283 31283 40000
pipi= 3.13176 39147 50000
pipi= 3.138 47070 60000
pipi= 3.1370857142857145 54899 70000
pipi= 3.13575 62715 80000
pipi= 3.1347555555555555 70532 90000
pipi= 3.13364 78341 100000
せいぜい有効数字は小数第三位までで4桁、この位に誤差がある。
※計算結果の誤差評価は科学的にやらないといけないのがこの例からも分かる
import numpy as np
import matplotlib.pyplot as plt

fig, (ax1,ax2) = plt.subplots(2, 1, figsize=(8,16))
np.random.seed(0)
s = 10000
x = np.random.uniform(0.0,1.0,s)
y = np.random.uniform(0.0,1.0,s)
x1 = np.arange(0,np.pi/2,0.01)
y1 = np.sin(x1)
y2 = np.cos(x1)
ax1.plot(y1,y2, lw = 3)
plt.grid(True)
count = 0
s1 = 0
for i in range(s):
    s1 += 1
    #print(i)
    if np.math.hypot(x[i],y[i]) <= 1:
        count += 1
        ax1.plot(x[i],y[i], color = 'green',marker = 'o', markersize = 3)
    else:
        ax1.plot(x[i],y[i], color = 'red', marker = 'o', markersize = 3)
    rate = count/s1
    ax2.plot(s1,4*rate,color = 'blue', marker = 'o',linestyle = '-', markersize = 3)
    #plt.pause(0.1)
    if i%500==499:
        print('pipi=',4*rate,count,s1)
        plt.savefig("./fig/pipi{}.png".format(i))
# 出力変更しているが割愛
収束には程遠いが、100000個までのデータを出力した。
だんだん、3.1415...に近づいていく雰囲気はわかると思う。
まとめ
・Matplotlibの使い方の初歩を整理した
・グラフの分割は一般的なものをまとめた
・plt.savefigは総合問題で利用した
・モンテカルロ法でπを計算し、グラフで見える化した
・本書でもこれからあらゆるところで利用される予定である。
おまけ
出来るだけ具体的な事例を見るのがいいと思うので、以下のリンクを張っておく。
Matplotlib Gallery
以下のTutrialは、簡単な事例で難易度に応じて解説している。
Matplotlib Tutorials


