新NISAで積立NISAすればとりあえず、ドルコスト平均法の仕組みで、定額投資を20年続ければ資産形成できそうである。
しかし、肝心なこととして、何に投資すべきかは今一つわかりにくい。
また、20年も待てないよという人向けに、ずばり、株価や企業業績を評価しつつ投資する方法を検証して示してみようと思う。
まず、参考①より、以下の諸量が企業評価に重要だということです。
PER (株価収益率) Price Earnings Ratio
株価が割安か割高かを判断するための指標。利益から見た「株価の割安性」。
株価が「1株当たりの当期純利益(単に1株当たり利益、1株益ともいう)$=EPS$」の何倍になっているかを示す指標。
$ PER=\frac {株価}{1株あたり当期純利益} $
参考
PER@金融・証券用語集
PBR (株価純資産倍率) Price Book-value Ratio
株価が 1 株あたり純資産の何倍であるかを示す。株価が直前の本決算期末の「1株当たり純資産」の何倍になっているかを示す指標
$ PBR = \frac{株価}{1株あたり純資産} $
純資産と自己資本は、どちらも会社の正味の財産を意味し、貸借対照表(バランスシート)では純資産が自己資本として右側に記載されます。
したがって、以下の式で求まります。
$ PBR = \frac{株価}{1株あたり自己資本} $
$ 1株当たり自己資本 = \frac{自己資本}{発行済株式数} $
参考
PBR@金融・証券用語集
ROE(自己資本利益率)Return On Equity
会社が自己資本をどれだけ有効に活用して利益を上げているかを示す指標。
自己資本に対する「経営の効率性」を示しています。
ROEが高い水準で推移していれば、その会社の収益性や成長性も有望ですし、株主への利益還元も期待できます。
$ ROE = \frac{当期純利益}{自己資本} $
参考
ROE@金融・証券用語集
EPS(一株益)Earnings Per Share
1株あたりの純利益(当期利益や当期純利益など)を示す指標、
企業が生み出した利益(当期純利益)を発行済みの株式数で割ることで求められる。
$ EPS = \frac{当期純利益}{発行済株式数} $
EPS の数値は投資の判断基準として使用され、EPS が高ければ高いほど株価は上昇しやすくなり、少なくなればなるほど低くなります。また、株価は「株価=EPS × PER(倍)」の計算式を用いて適正な株価 を求めることもできます。 日経平均の PER は 10~15 倍が妥当とされており、たとえばある銘柄の EPS が 100 円であれば、適正な株価は 1,000~1,500 円と見ることができます。
諸量を求める
次に以下を参考にして、諸量を求めてみようと思う。
やってみると、すぐわかることだが、少し前の記事なのでまんまでは求められないので、少し解説しつつ求める。
import pandas as pd
import yfinance as yf

ticker = yf.Ticker("2168.T") #パソナ
hist = ticker.history(period="max")
hist.tail()
                            Open	High	Low	    Close	Volume	Dividends	Stock Splits
Date
2024-04-26 00:00:00+09:00	2230.0	2263.0	2201.0	2260.0	189800	0.0	0.0
2024-04-30 00:00:00+09:00	2270.0	2288.0	2219.0	2221.0	271100	0.0	0.0
2024-05-01 00:00:00+09:00	2216.0	2233.0	2193.0	2232.0	179200	0.0	0.0
2024-05-02 00:00:00+09:00	2245.0	2275.0	2244.0	2266.0	127000	0.0	0.0
2024-05-07 00:00:00+09:00	2285.0	2319.0	2259.0	2264.0	237100	0.0	0.0
financials = ticker.financials
financials
	                        2023-05-31	2022-05-31	2021-05-31	2020-05-31
Tax Effect Of Unusual Items	428620400.0	-81815500.0	-1124060200.0	-823065600.0
Tax Rate For Calcs	        0.3614	0.3991	0.3062	0.3062
Normalized EBITDA	        21820000000.0	27916000000.0	25123000000.0	15303000000.0
Total Unusual Items	        1186000000.0	-205000000.0	-3671000000.0	-2688000000.0
Total Unusual Items Excluding Goodwill	1186000000.0	-205000000.0	-3671000000.0	-2688000000.0
Net Income From Continuing Operation Net Minority Interest	6099000000.0	8621000000.0	6784000000.0	594000000.0
Reconciled Depreciation	    5847000000.0	5128000000.0	4456000000.0	4832000000.0
Reconciled Cost Of Revenue	281053000000.0	276424000000.0	251570000000.0	248295000000.0
EBITDA	                    23006000000.0	27711000000.0	21452000000.0	12615000000.0
EBIT	                    17159000000.0	22583000000.0	16996000000.0	7783000000.0
Net Interest Income	        -352000000.0	-265000000.0	-250000000.0	-163000000.0
Interest Expense	        393000000.0	293000000.0	290000000.0	200000000.0
Interest Income	            41000000.0	28000000.0	40000000.0	37000000.0
Normalized Income	        5341620400.0	8744184500.0	9330939800.0	2458934400.0
Net Income From Continuing And Discontinued Operation	6099000000.0	8621000000.0	6784000000.0	594000000.0
Total Expenses	            358201000000.0	344012000000.0	314598000000.0	314406000000.0
Total Operating Income As Reported	14377000000.0	22083000000.0	19940000000.0	10577000000.0
Diluted Average Shares	    39292617.0	39291737.0	39132377.0	39115590.0
Basic Average Shares	    39171484.0	39152550.0	39132377.0	39115590.0
Diluted EPS	                155.22	219.41	173.36	15.21
Basic EPS	                155.7	220.19	173.36	15.21
Diluted NI Availto Com Stockholders	6099000000.0	8621000000.0	6784000000.0	594000000.0
Net Income Common Stockholders	6099000000.0	8621000000.0	6784000000.0	594000000.0
Otherunder Preferred Stock Dividend	0.0	0.0	0.0	0.0
Net Income	                6099000000.0	8621000000.0	6784000000.0	594000000.0
Minority Interests	        -4608000000.0	-4773000000.0	-2898000000.0	-2728000000.0
Net Income Including Noncontrolling Interests	10707000000.0	13394000000.0	9682000000.0	3323000000.0
Net Income Continuous Operations	10708000000.0	13395000000.0	9682000000.0	3323000000.0
Tax Provision	            6058000000.0	8895000000.0	7024000000.0	4260000000.0
Pretax Income	            16766000000.0	22290000000.0	16706000000.0	7583000000.0
Other Non Operating Income Expenses	1189000000.0	535000000.0	800000000.0	-156000000.0
Special Income Charges	    -81000000.0	-184000000.0	-3605000000.0	-2389000000.0
Other Special Charges	    81000000.0	52000000.0	367000000.0	169000000.0
Write Off	                0.0	132000000.0	3238000000.0	2220000000.0
Net Non Operating Interest Income Expense	-352000000.0	-265000000.0	-250000000.0	-163000000.0
Interest Expense Non Operating	393000000.0	293000000.0	290000000.0	200000000.0
Interest Income Non Operating	41000000.0	28000000.0	40000000.0	37000000.0
Operating Income	       14377000000.0	22083000000.0	19941000000.0	10578000000.0
Operating Expense	       77148000000.0	67588000000.0	63028000000.0	66111000000.0
Gross Profit	           91525000000.0	89671000000.0	82969000000.0	76689000000.0
Cost Of Revenue	           281053000000.0	276424000000.0	251570000000.0	248295000000.0
Total Revenue	           372579000000.0	366096000000.0	334540000000.0	324984000000.0
Operating Revenue	       372579000000.0	366096000000.0	334540000000.0	324984000000.0
気になる諸量を書いておくと、以下のとおり
・Diluted EPS(希薄化後1株当たり利益)とは、新株予約権やストックオプションなど、潜在株式の増加を加味して計算されたより厳密な1株当たり当期純利益です
・Net Income 純利益
・EBITDA(イービットディーエー)とは、「Earnings Before Interest Taxes Depreciation and Amortization」の略で、税引前利益に支払利息、減価償却費を加えて算出される利益です
financials.T["Net Income"]
2023-05-31    6099000000.0
2022-05-31    8621000000.0
2021-05-31    6784000000.0
2020-05-31     594000000.0
Name: Net Income, dtype: object
balance_sheet = ticker.balance_sheet
pd.set_option('display.max_rows', None)
balance_sheet
	                    2023-05-31	2022-05-31	2021-05-31	2020-05-31
Treasury Shares Number	2516094.0	2516094.0	2550899.0	2574776.0
Ordinary Shares Number	39174206.0	39174206.0	39139401.0	39115524.0
Share Issued	        41690300.0	41690300.0	41690300.0	41690300.0
Total Debt	            58332000000.0	53165000000.0	33821000000.0	35923000000.0
Tangible Book Value	    27416000000.0	26793000000.0	31796000000.0	24629000000.0
Invested Capital	    111023000000.0	102188000000.0	70756000000.0	66090000000.0
Working Capital	        49492000000.0	47568000000.0	38087000000.0	36495000000.0
Net Tangible Assets	    27416000000.0	26793000000.0	31796000000.0	24629000000.0
Capital Lease Obligations	1307000000.0	965000000.0	1222000000.0	1643000000.0
Common Stock Equity	    53998000000.0	49988000000.0	38157000000.0	31810000000.0
Total Capitalization	100727000000.0	92577000000.0	61323000000.0	57450000000.0
Total Equity Gross Minority Interest	71620000000.0	67143000000.0	49776000000.0	42314000000.0
Minority Interest	    17622000000.0	17155000000.0	11619000000.0	10504000000.0
Stockholders Equity	    53998000000.0	49988000000.0	38157000000.0	31810000000.0
Other Equity Interest	2000000.0	4000000.0	4000000.0	NaN
Treasury Stock	        2378000000.0	2378000000.0	2417000000.0	2442000000.0
Retained Earnings	    32941000000.0	28238000000.0	20801000000.0	14789000000.0
Additional Paid In Capital	17094000000.0	17786000000.0	14029000000.0	14013000000.0
Capital Stock	        5000000000.0	5000000000.0	5000000000.0	5000000000.0
Common Stock	        5000000000.0	5000000000.0	5000000000.0	5000000000.0
Total Liabilities Net Minority Interest	203884000000.0	136603000000.0	101865000000.0	98127000000.0
Total Non Current Liabilities Net Minority Interest	59101000000.0	53048000000.0	31090000000.0	33645000000.0
Other Non Current Liabilities	2953000000.0	650000000.0	1051000000.0	910000000.0
Non Current Pension And Other Postretirement Benefit Plans	3575000000.0	3469000000.0	3158000000.0	2793000000.0
Non Current Deferred Taxes Liabilities	2366000000.0	3506000000.0	1028000000.0	1328000000.0
Long Term Debt And Capital Lease Obligation	47653000000.0	43143000000.0	23728000000.0	26643000000.0
Long Term Capital Lease Obligation	924000000.0	554000000.0	562000000.0	1003000000.0
Long Term Debt	        46729000000.0	42589000000.0	23166000000.0	25640000000.0
Long Term Provisions	2554000000.0	2280000000.0	2125000000.0	1971000000.0
Current Liabilities	    144783000000.0	83555000000.0	70775000000.0	64482000000.0
Other Current Liabilities	79593000000.0	13876000000.0	11560000000.0	9468000000.0
Current Debt And Capital Lease Obligation	10679000000.0	10022000000.0	10093000000.0	9280000000.0
Current Capital Lease Obligation	383000000.0	411000000.0	660000000.0	640000000.0
Current Debt	        10296000000.0	9611000000.0	9433000000.0	8640000000.0
Pensionand Other Post Retirement Benefit Plans Current	4693000000.0	4760000000.0	4597000000.0	4125000000.0
Current Provisions	    17000000.0	43000000.0	17000000.0	2000000.0
Payables	            25304000000.0	30385000000.0	25994000000.0	22475000000.0
Other Payable	        10334000000.0	10523000000.0	8359000000.0	6963000000.0
Total Tax Payable	    7543000000.0	11127000000.0	11258000000.0	9808000000.0
Accounts Payable	    7427000000.0	8735000000.0	6377000000.0	5704000000.0
Total Assets	        275504000000.0	203746000000.0	151641000000.0	140441000000.0
Total Non Current Assets	81225000000.0	72618000000.0	42776000000.0	39458000000.0
Other Non Current Assets	1241000000.0	1237000000.0	1393000000.0	1465000000.0
Defined Pension Benefit	2245000000.0	1942000000.0	1348000000.0	1203000000.0
Non Current Prepaid Assets	NaN	NaN	6751000000.0	5482000000.0
Non Current Deferred Assets	130000000.0	149000000.0	168000000.0	187000000.0
Non Current Deferred Taxes Assets	2909000000.0	2720000000.0	3182000000.0	2757000000.0
Investmentin Financial Assets	6586000000.0	6938000000.0	4966000000.0	4420000000.0
Available For Sale Securities	6586000000.0	6938000000.0	4966000000.0	4420000000.0
Goodwill And Other Intangible Assets	26582000000.0	23195000000.0	6361000000.0	7181000000.0
Other Intangible Assets	19229000000.0	16362000000.0	4717000000.0	5041000000.0
Goodwill	            7353000000.0	6833000000.0	1644000000.0	2140000000.0
Net PPE	41498000000.0	36398000000.0	25319000000.0	22087000000.0
Accumulated Depreciation	-16179000000.0	-16657000000.0	-14448000000.0	-13134000000.0
Gross PPE	            57677000000.0	53055000000.0	39767000000.0	35221000000.0
Construction In Progress	11126000000.0	10668000000.0	9434000000.0	7948000000.0
Other Properties	    10415000000.0	11238000000.0	9944000000.0	9726000000.0
Buildings And Improvements	28073000000.0	23841000000.0	17155000000.0	14938000000.0
Land And Improvements	8063000000.0	7308000000.0	3234000000.0	2609000000.0
Properties	            0.0	0.0	0.0	0.0
Current Assets	        194275000000.0	131123000000.0	108862000000.0	100977000000.0
Other Current Assets	12527000000.0	9561000000.0	6859000000.0	6755000000.0
Inventory	            3365000000.0	3560000000.0	2717000000.0	2250000000.0
Other Receivables	    11577000000.0	10008000000.0	NaN	NaN
Taxes Receivable	    2693000000.0	70000000.0	486000000.0	106000000.0
Accounts Receivable	    41046000000.0	40973000000.0	44267000000.0	42744000000.0
Gross Accounts Receivable	41046000000.0	40973000000.0	44267000000.0	42744000000.0
Cash Cash Equivalents And Short Term Investments	123067000000.0	66951000000.0	54533000000.0	49122000000.0
Cash And Cash Equivalents	123067000000.0	66951000000.0	54533000000.0	49122000000.0
Share Issued
発行済み株数
Stockholders Equity(株主資本)
総資産から負債総額を差し引いた額で、「自己資本(net worth)」や「純資産(book value)」とも呼ばれます。企業が丸ごと売却された場合、負債をすべて返済した後に株主に残るであろうものを指します。
balance_sheet.T["Share Issued"]
2023-05-31    41690300.0
2022-05-31    41690300.0
2021-05-31    41690300.0
2020-05-31    41690300.0
Name: Share Issued, dtype: object
balance_sheet.T["Stockholders Equity"]
2023-05-31    53998000000.0
2022-05-31    49988000000.0
2021-05-31    38157000000.0
2020-05-31    31810000000.0
Name: Stockholders Equity, dtype: object
cashflow = ticker.cashflow
cashflow
	                         2023-05-31	2022-05-31	2021-05-31	2020-05-31
Free Cash Flow	            -7659000000.0	-6200000000.0	10116000000.0	4720000000.0
Repurchase Of Capital Stock	-1506000000.0	0.0	0.0	-5671000000.0
Repayment Of Debt	        -10925000000.0	-11684000000.0	-9207000000.0	-6485000000.0
Issuance Of Debt	         15727000000.0	31629000000.0	7511000000.0	21344000000.0
Issuance Of Capital Stock	NaN	NaN	NaN	762000000.0
Capital Expenditure	        -13620000000.0	-16315000000.0	-8752000000.0	-6704000000.0
End Cash Position	         47919000000.0	56578000000.0	52298000000.0	48147000000.0
Other Cash Adjustment Outside Changein Cash	NaN	2000000.0	NaN	-117000000.0
Beginning Cash Position	     56578000000.0	52298000000.0	48147000000.0	31793000000.0
Effect Of Exchange Rate Changes	174000000.0	244000000.0	95000000.0	-91000000.0
Changes In Cash	            -8833000000.0	4034000000.0	4056000000.0	16562000000.0
Financing Cash Flow	        -2292000000.0	23543000000.0	-5147000000.0	12102000000.0
Net Other Financing Charges	42000000.0	7672000000.0	-14000000.0	8656000000.0
Cash Dividends Paid	        -1392000000.0	-1194000000.0	-756000000.0	-710000000.0
Common Stock Dividend Paid	NaN	NaN	NaN	-710000000.0
Net Common Stock Issuance	-1506000000.0	0.0	0.0	-4909000000.0
Common Stock Payments	    -1506000000.0	0.0	0.0	-5671000000.0
Common Stock Issuance	NaN	NaN	NaN	762000000.0
Net Issuance Payments Of Debt	4788000000.0	19884000000.0	-1691000000.0	11859000000.0
Net Short Term Debt Issuance	-14000000.0	-61000000.0	5000000.0	-3000000000.0
Net Long Term Debt Issuance	  4802000000.0	19945000000.0	-1696000000.0	14859000000.0
Long Term Debt Payments	     -10925000000.0	-11684000000.0	-9207000000.0	-6485000000.0
Long Term Debt Issuance	      15727000000.0	31629000000.0	7511000000.0	21344000000.0
Investing Cash Flow	         -12502000000.0	-29624000000.0	-9665000000.0	-6964000000.0
Net Other Investing Changes	  1082000000.0	-2226000000.0	-702000000.0	-932000000.0
Net Investment Purchase And Sale	1195000000.0	-649000000.0	-26000000.0	-201000000.0
Sale Of Investment	          1790000000.0	95000000.0	7000000.0	41000000.0
Purchase Of Investment	     -595000000.0	-744000000.0	-33000000.0	-242000000.0
Net Business Purchase And Sale	-1268000000.0	-10451000000.0	-197000000.0	0.0
Purchase Of Business	     -1268000000.0	-10451000000.0	-197000000.0	0.0
Net Intangibles Purchase And Sale	-4591000000.0	-4683000000.0	-1721000000.0	-1894000000.0
Purchase Of Intangibles	     -4591000000.0	-4683000000.0	-1721000000.0	-1894000000.0
Net PPE Purchase And Sale	 -8930000000.0	-11619000000.0	-7021000000.0	-3955000000.0
Sale Of PPE	                  99000000.0	13000000.0	10000000.0	855000000.0
Purchase Of PPE	             -9029000000.0	-11632000000.0	-7031000000.0	-4810000000.0
Operating Cash Flow	          5961000000.0	10115000000.0	18868000000.0	11424000000.0
Taxes Refund Paid	         -12932000000.0	-8084000000.0	-7820000000.0	-5406000000.0
Interest Received Cfo	      98000000.0	86000000.0	87000000.0	79000000.0
Interest Paid Cfo	         -374000000.0	-286000000.0	-292000000.0	-197000000.0
Change In Working Capital	 -2253000000.0	-9431000000.0	1625000000.0	1238000000.0
Change In Other Current Liabilities	816000000.0	1154000000.0	2282000000.0	804000000.0
Change In Other Current Assets	-3143000000.0	-2536000000.0	798000000.0	-230000000.0
Change In Payable	          39000000.0	-862000000.0	527000000.0	2803000000.0
Change In Prepaid Assets	  1061000000.0	-1201000000.0	-886000000.0	1389000000.0
Change In Inventory	          199000000.0	-315000000.0	-458000000.0	-216000000.0
Change In Receivables	     -1188000000.0	-6112000000.0	-1422000000.0	-3536000000.0
Other Non Cash Items	     -835000000.0	-394000000.0	-317000000.0	534000000.0
Depreciation And Amortization	5847000000.0	5128000000.0	4456000000.0	4832000000.0
Amortization Cash Flow	      721000000.0	709000000.0	662000000.0	819000000.0
Depreciation	              5126000000.0	4419000000.0	3794000000.0	4013000000.0
Gain Loss On Investment Securities	-1170000000.0	97000000.0	435000000.0	472000000.0
Net Income From Continuing Operations	16766000000.0	22290000000.0	16706000000.0	7583000000.0
EPS(1株当たり当期純利益)Earnings Per Shareを求める
$ EPS = \frac{当期純利益}{発行済株式数} $
eps = financials.T["Net Income"] / balance_sheet.T["Share Issued"]
eps
2023-05-31    146.293023
2022-05-31    206.786711
2021-05-31    162.723703
2020-05-31     14.247919
dtype: object
ROE(自己資本利益率)Return On Equityを求める
$ ROE = \frac{当期純利益}{自己資本} $
roe = financials.T["Net Income"] / balance_sheet.T["Stockholders Equity"]
roe
2023-05-31    0.112949
2022-05-31    0.172461
2021-05-31    0.177792
2020-05-31    0.018673
dtype: object
PER (株価収益率) Price Earnings Ratioを求める
$ PER=\frac {株価}{1株あたり当期純利益} $
per = hist["Close"]["2023-05-31"] / eps["2023-05-31"]
per
11.88026584686014
per = hist["Close"]["2023-05-20":"2023-06-10"] / eps["2023-05-31"]
per
Date
2023-05-22 00:00:00+09:00    12.461106
2023-05-23 00:00:00+09:00    12.246606
2023-05-24 00:00:00+09:00    11.985185
2023-05-25 00:00:00+09:00    11.958372
2023-05-26 00:00:00+09:00    11.770684
2023-05-29 00:00:00+09:00    12.105841
2023-05-30 00:00:00+09:00    12.023813
2023-05-31 00:00:00+09:00    11.880266
2023-06-01 00:00:00+09:00    11.716212
2023-06-02 00:00:00+09:00    11.941786
2023-06-05 00:00:00+09:00    12.071663
2023-06-06 00:00:00+09:00    12.003307
2023-06-07 00:00:00+09:00    11.955457
2023-06-08 00:00:00+09:00    11.661527
2023-06-09 00:00:00+09:00    11.647856
Name: Close, dtype: float64
PBR (株価純資産倍率) Price Book-value Ratioを求める
\begin{align}
PBR &= \frac{株価}{1株当たり純資産} \\
  &= \frac{株価}{1株当たり自己資本} \\

  &= \frac{株価*発行済株式数}{自己資本}
\end{align}
1株当たり自己資本 = \frac{自己資本}{発行済株式数}
したがって、以下の式が成り立つ、
PBR = ROE * PER
pbr = roe['2023-05-31'] * per
pbr
Date
2023-05-22 00:00:00+09:00    1.407465
2023-05-23 00:00:00+09:00    1.383237
2023-05-24 00:00:00+09:00    1.353710
2023-05-25 00:00:00+09:00    1.350682
2023-05-26 00:00:00+09:00    1.329483
2023-05-29 00:00:00+09:00    1.367338
2023-05-30 00:00:00+09:00    1.358073
2023-05-31 00:00:00+09:00    1.341860
2023-06-01 00:00:00+09:00    1.323330
2023-06-02 00:00:00+09:00    1.348808
2023-06-05 00:00:00+09:00    1.363478
2023-06-06 00:00:00+09:00    1.355757
2023-06-07 00:00:00+09:00    1.350353
2023-06-08 00:00:00+09:00    1.317153
2023-06-09 00:00:00+09:00    1.315609
Name: Close, dtype: float64
PER(会社予想)用語(連)0.88倍(15:00)
PBR(実績)用語(連)1.71倍(15:00)
EPS(会社予想)用語(連)2,552.55(2024/05)
BPS(実績)用語(連)1,315.48(2023/05)
ROE(実績)用語(連)11.73%(2023/05)
(株)パソナグループ【2168.T】@yahoo finace
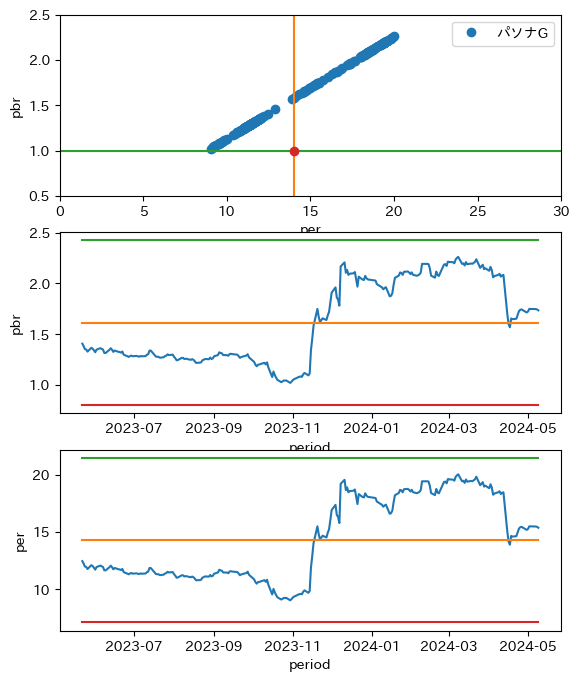
投資判断; PBR vs PER
per = hist["Close"]["2023-05-20":"2024-05-09"] / eps["2023-05-31"]
pbr = roe['2023-05-31'] * per  #グラフの傾きはroe['2023-05-31']
x_avg = 14
y_avg = 1
y = np.linspace(0,30,100)
y_ = np.linspace(1,1,100)
x = np.linspace(0.5,2.5,100)
#x_ = np.linspace(14,14,100)
x_ = np.linspace(x_avg,x_avg,100)
x_1 = np.linspace(np.average(per),np.average(per),238)
x_2 = np.linspace(np.average(pbr),np.average(pbr),238)

fig, (ax1,ax2,ax3) = plt.subplots(3,1,figsize=(1.6180 * 4, 4*2))
ax3.plot(per)
ax3.plot(per.index,x_1)
ax3.set_xlabel("period")
ax3.set_ylabel('per')
ax2.plot(pbr)
ax2.plot(pbr.index,x_2)
ax2.set_xlabel("period")
ax2.set_ylabel('pbr')
ax1.plot(per, pbr, 'o', label = 'パソナG')
ax1.set_xlabel("per")
ax1.set_ylabel('pbr')
ax1.plot(x_, x)
ax1.plot(y,y_)
ax1.plot(x_avg, y_avg, 'o')
ax1.set_ylim(0.5,2.5)
ax1.set_xlim(0,30)
ax1.legend()

複数銘柄のグラフ
コード改善
stock_dict = {'JT':'2914.T', #'2914.JP',
              'セガサミ':'6460.T',
              'NTT':'9432.T', #'9432.JP',
              'トヨタ':'7203.T', # '7203.JP',
              '三菱自動車':'7211.T', #'7211.JP',
              '日本航空':'9201.T', #'9201.JP',
              '全日空':'9202.T',
              'ENEOS':'5020.T', #'5020.JP',
              }
def plot_pbrper(pbr, per, name):
    x_avg = 14
    y_avg = 1
    y = np.linspace(0,30,100)
    y_ = np.linspace(1,1,100)
    x = np.linspace(0.,2.5,100)
    #x_ = np.linspace(14,14,100)
    x_ = np.linspace(x_avg,x_avg,100)
    x_1 = np.linspace(np.average(per),np.average(per),279) #279;期間日数
    x_2 = np.linspace(np.average(pbr),np.average(pbr),279)

    fig, (ax1,ax2,ax3) = plt.subplots(3,1,figsize=(1.6180 * 4, 4*2))
    ax3.plot(per)
    ax3.plot(per.index,x_1)
    ax3.set_xlabel("period")
    ax3.set_ylabel('per')
    ax2.plot(pbr)
    ax2.plot(pbr.index,x_2)
    ax2.set_xlabel("period")
    ax2.set_ylabel('pbr')
    ax1.plot(per, pbr, 'o', label = name)
    ax1.set_xlabel("per")
    ax1.set_ylabel('pbr')
    ax1.plot(x_, x)
    ax1.plot(y,y_)
    ax1.plot(x_avg, y_avg, 'o')
    #ax1.set_ylim(0.,2.5)
    #ax1.set_xlim(0,30)
    ax1.legend()
for name, stock in stock_dict.items():
    ticker = yf.Ticker(stock) #'日産自動車':'7201.T', パソナ: 2168.T 京急: 9006.T
    hist = ticker.history(period="max")
    financials = ticker.financials
    balance_sheet = ticker.balance_sheet
    eps = financials.T["Net Income"] / balance_sheet.T["Share Issued"]
    roe = financials.T["Net Income"] / balance_sheet.T["Stockholders Equity"]
    per = hist["Close"]["2023-03-20":"2024-05-09"] / eps[financials.columns[0]]   #基準日"2023-03-31"がまちまち
    pbr = roe[financials.columns[0]] * per #グラフの傾きはroe[financials.columns[0]]

    plot_pbrper(pbr,per, name)
目標株価
参考
個別銘柄レポート/理論株価
利用する基本的な式は以下のものを利用する。
$株価 = EPS * PER$
ここで、参考では以下の通りで求めている。
PER基準

最新の予想EPS × 過去75日間のPERレンジ(±2σ)

理論株価:過去75日間のPER平均値をあてはめた場合の株価水準
上値目途:PERの上限(平均+2σ)まで買われた場合の株価水準
下値目途:PERの下限(平均-2σ)まで売られた場合の株価水準
$株価 = BPS * PBR$
PBR基準
最新の実績BPS × 過去75日間のPBRレンジ(±2σ)

理論株価:過去75日間のPBR平均値をあてはめた場合の株価水準
上値目途:PBRの上限(平均+2σ)まで買われた場合の株価水準
下値目途:PBRの下限(平均-2σ)まで売られた場合の株価水準
目標株価(混乱を避けるためにこちらは目標株価とする)を上記を参考を参照して求めてみようと思う
ただし、目標株価は、pbr及びperの年間(2023.01-2024.5.09)の平均から求められるそれぞれの目標株価とし、
上値と下値は、年間(2023.01-2024.05.09)の$±2σ$から求められるものとする。
PER PBRの平均と±2σをみる
x_avg = 14
y_avg = 1
y = np.linspace(0,30,100)
y_ = np.linspace(1,1,100)
x = np.linspace(0.5,2.5,100)
#x_ = np.linspace(14,14,100)
x_ = np.linspace(x_avg,x_avg,100)
x_1 = np.linspace(np.average(per),np.average(per),238)
x_2 = np.linspace(np.average(pbr),np.average(pbr),238)

per_mean = np.linspace(statistics.mean(per), statistics.mean(per), len(x_1), dtype=float)
per_var = per_mean + 2*np.linspace(np.sqrt(statistics.variance(per)), np.sqrt(statistics.variance(per)), len(x_1), dtype=float)
per_var_ = per_mean - 2*np.linspace(np.sqrt(statistics.variance(per)), np.sqrt(statistics.variance(per)), len(x_1), dtype=float)
pbr_mean = np.linspace(statistics.mean(pbr), statistics.mean(pbr), len(x_2), dtype=float)
pbr_var = pbr_mean + 2*np.linspace(np.sqrt(statistics.variance(pbr)), np.sqrt(statistics.variance(pbr)), len(x_2), dtype=float)
pbr_var_ = pbr_mean - 2*np.linspace(np.sqrt(statistics.variance(pbr)), np.sqrt(statistics.variance(pbr)), len(x_2), dtype=float)


fig, (ax1,ax2,ax3) = plt.subplots(3,1,figsize=(1.6180 * 4, 4*2))
ax3.plot(per)
ax3.plot(per.index,x_1)
ax3.plot(per.index,per_var)
ax3.plot(per.index,per_var_)
ax3.set_xlabel("period")
ax3.set_ylabel('per')
ax2.plot(pbr)
ax2.plot(pbr.index,x_2)
ax2.plot(pbr.index,pbr_var)
ax2.plot(pbr.index,pbr_var_)
ax2.set_xlabel("period")
ax2.set_ylabel('pbr')
ax1.plot(per, pbr, 'o', label = 'パソナG')
ax1.set_xlabel("per")
ax1.set_ylabel('pbr')
ax1.plot(x_, x)
ax1.plot(y,y_)
ax1.plot(x_avg, y_avg, 'o')
ax1.set_ylim(0.5,2.5)
ax1.set_xlim(0,30)
ax1.legend()
目標株価と上値、下値を求める
stock_dict = {'JT':'2914.T', #'2914.JP',
              'セガサミ':'6460.T',
              'NTT':'9432.T', #'9432.JP',
              'トヨタ':'7203.T', # '7203.JP',
              '三菱自動車':'7211.T', #'7211.JP',
              '日本航空':'9201.T', #'9201.JP',
              '全日空':'9202.T',
              'ENEOS':'5020.T', #'5020.JP',
              '川崎汽':'9107.T', #'9107.JP',
              '郵船':'9101.T', #'9101.JP'
              '商船三井':'9104.T', #'9104.JP'
              '郵政':'6178.T', #'6178.JP'
              'ゆうちょ銀':'7182.T', #'7182.JP'
              '日本製鉄':'5401.T', #'5401.JP'
              }
def plot_pbrper(pbr, per, name):
    x_avg = 14
    y_avg = 1
    y = np.linspace(0,30,100)
    y_ = np.linspace(1,1,100)
    x = np.linspace(0.,2.5,100)
    #x_ = np.linspace(14,14,100)
    x_ = np.linspace(x_avg,x_avg,100)
    x_1 = np.linspace(np.average(per),np.average(per),279)
    x_2 = np.linspace(np.average(pbr),np.average(pbr),279)
    x_3 = np.linspace(0, 0, len(x_1), dtype=float)
    per_mean, per_var, per_var_, pbr_mean, pbr_var, pbr_var_ = x_3,x_3,x_3,x_3,x_3,x_3
    try:
        per_mean = np.linspace(statistics.mean(per), statistics.mean(per), len(x_1), dtype=float)
        per_var = per_mean + 2*np.linspace(np.sqrt(statistics.variance(per)), np.sqrt(statistics.variance(per)), len(x_1), dtype=float)
        per_var_ = per_mean - 2*np.linspace(np.sqrt(statistics.variance(per)), np.sqrt(statistics.variance(per)), len(x_1), dtype=float)
        pbr_mean = np.linspace(statistics.mean(pbr), statistics.mean(pbr), len(x_2), dtype=float)
        pbr_var = pbr_mean + 2*np.linspace(np.sqrt(statistics.variance(pbr)), np.sqrt(statistics.variance(pbr)), len(x_2), dtype=float)
        pbr_var_ = pbr_mean - 2*np.linspace(np.sqrt(statistics.variance(pbr)), np.sqrt(statistics.variance(pbr)), len(x_2), dtype=float)
        '''
        fig, (ax1,ax2,ax3) = plt.subplots(3,1,figsize=(1.6180 * 4, 4*2))
        ax3.plot(per)
        ax3.plot(per.index,x_1)
        ax3.plot(per.index,per_var)
        ax3.plot(per.index,per_var_)
        ax3.set_xlabel("period")
        ax3.set_ylabel('per')
        ax2.plot(pbr)
        ax2.plot(pbr.index,x_2)
        ax2.plot(pbr.index,pbr_var)
        ax2.plot(pbr.index,pbr_var_)
        ax2.set_xlabel("period")
        ax2.set_ylabel('pbr')
        ax1.plot(per, pbr, 'o', label = name)
        ax1.set_xlabel("per")
        ax1.set_ylabel('pbr')
        ax1.plot(x_, x)
        ax1.plot(y,y_)
        ax1.plot(x_avg, y_avg, 'o')
        #ax1.set_ylim(0.5,2.5)
        #ax1.set_xlim(0,30)
        ax1.legend()
        '''
    except:
        pass

    return per_mean, per_var, per_var_, pbr_mean, pbr_var, pbr_var_
ideal_close_per = []
# ideal_close_pbr = []
ideal_close_per_var = []
ideal_close_per_var_ = []
per_i = []
pbr_i = []
roe_i = []
eps_i = []
name_i =[]
close_i = []
df_ideal = pd.DataFrame()
for name, stock in stock_dict.items():
print(name)
ticker = yf.Ticker(stock)
hist = ticker.history(period="max")
financials = ticker.financials
balance_sheet = ticker.balance_sheet
eps = financials.T["Net Income"] / balance_sheet.T["Share Issued"]
roe = financials.T["Net Income"] / balance_sheet.T["Stockholders Equity"]
per = hist["Close"]["2023-03-20":"2024-05-09"] / eps[financials.columns[0]]
pbr = roe[financials.columns[0]] * per
per_mean, per_var, per_var_, pbr_mean, pbr_var, pbr_var_ = plot_pbrper(pbr,per, name)
ideal_close_per.append(per_mean[0]*eps[financials.columns[0]])
ideal_close_per_var.append(per_var[0]*eps[financials.columns[0]])
ideal_close_per_var_.append(per_var_[0]*eps[financials.columns[0]])
per_i.append(per_mean[0])
pbr_i.append(pbr_mean[0])
roe_i.append(pbr_mean[0]/per_mean[0])
eps_i.append(eps[financials.columns[0]])
close_i.append(hist["Close"]["2024-05-09"])
name_i.append(name)
df_ideal['close'] = close_i
df_ideal['ideal_close_per'] = ideal_close_per
# df_ideal['ideal_close_pbr'] = ideal_close_pbr
df_ideal['ideal_close_per_var'] = ideal_close_per_var
df_ideal['ideal_close_per_var_'] = ideal_close_per_var_
df_ideal['per'] = per_i
df_ideal['pbr'] = pbr_i
df_ideal['roe'] = roe_i
df_ideal['eps'] = eps_i
df_ideal.index = name_i
df_ideal_ = df_ideal.dropna()
df_ideal_.rename(columns={'close':'最新株価',
'ideal_close_per': '目標株価',
'ideal_close_per_var':'上値',
'ideal_close_per_var_':'下値',
}, inplace= True)
df_ideal_order = df_ideal_.sort_values(['目標株価'], ascending=False)
#df_ideal_order
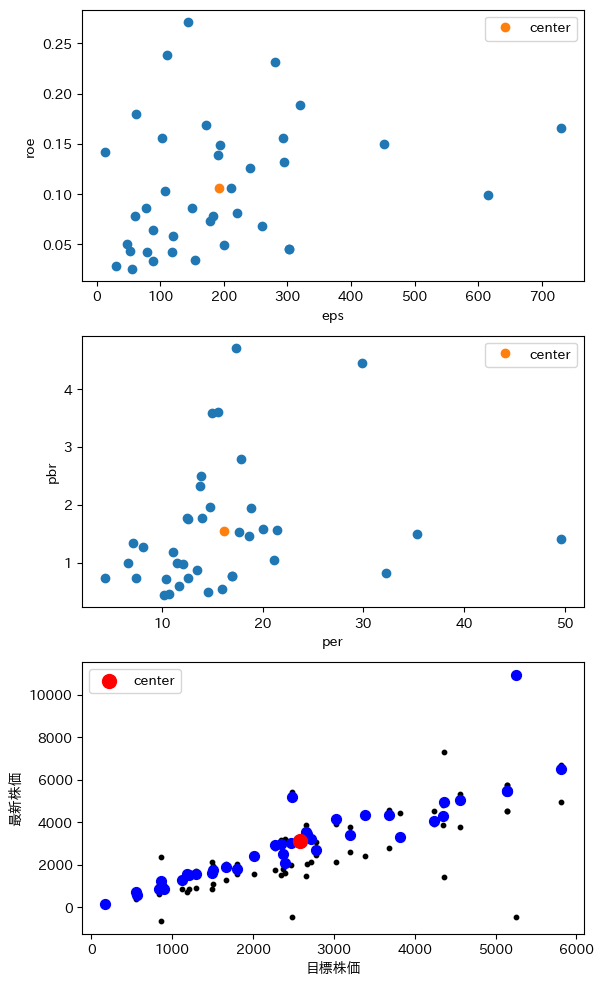
eps_mean = np.mean(df_ideal_order['eps'])
roe_mean = np.mean(df_ideal_order['roe'])
per_mean = np.mean(df_ideal_order['per'])
pbr_mean = np.mean(df_ideal_order['pbr'])
目標株価_mean = np.mean(df_ideal_order['目標株価'])
最新株価_mean = np.mean(df_ideal_order['最新株価'])
fig, (ax1,ax2, ax3) = plt.subplots(3,1,figsize=(1.6180 * 4, 4*3))
ax1.plot(df_ideal_order['eps'], df_ideal_order['roe'], 'o')
ax1.plot(eps_mean, roe_mean, 'o', label = 'center')
ax1.set_xlabel("eps")
ax1.set_ylabel('roe')
ax1.legend()
ax2.plot(df_ideal_order['per'], df_ideal_order['pbr'], 'o')
ax2.plot(per_mean, pbr_mean, 'o', label = 'center')
ax2.set_xlabel("per")
ax2.set_ylabel('pbr')
ax2.legend()
ax3.scatter(df_ideal_order['目標株価'], df_ideal_order['上値'], s=10, c="k", marker='o') #, s=25)
ax3.scatter(df_ideal_order['目標株価'], df_ideal_order['下値'], s=10, c="k", marker= 'o') #, s=25)
ax3.scatter(df_ideal_order['目標株価'], df_ideal_order['最新株価'], s=50, c="b", marker= 'o') #, s=50)
ax3.scatter(目標株価_mean, 最新株価_mean, s=100, c="r" , marker='o', label = 'center') #, s=100)
ax3.set_xlabel("目標株価")
ax3.set_ylabel('最新株価')
ax3.legend()
df_ideal_order
目標株価でソート
	        最新株価	目標株価	上値	    下値	     per	    pbr	        roe	      eps
安川電機	6503.000000	5809.010971	6676.878353	4941.143590	29.917309	4.458165	0.149016	194.168898
TOWA	    10940.00000	5251.862234	10965.01118	-461.286715	17.895320	2.784129	0.155579	293.476857
AGC	        5448.000000	5139.014255	5730.066032	4547.962477	16.982278	0.772176	0.045469	302.610419
JFE	        5448.000000	5139.014255	5730.066032	4547.962477	16.982278	0.772176	0.045469	302.610419
住友精化	5050.000000	4558.585176	5323.584655	3793.585697	7.413521	0.735022	0.099146	614.901485
東エレデバ	4975.000000	4355.308915	7286.283021	1424.334809	15.547977	3.606102	0.231934	280.120626
KDDI	    4283.000000	4348.760318	4811.416941	3886.103695	14.781405	1.954929	0.132256	294.204794
武田薬品	4070.000000	4232.588129	4533.791097	3931.385160	21.125704	1.053994	0.049892	200.352523
太陽誘電	3321.000000	3818.398336	4431.167244	3205.629428	21.417386	1.561267	0.072897	178.284986
キヤノン	4338.000000	3675.004369	4582.806637	2767.202101	20.091681	1.574501	0.078366	182.911743
JT	        4342.000000	3384.973354	4343.387159	2426.559548	14.037116	1.767538	0.125919	241.144500
日本製鉄	3410.000000	3193.874283	3794.854187	2592.894380	4.373396	0.725926	0.165987	730.296086
住友商事	4159.000000	3021.430688	3900.439105	2142.422270	6.690879	1.000534	0.149537	451.574548
日本航空	2711.500000	2778.897753	3087.286762	2470.508745	35.289693	1.488172	0.042170	78.745309
三井住友ト	3216.000000	2711.482387	3309.767845	2113.196929	10.453331	0.714847	0.068385	259.389323
オリックス	3426.000000	2669.875546	3318.730417	2021.020676	12.073218	0.982217	0.081355	221.140337
トヨタ	    3528.000000	2658.649015	3866.833686	1450.464345	17.694899	1.530621	0.086501	150.249457
野村マイクロ	5170.000000	2482.992727	5415.064539	-449.079085	17.364354	4.711409	0.271326	142.993671
三菱マ  	3019.000000	2467.795876	2968.404677	1967.187074	15.961108	0.546903	0.034265	154.613065
セガサミ	2084.500000	2399.555217	3195.384511	1603.725923	12.600537	1.747072	0.138651	190.432781
ルネサス	2503.500000	2367.999826	2922.843305	1813.156348	13.757969	2.317010	0.168412	172.118414
鹿島建設	2990.500000	2342.343251	3174.272141	1510.414362	11.077063	1.176604	0.106220	211.458865
丸紅	    2931.000000	2275.540891	2800.571365	1750.510417	7.117424	1.342984	0.188690	319.714107
NTTD	    2397.500000	2014.921960	2461.570482	1568.273438	18.844294	1.945740	0.103254	106.924777
LIXIL	    1793.000000	1797.614175	2027.937213	1567.291137	32.275179	0.825208	0.025568	55.696489
ソフトバンク	1883.500000	1664.662140	2034.728624	1294.595657	14.997157	3.581652	0.238822	110.998514
本田技研	1748.000000	1508.267334	1931.618785	1084.915884	12.582367	0.732848	0.058244	119.871513
世紀東急	1625.000000	1494.567121	2128.248022	860.886219	49.630379	1.410324	0.028417	30.113957
ゆうちょ銀	1571.500000	1287.406892	1691.642615	883.171170	14.613956	0.494073	0.033808	88.094344
郵政	    1506.000000	1207.557278	1569.654378	845.460177	10.246691	0.438299	0.042775	117.848508
三菱UFJ	1583.500000	1187.621313	1652.548645	722.693982	13.495969	0.874467	0.064795	87.998222
東洋建設	1286.000000	1117.674607	1396.302279	839.046935	18.648563	1.468681	0.078756	59.933550
アルヒ	    850.000000	899.970664	1047.364783	752.576545	11.514710	0.991042	0.086067	78.158345
住石HD	    1237.000000	862.985282	2382.691848	-656.721284	13.859740	2.496128	0.180099	62.265620
ユ海運  	848.000000	834.813117	1028.877653	640.748581	8.150281	1.267105	0.155468	102.427530
日産自	    576.500000	563.817818	659.737819	467.897816	10.724265	0.463437	0.043214	52.574029
ENEOS	    706.099976	556.250332	728.844971	383.655693	11.734514	0.589903	0.050271	47.402928
NTT	        167.899994	168.105768	186.059901	150.151636	12.547877	1.777994	0.141697	13.397148
最新株価vs目標株価
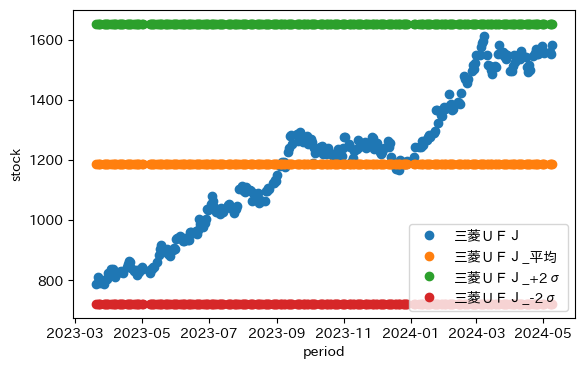
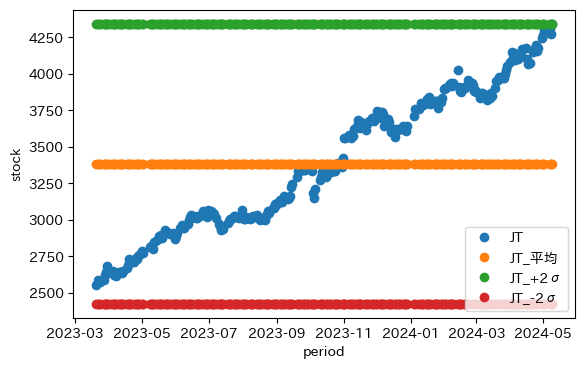
株価変動
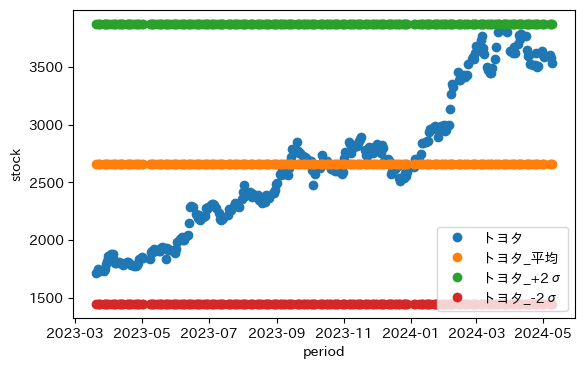
def plot_stockstock(name, close, ideal_sktock, ideal_up, ideal_down):
    close_ = pd.DataFrame()
    close_ = close["2023-03-20":"2024-05-09"]

    x_1 = np.linspace(np.average(ideal_sktock),np.average(ideal_sktock),len(close_))
    x_2 = np.linspace(np.average(ideal_up),np.average(ideal_up),len(close_))
    x_3 = np.linspace(np.average(ideal_down),np.average(ideal_down),len(close_))

    fig, (ax1) = plt.subplots(1,1,figsize=(1.6180 * 4, 4*1))
    ax1.plot(close_.index, close_, 'o', label = name)
    ax1.plot(close_.index, x_1, 'o', label = name + '_平均')
    ax1.plot(close_.index, x_2, 'o', label = name + '_+2σ')
    ax1.plot(close_.index, x_3, 'o', label = name + '_-2σ')
    ax1.set_xlabel("period")
    ax1.set_ylabel('stock')
    ax1.legend()
...
for name, stock in stock_dict.items():
...
    plot_stockstock(name, hist["Close"], per_mean[0]*eps[financials.columns[0]], per_var[0]*eps[financials.columns[0]], per_var_[0]*eps[financials.columns[0]])


まとめ
・目標株価を計算してみた。割と±2σが良いリトレースメントになっている
・perベースの目標株価を求めてみた
・株価vs目標株価のグラフは直線的である
・roe vs epsやpbr vs perは、購入時の参考になりそう
・そもそも目標株価の求め方を精査する余地がある
・配当や設備投資を目標株価の算定に反映したい