先日、散布図だけ紹介したIrisデータを決定木とRandomForestで分類し、意味を考えてみた。
【参考】
①散布図行列を描くには (corrplot, pairs, GGally)
②R超入門 - Rのインストールから決定木とランダムフォレストによる分析まで
③R/RStudio入門
やったこと
・irisデータ概観
・散布図描画
・決定木で表示
・randomForestを表示
・irisデータを決定木に基いて確認
・類似度に基づく多次元尺度法
・irisデータ概観
Rでirisデータ概観は以下のような簡単なスクリプトで表示できます。
irisdata <- iris
dim(irisdata)
head(irisdata)
summary(irisdata)
まず、サイズは150個ずつ5列のデータからできています。
そして、最初の6個までは以下のようなデータになっています。
> dim(irisdata)
[1] 150   5
> head(irisdata)
  Sepal.Length Sepal.Width Petal.Length Petal.Width Species
1          5.1         3.5          1.4         0.2  setosa
2          4.9         3.0          1.4         0.2  setosa
3          4.7         3.2          1.3         0.2  setosa
4          4.6         3.1          1.5         0.2  setosa
5          5.0         3.6          1.4         0.2  setosa
6          5.4         3.9          1.7         0.4  setosa
それぞれの列の最小値、第一四分位値、中央値、平均、第三四分位値、そして最大値が以下のとおりです。
Speciesはそれぞれの個数が表示されています。
> summary(irisdata)
  Sepal.Length    Sepal.Width     Petal.Length    Petal.Width     Species
 Min.   :4.300   Min.   :2.000   Min.   :1.000   Min.   :0.100   setosa    :50
 1st Qu.:5.100   1st Qu.:2.800   1st Qu.:1.600   1st Qu.:0.300   versicolor:50
 Median :5.800   Median :3.000   Median :4.350   Median :1.300   virginica :50
 Mean   :5.843   Mean   :3.057   Mean   :3.758   Mean   :1.199
 3rd Qu.:6.400   3rd Qu.:3.300   3rd Qu.:5.100   3rd Qu.:1.800
 Max.   :7.900   Max.   :4.400   Max.   :6.900   Max.   :2.500
・散布図描画
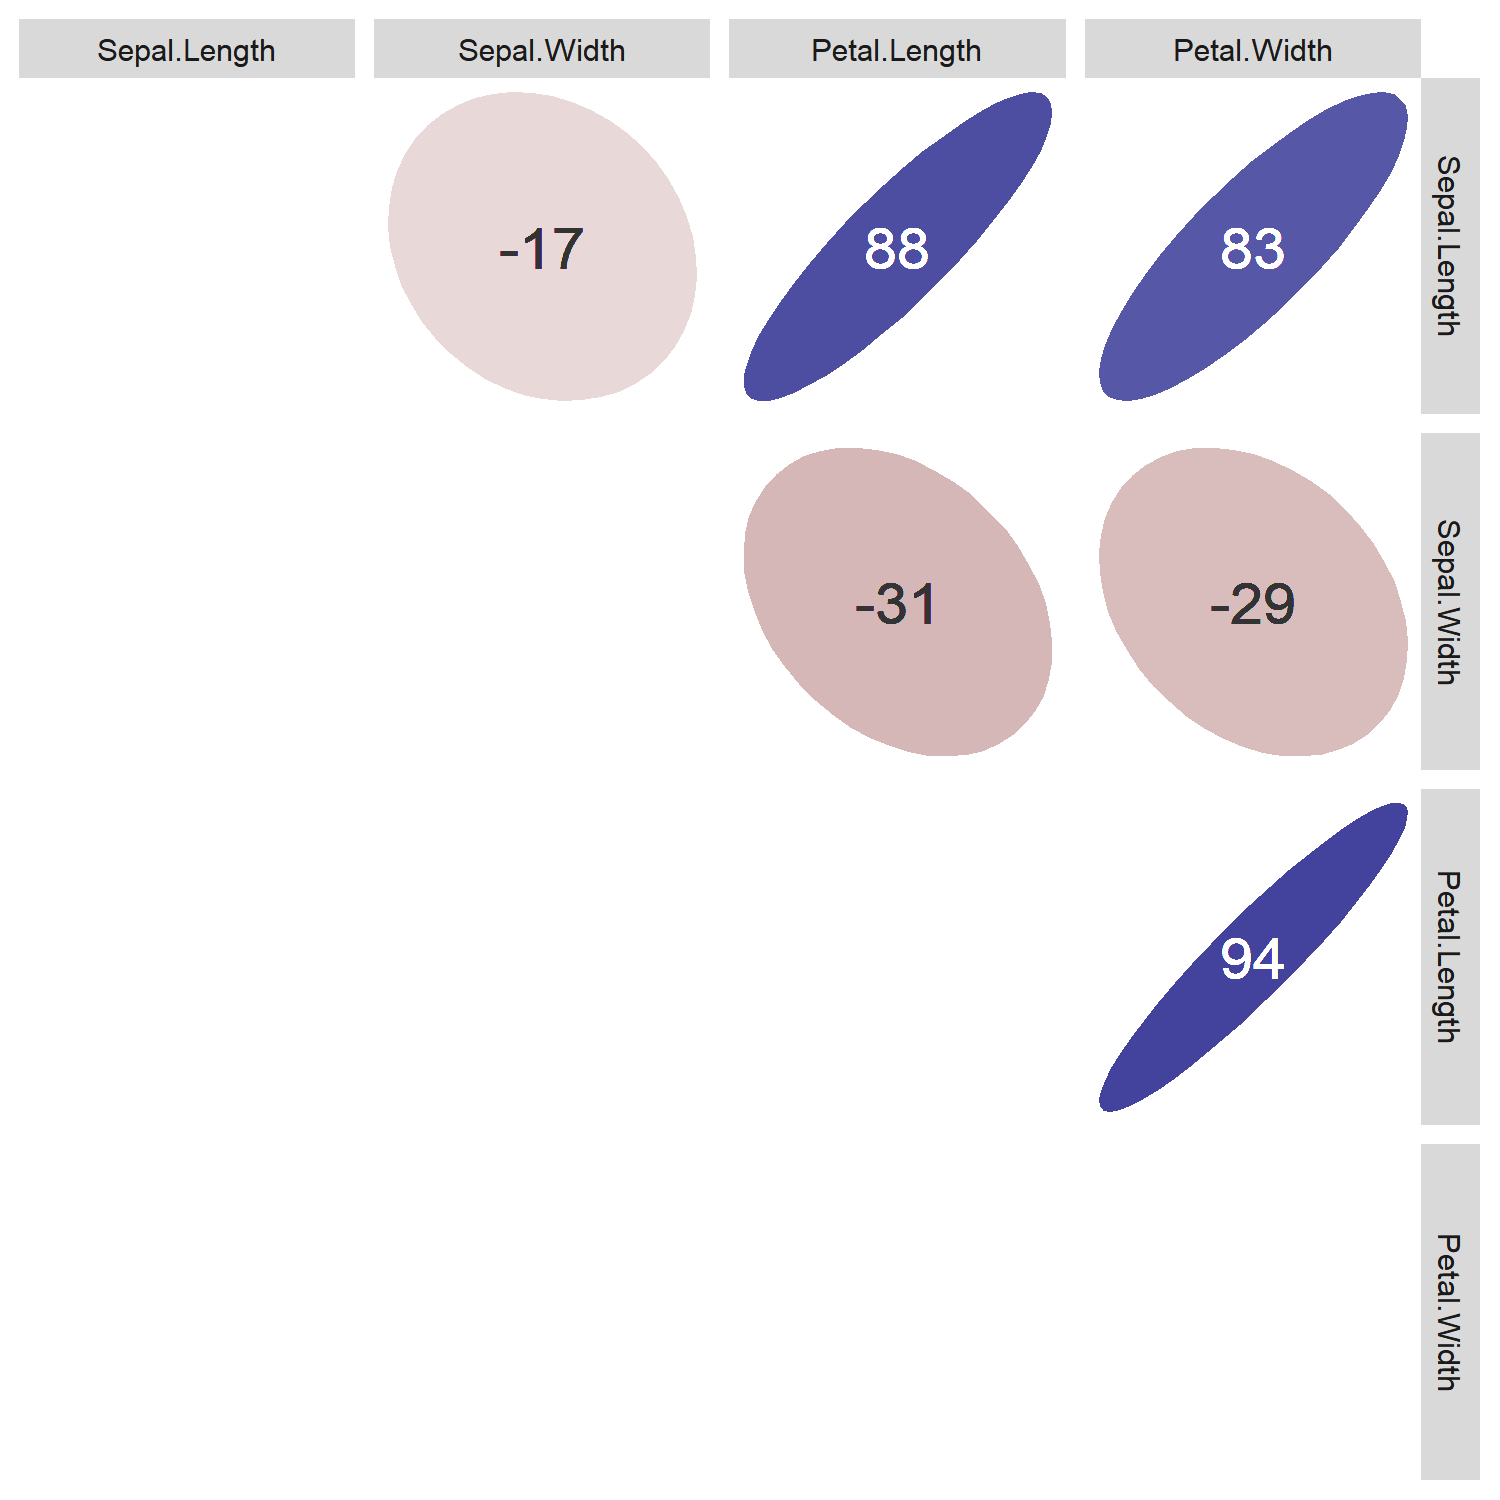
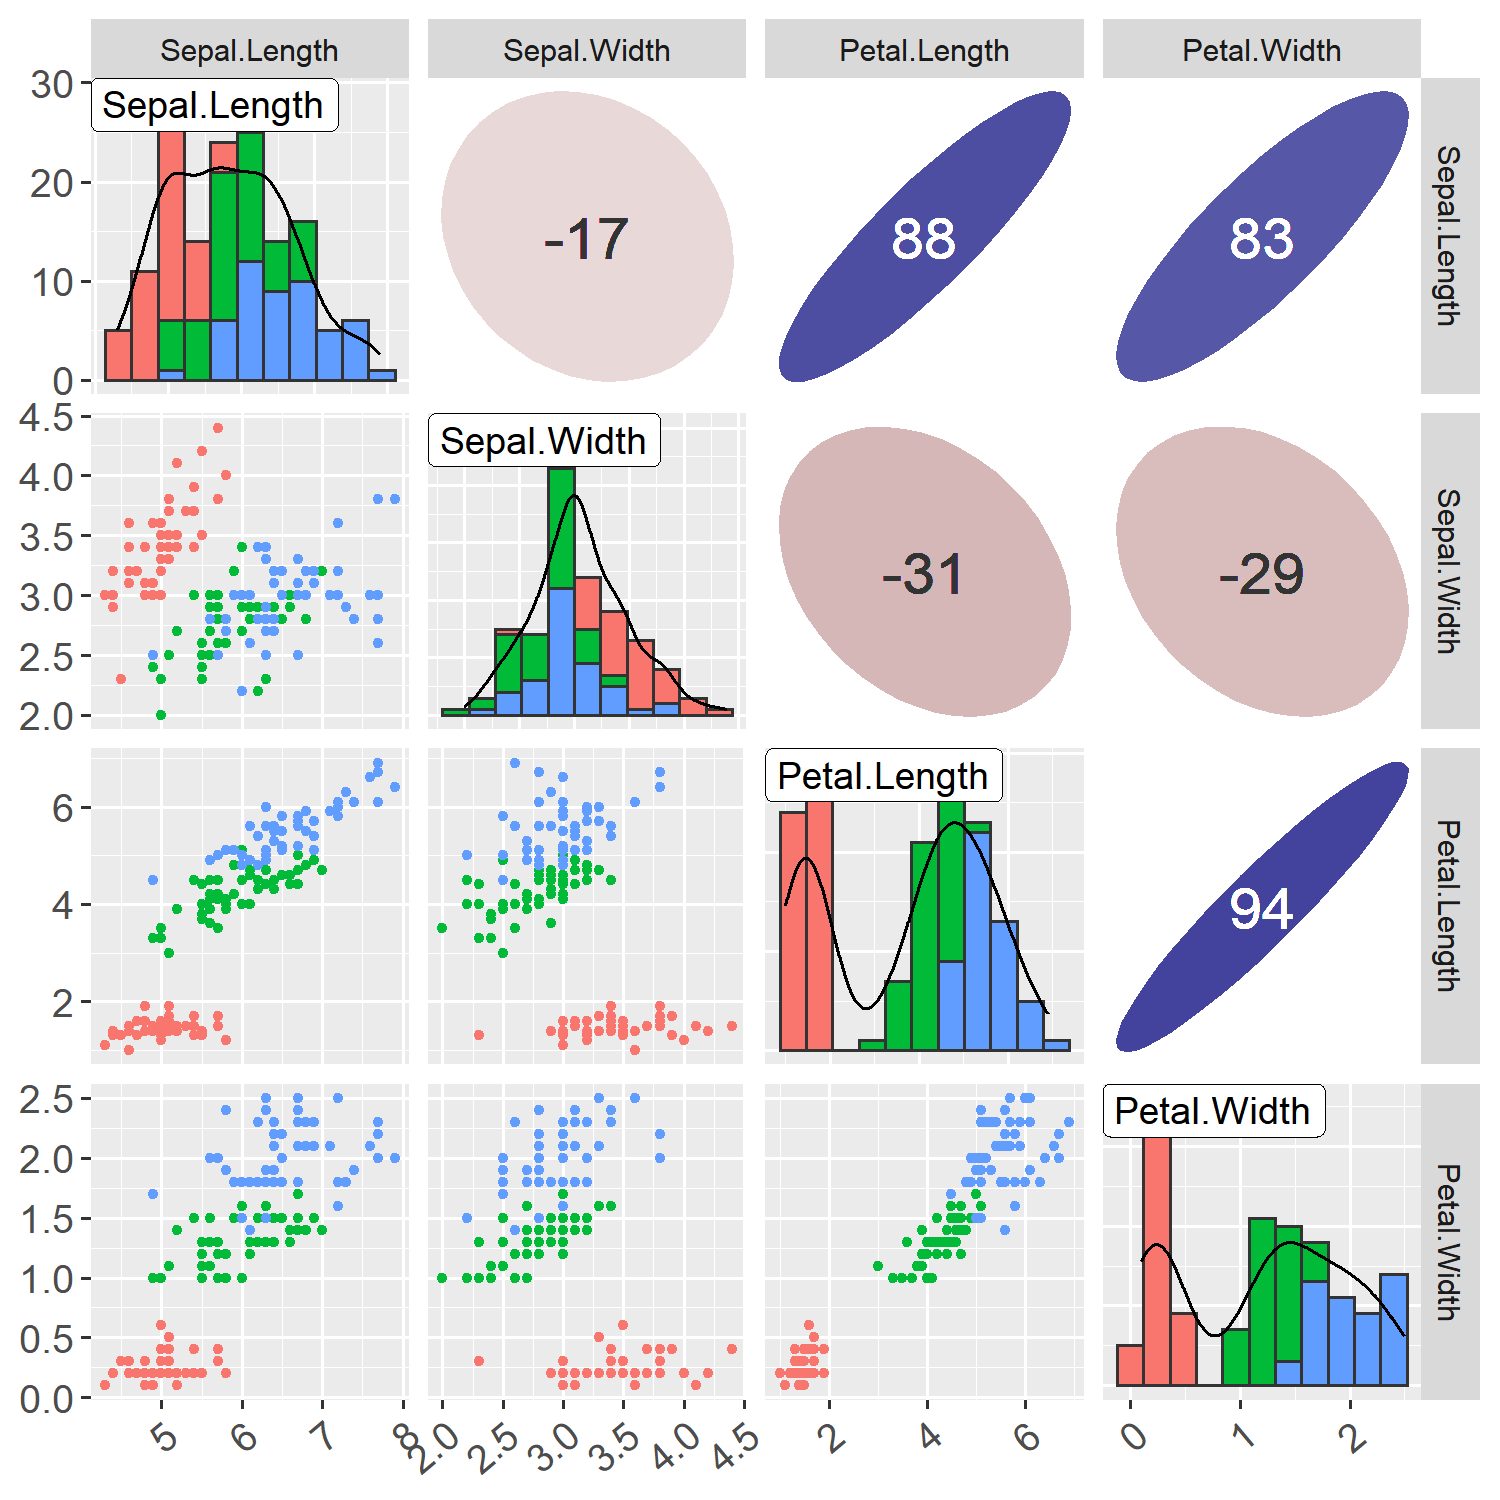
今回は、参考①の最後のggplot.Rとし、主要な部分を以下のように4つの部分に分けて出力してみた。
参考①のコードなので解説は控えることとするが大体やっていることは見えると思う。
library(ggplot2)
library(GGally)
d <- iris
d <- d[,-ncol(d)]
N_col <- ncol(d)
ggp <- ggpairs(d, upper='blank', diag='blank', lower='blank')
png(file='ggally_0.png', res=250, w=1500, h=1500)
print(ggp, left=0.3, bottom=0.3)
dev.off()

for(i in 1:N_col) {
  x <- d[,i]
  p <- ggplot(data.frame(x, gr=iris$Species), aes(x))
  p <- p + theme(text=element_text(size=14), axis.text.x=element_text(angle=40, vjust=1, hjust=1))
  if (class(x) == 'factor') {
    p <- p + geom_bar(aes(fill=gr), color='grey20')
  } else {
    bw <- (max(x)-min(x))/10
    p <- p + geom_histogram(binwidth=bw, aes(fill=gr), color='grey20')
    p <- p + geom_line(eval(bquote(aes(y=..count..*.(bw)))), stat='density')
  }
  p <- p + geom_label(data=data.frame(x=-Inf, y=Inf, label=colnames(d)[i]), aes(x=x, y=y, label=label), hjust=0, vjust=1)
  ggp <- putPlot(ggp, p, i, i)
}

zcolat <- seq(-1, 1, length=81)
zcolre <- c(zcolat[1:40]+1, rev(zcolat[41:81]))

for(i in 1:(N_col-1)) {
  for(j in (i+1):N_col) {
    x <- as.numeric(d[,i])
    y <- as.numeric(d[,j])
    r <- cor(x, y, method='spearman', use='pairwise.complete.obs')
    zcol <- lattice::level.colors(r, at=zcolat,
                                  col.regions=colorRampPalette(c(scales::muted('red'), 'white', scales::muted('blue')), space='rgb')(81))
    textcol <- ifelse(abs(r) < 0.4, 'grey20', 'white')
    ell <- ellipse::ellipse(r, level=0.95, type='l', npoints=50, scale=c(.2, .2), centre=c(.5, .5))
    p <- ggplot(data.frame(ell), aes(x=x, y=y))
    p <- p + theme_bw() + theme(
      plot.background=element_blank(),
      panel.grid.major=element_blank(), panel.grid.minor=element_blank(),
      panel.border=element_blank(), axis.ticks=element_blank()
    )
    p <- p + geom_polygon(fill=zcol, color=zcol)
    p <- p + geom_text(data=NULL, x=.5, y=.5, label=100*round(r, 2), size=6, col=textcol)
    ggp <- putPlot(ggp, p, i, j)
  }
}

for(j in 1:(N_col-1)) {
  for(i in (j+1):N_col) {
    x <- d[,j]
    y <- d[,i]
    p <- ggplot(data.frame(x, y, gr=iris$Species), aes(x=x, y=y, color=gr))
    p <- p + theme(text=element_text(size=14), axis.text.x=element_text(angle=40, vjust=1, hjust=1))
    if (class(x) == 'factor') {
      p <- p + geom_boxplot(aes(group=x), alpha=3/6, outlier.size=0, fill='white')
      p <- p + geom_point(position=position_jitter(w=0.4, h=0), size=1)
    } else {
      p <- p + geom_point(size=1)
    }
    ggp <- putPlot(ggp, p, i, j)
  }
}
 ということで、全体として、以下の散布図が得られる。
この図は以下の決定木の解釈で利用する。

### ・決定木を表示
参考②を見ると、Rで簡単に決定木で分類が出来そうである。
これを以下のコードでIrisデータに適用してみた。
そして、上の散布図と比較することにより、解釈しようと思う。
まず、出力が一番シンプルなので、Speciesの列の分析結果を示す。
ということで、全体として、以下の散布図が得られる。
この図は以下の決定木の解釈で利用する。

### ・決定木を表示
参考②を見ると、Rで簡単に決定木で分類が出来そうである。
これを以下のコードでIrisデータに適用してみた。
そして、上の散布図と比較することにより、解釈しようと思う。
まず、出力が一番シンプルなので、Speciesの列の分析結果を示す。
irisdata <- iris
library(rpart)
model = rpart(Species ~ ., data = irisdata)
print(model)
library(rpart.plot)
rpp <- rpart.plot(model, extra = 1)
pngFileName <- paste("./fig_iris/iris_species.png",sep="")
png(file=pngFileName, res=250, w=1500, h=1500)
rpp <- rpart.plot(model, extra = 1)
dev.off()
【参考】
④Rと樹木モデル(1)
参考④の解説より引用
node)は分岐のノード(節)の番号、
splitは分岐の条件、
nはそのノードに含まれている個体の数、
devianceはその節の分岐基準尤離度である。
yvalはその節の被説明変数値で、判別分析の場合はグループの名前となる。星印が付いている行は端末の節であり、葉とも呼ぶ。
print(model)
の結果は以下のとおりであるが、上記の解説のとおりの意味で読み取れると思う。
n= 150
node), split, n, loss, yval, (yprob)
      * denotes terminal node
1) root 150 100 setosa (0.33333333 0.33333333 0.33333333)
  2) Petal.Length< 2.45 50   0 setosa (1.00000000 0.00000000 0.00000000) *
  3) Petal.Length>=2.45 100  50 versicolor (0.00000000 0.50000000 0.50000000)
    6) Petal.Width< 1.75 54   5 versicolor (0.00000000 0.90740741 0.09259259) *
    7) Petal.Width>=1.75 46   1 virginica (0.00000000 0.02173913 0.97826087) *
rpp <- rpart.plot(model, extra = 1)
の結果は以下のとおり。情報量は上記のものと同一だが、この決定木の方が分かり易い。
※下でも決定木だと上記の(yprob)の情報はないみたい
この図と、上記の散布図を見比べると、
①散布図Petal.Lengthを見ると、2.5より小さい領域に赤い棒グラフが集中していて、これがsetosaであり、それより大きい領域が緑と青の棒グラフになっている
②次に散布図Petal.Widthを見ると、1.8より大きい領域ではほぼ青の棒グラフとなっている
③さらにこの領域には一個の緑と45個の青が入っているというのが決定木から分かる。
一方、1.8より小さい領域には緑49個で青5個含むことが決定木から分かる

extraを指定無しと1~11まで変えてみる
これは余分な情報だが、決定木の表示の仕方は以下のようにいろいろ変更できる。
rpp <- rpart.plot(model, extra = n)
| - | 1 | 2 | 3 |
|---|---|---|---|
 |
 |
 |
 |
| 4 | 5 | 6 | 7 |
 |
 |
 |
 |
| 8 | 9 | 10 | 11 |
 |
 |
 |
 |
・randomForestを表示
ランダムフォレストでも回帰に基いた分類ができる。
ランダムフォレストも参考のように奥が深いが一部の分析を見ることとする。
【参考】
⑤random Forest
⑥Package ‘randomForest’
⑦How to interpret Mean Decrease in Accuracy and Mean Decrease GINI in Random Forest models
コードは以下のとおり、シンプルである。
library(randomForest)
set.seed(22)
model = randomForest(Species ~ ., data = irisdata, importance = TRUE, proximity = TRUE)
print(model)
print(importance(model))
print(varImpPlot(model))
rpp2 <- varImpPlot(model)
varFileName <- paste("./fig_iris/iris_species_var.png",sep="")
png(file=varFileName, res=250, w=1500, h=1500)
rpp2 <- varImpPlot(model)
dev.off()
コードはシンプルだが、内容を理解するのはウワンには難しいので、参考⑤の解説から以下を引用する。
※ここでimportance = TRUEは重要で以下の結果でimportance(model)のとき、以下の説明の[2]MeanDecreaseAccuracy を出力してくれるようになる
set.seed(22) # bootstrapで同じ結果を出すために設定
model = randomForest(Species ~ ., data = irisdata, importance = TRUE, proximity = TRUE)
変数の重要度(寄与度)の計算
決定木を構築する際に該当変数をモデルから除いた際
[1]クラス毎の予測精度の低下
[2]全体での予測精度の低下(Mean Decrease Accuracy)
[3]Gini indexの減少(Mean Decrease Gini)を出力
※Gini indexが分かりませんでした(参考をゆっくり読めば分かりそうです)
“measure how often a randomly chosen element from the set would be incorrectly labeled”
【参考】
・Decision tree learning
・Gini Index vs Information Entropy
print(model)
結果は以下のとおりです。このConfusion matrixを見ると分類ができているのが分かります。
Call:
 randomForest(formula = Species ~ ., data = irisdata, , importance = TRUE, proximity = TRUE)
               Type of random forest: classification
                     Number of trees: 500
No. of variables tried at each split: 2

        OOB estimate of  error rate: 4%
Confusion matrix:
           setosa versicolor virginica class.error
setosa         50          0         0        0.00
versicolor      0         47         3        0.06
virginica       0          3        47        0.06
print(importance(model))
以下の出力からそれぞれのクラスの分類寄与が分かります。
                setosa versicolor virginica MeanDecreaseAccuracy MeanDecreaseGini
Sepal.Length  6.421139  7.2896905  8.403578            10.794891         9.581491
Sepal.Width   4.543170  0.1912472  3.148184             4.126903         2.272365
Petal.Length 22.730977 33.9143844 29.741766            34.995265        45.296610
Petal.Width  21.919488 32.6823609 30.426018            33.454326        42.066402
print(varImpPlot(model))
以下でも同様にそれぞれの指数の大きさで寄与度が分かります。
散布図見ても、Sepal.LengthとSepal.Widthのグラフは3つの種が混ざっていて、分類への寄与は低いとみて取れる感覚と一致しています。
                  MeanDecreaseAccuracy MeanDecreaseGini
Sepal.Length            10.794891         9.581491
Sepal.Width              4.126903         2.272365
Petal.Length            34.995265        45.296610
Petal.Width             33.454326        42.066402
・irisデータを決定木に基いて確認
やはり実際のデータを見たいなということで、Rstudio使って、実際にデータを確認します。上記の参考③を参考にします。
データは、
①「Environmentのところにあるiris.dataをクリックすると、そのデータセットを見ることができます。」
②Filterを押すと、以下のような表示ができます。

③ここまで来るとエクセルと同じですね。。上記の決定木の順に数字を入れてデータを表示していきます。
以下の表はPetal.Length>2.5とPetal.Width>1.8で抽出した表です。
表の下に以下の文言から決定木と同じ結果となり、データが見えました。
※Showing 1 to 19 of 46 entries, 5 total columns (filtered from 150 total entries)
結果として確かに最上段にあるversicolorの1個はPetal.Lengthなど4つのデータから他のものと分離することは出来ないです。

・類似度に基づく多次元尺度法
ここでは深入りしませんが、参考⑤で示されている図をやってみました。
rpp4 <- MDSplot(model, iris$Species)
結果は以下のとおりになります。
綺麗に三極に分離され、左側の第一極は離れています。
第二極と三極がなんとなく連結しているのが分かります。
そして、あの一個が右上の極近傍にあるのが分かります。
※一種の主成分分析だと思いますが、ここでは深入りしません。

まとめ
・irisデータをRの散布図、決定木、randomForestなどで遊んでみた
・意味のある分析がいろいろできそうなので適用してみようと思う
おまけ
・決定木を表示II
いろいろなクラスをターゲットに決定木を表示してみる。
library(rpart)
d <- iris
irisdata <- d[,-ncol(d)]
set_target = c("Sepal.Length", "Sepal.Width", "Petal.Length", "Petal.Width")
for (nm in set_target) {
    if (nm=="Sepal.Length"){
        model = rpart(Sepal.Length ~ ., data = irisdata)
        } else if (nm=="Sepal.Width"){
        model = rpart(Sepal.Width ~ ., data = irisdata)
        } else if (nm=="Petal.Length"){
        model = rpart(Petal.Length ~ ., data = irisdata)
        } else if (nm=="Petal.Width"){
        model = rpart(Petal.Width ~ ., data = irisdata)
        }
    print(model)
    library(rpart.plot)
    rpp <- rpart.plot(model, extra = 1)
    pngFileName <- paste("./fig_iris/iris_",nm,".png",sep="")
    png(file=pngFileName, res=250, w=1500, h=1500)
    rpp <- rpart.plot(model, extra = 1)
    dev.off()
}
model = rpart(Petal.Length ~ ., data = irisdata)
n= 150
node), split, n, deviance, yval
      * denotes terminal node
 1) root 150 464.325400 3.758000
   2) Petal.Width< 0.8 50   1.477800 1.462000 *
   3) Petal.Width>=0.8 100  67.476400 4.906000
     6) Petal.Width< 1.55 48  12.072500 4.262500
      12) Sepal.Length< 5.95 25   3.797600 3.936000 *
      13) Sepal.Length>=5.95 23   2.713043 4.617391 *
     7) Petal.Width>=1.55 52  17.180000 5.500000
      14) Sepal.Length< 7 40   5.796000 5.260000 *
      15) Sepal.Length>=7 12   1.400000 6.300000 *

model = rpart(Petal.Width ~ ., data = irisdata)
n= 150
node), split, n, deviance, yval
      * denotes terminal node
 1) root 150 86.5699300 1.199333
   2) Petal.Length< 2.45 50  0.5442000 0.246000 *
   3) Petal.Length>=2.45 100 17.8624000 1.676000
     6) Petal.Length< 4.75 45  1.5200000 1.300000 *
     7) Petal.Length>=4.75 55  4.7752730 1.983636
      14) Petal.Length< 5.05 13  0.4676923 1.730769 *
      15) Petal.Length>=5.05 42  3.2190480 2.061905 *

model = rpart(Sepal.Width ~ ., data = irisdata)
n= 150
node), split, n, deviance, yval
      * denotes terminal node
 1) root 150 102.1683000 5.843333
   2) Petal.Length< 4.25 73  13.1391800 5.179452
     4) Petal.Length< 3.4 53   6.1083020 5.005660
       8) Sepal.Width< 3.25 20   1.0855000 4.735000 *
       9) Sepal.Width>=3.25 33   2.6696970 5.169697 *
     5) Petal.Length>=3.4 20   1.1880000 5.640000 *
   3) Petal.Length>=4.25 77  26.3527300 6.472727
     6) Petal.Length< 6.05 68  13.4923500 6.326471
      12) Petal.Length< 5.15 43   8.2576740 6.165116
        24) Sepal.Width< 3.05 33   5.2218180 6.054545 *
        25) Sepal.Width>=3.05 10   1.3010000 6.530000 *
      13) Petal.Length>=5.15 25   2.1896000 6.604000 *
     7) Petal.Length>=6.05 9   0.4155556 7.577778 *

model = rpart(Sepal.Length ~ ., data = irisdata)
n= 150
node), split, n, deviance, yval
      * denotes terminal node
 1) root 150 28.3069300 3.057333
   2) Petal.Length>=2.45 100 10.9616000 2.872000
     4) Petal.Length< 4.05 16  0.7975000 2.487500 *
     5) Petal.Length>=4.05 84  7.3480950 2.945238
      10) Petal.Width< 1.95 55  3.4920000 2.860000
        20) Sepal.Length< 6.35 36  2.5588890 2.805556 *
        21) Sepal.Length>=6.35 19  0.6242105 2.963158 *
      11) Petal.Width>=1.95 29  2.6986210 3.106897
        22) Petal.Length< 5.25 7  0.3285714 2.914286 *
        23) Petal.Length>=5.25 22  2.0277270 3.168182 *
   3) Petal.Length< 2.45 50  7.0408000 3.428000
     6) Sepal.Length< 5.05 28  2.0496430 3.203571 *
     7) Sepal.Length>=5.05 22  1.7859090 3.713636 *
RandomForest
以下で、RandomForestで重要度などの追加の計算やグラフ生成、分析もできるが今回はコードのみとする。
library(randomForest)
d <- iris
irisdata <- d[,-ncol(d)]
set_target = c("Sepal.Length", "Sepal.Width", "Petal.Length", "Petal.Width")
for (nm in set_target) {
    if (nm=="Sepal.Length"){
        model = randomForest(Sepal.Length ~ ., data = irisdata, importance = TRUE, proximity = TRUE)
        } else if (nm=="Sepal.Width"){
        model = randomForest(Sepal.Width ~ ., data = irisdata, importance = TRUE, proximity = TRUE)
        } else if (nm=="Petal.Length"){
        model = randomForest(Petal.Length ~ ., data = irisdata, importance = TRUE, proximity = TRUE)
        } else if (nm=="Petal.Width"){
        model = randomForest(Petal.Width ~ ., data = irisdata, importance = TRUE, proximity = TRUE)
        }
    print(model)
    print(importance(model))
    print(varImpPlot(model))
    rpp2 <- varImpPlot(model)
    varFileName <- paste("./fig_iris/iris_var",nm,".png",sep="")
    png(file=varFileName, res=250, w=1500, h=1500)
    rpp2 <- varImpPlot(model)
    dev.off()
}

