はじめに
業務にて、Word文書上に複数のタイムチャートを作成する案件が発生。
(↓↓↓ こんなヤツを何通りか作成。)
直線・折れ線・矩形・テキストボックスの組み合わせですが、さすがにマウスでの描画はあり得ないのでIronPythonで描画してみました。
折角なので、Officeへの図形描画の一手法として、備忘録を兼ねて投稿します。
本稿では、Wordよりも需要がありそうなPowerPointへの図形描画を題材にしています。
描画位置・サイズの単位の違いや、同名のオブジェクトでも若干の差異があったりと、Officeアプリケーションごとに多少の違いはありますが、基本的にはWordやExcelでも同様に操作できます。
VBAで図形描画を扱った経験があれば、内容はわかりやすいかと思います。
作業環境
Windows 11 Pro 21H2
Microsoft Office 365
IronPython 2.7.12(https://ironpython.net/)(3.4.0b1でも動作確認済み)
Windows 10 以外では未確認ですが、多少古いWindows,Officeでも動作すると思います。
準備
次のファイル "MyPowerPoint.py" を
フォルダ "C:\Program Files\IronPython 2.7\Lib\site-packages"
に置きます。
import clr

clr.AddReference("Microsoft.Office.Interop.PowerPoint")
clr.AddReference("Microsoft.Office.Interop.Word")
clr.AddReference("Office")

from Microsoft.Office.Interop.PowerPoint import (ApplicationClass, PpAutoSize,
                                                 PpSlideLayout)
from Microsoft.Office.Interop.Word import WdColor
from Microsoft.Office.Core import (MsoAlignCmd, MsoArrowheadLength,
                                   MsoArrowheadStyle, MsoArrowheadWidth,
                                   MsoAutoShapeType, MsoEditingType,
                                   MsoFlipCmd, MsoLineDashStyle,
                                   MsoTextOrientation, MsoTriState)

PpApp = ApplicationClass(Visible=MsoTriState.msoTrue)
MyPpt = PpApp.Presentations.Add()
WdColor1列挙型を使えば色の設定が楽なのでimportします。
その他、定数類(Mso…)2は必要に応じて入れます。
ここでは、本記事で使用するものだけをimportしています。
PowerPointへの図形描画
(1) PowerPointの起動
IronPythonを起動したら、コンソールから次の1行でPowerPointが起動します。
from MyPowerPoint import *
ここで起動したPowerPointの Application オブジェクトはPpApp、Presentation オブジェクトはMyPptとして利用できます。
また、後半で必要になるのでSystem.Array3およびSystem.Single4をimportしておきます。
from System import Array, Single
(2) 新規空白スライドの挿入とスライドサイズの確認
描画用に空白スライドを挿入します。
また、念のためにスライドサイズも確認するとよいでしょう。
MySlide = MyPpt.Slides.Add(1, PpSlideLayout.ppLayoutBlank)
print(MyPpt.PageSetup.SlideWidth, MyPpt.PageSetup.SlideHeight)
「ワイド」で 960 × 540 ,「標準」の場合 720 × 540 かと思います。
ここまでの状態です。
普段はVS Codeのターミナルを利用しています。(クリックで拡大)
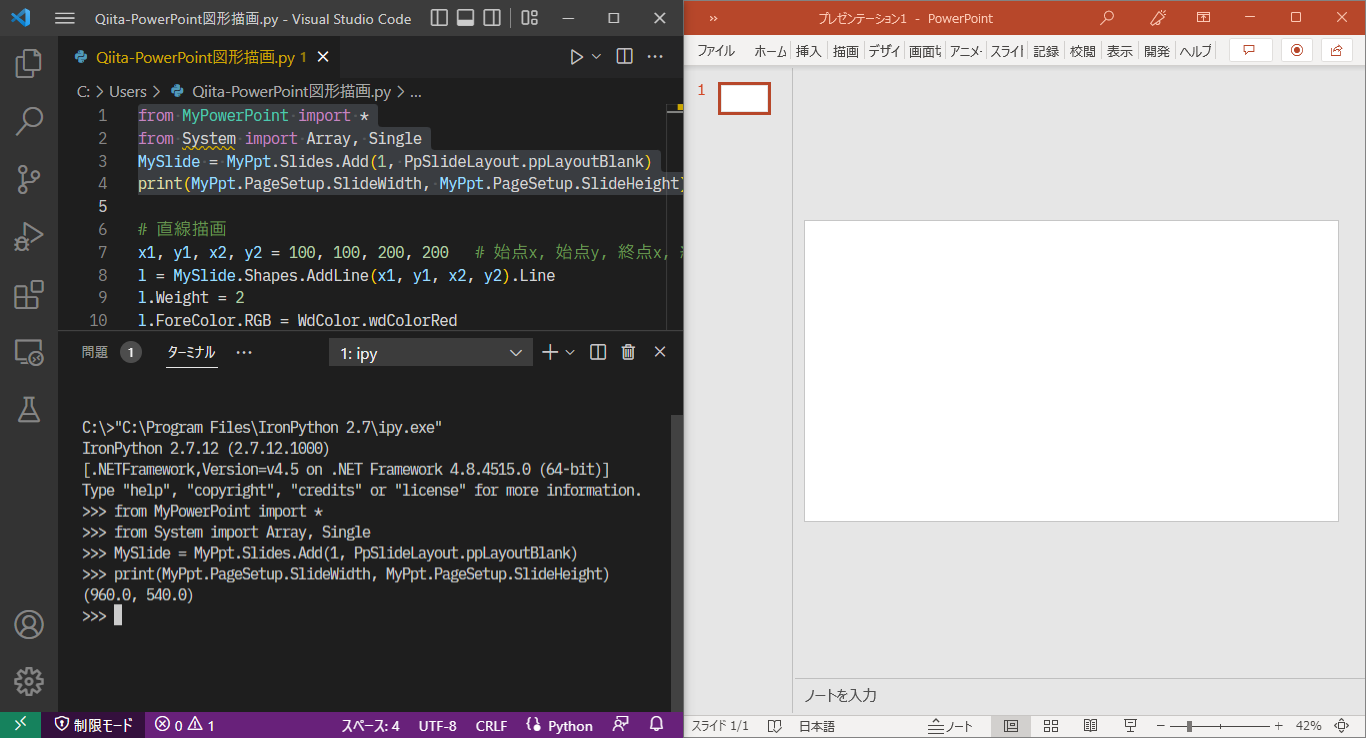
以下、例示するコードもIronPythonコンソールにコピペすることで動作確認ができます。
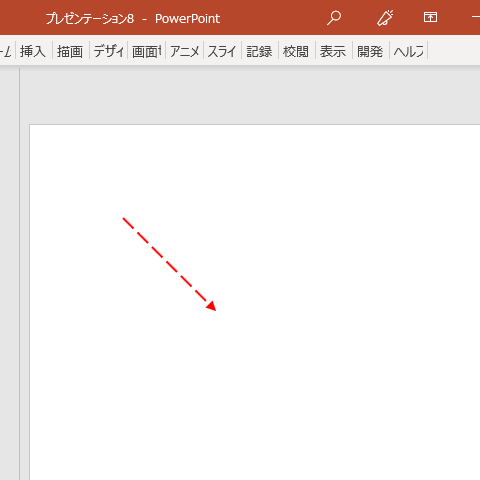
(3) 直線描画と設定例
太さ・色・線種・矢印を設定しています。
<位置に関する記述について>
便宜上、スライド左上を原点にして、右方向を x ,下方向を y と見ています。
x1, y1, x2, y2 = 100, 100, 200, 200   # 始点x, 始点y, 終点x, 終点y
l = MySlide.Shapes.AddLine(x1, y1, x2, y2).Line
l.Weight = 2
l.ForeColor.RGB = WdColor.wdColorRed
l.DashStyle = MsoLineDashStyle.msoLineLongDash
l.EndArrowheadStyle = MsoArrowheadStyle.msoArrowheadTriangle
l.EndArrowheadWidth = MsoArrowheadWidth.msoArrowheadWide
l.EndArrowheadLength = MsoArrowheadLength.msoArrowheadLong
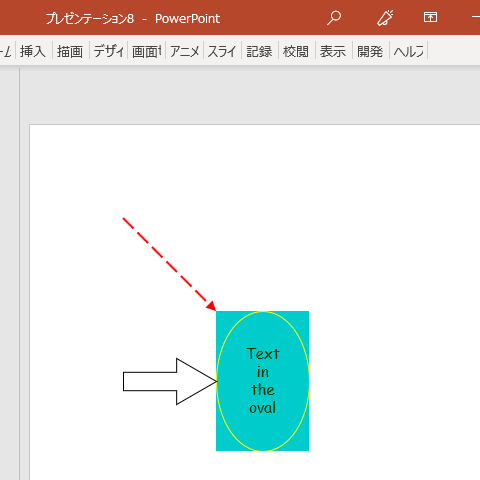
(4) オートシェイプ
矩形(Rectangle)を描画します。
描画には、オートシェイプの種類および、オートシェイプ左端位置・上端位置・幅・高さを与えます。
x, y, w, h = 200, 200, 100, 150     # 左端, 上端, 幅, 高さ
shape_type = MsoAutoShapeType.msoShapeRectangle
r = MySlide.Shapes.AddShape(shape_type, x, y, w, h)
r.Line.Visible = MsoTriState.msoFalse
r.Fill.ForeColor.RGB = 0xCCCC00     # 0xBBGGRR の順
整数を使って色の設定をする場合、16進表記が便利ですが、RGBの順序に注意します。

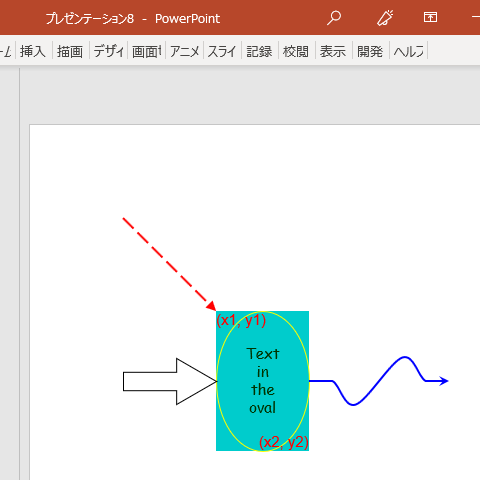
(5) 図形内テキスト
(4) の矩形の上に同サイズの楕円(Oval)を描画し、テキストを記入・書式設定してみます。
txt = "Text\rin\rthe\roval"
shape_type = MsoAutoShapeType.msoShapeOval
o = MySlide.Shapes.AddShape(shape_type, x, y, w, h)
o.Fill.Visible = MsoTriState.msoFalse
o.Line.ForeColor.RGB = WdColor.wdColorYellow
o.TextFrame.TextRange.Text = txt
o.TextFrame.TextRange.Font.Name = "Comic Sans MS"
o.TextFrame.TextRange.Font.Size = 16
o.TextFrame.TextRange.Font.Color = WdColor.wdColorDarkGreen

(6) オートシェイプ(アジャスタ付き)
アジャスタのあるオートシェイプの例として右向きブロック矢印を描画します。
軸をやや細めにし、先端の角度を60°に設定しました。(既定は90°)
x, y, w, h = 100, 250, 100, 50     # 左端, 上端, 幅, 高さ
shape_type = MsoAutoShapeType.msoShapeRightArrow
a = MySlide.Shapes.AddShape(shape_type, x, y, w, h)
a.Fill.Visible = MsoTriState.msoFalse
a.Line.ForeColor.RGB = WdColor.wdColorBlack
a.Adjustments[1] = 0.4              # 高さに対する軸幅の割合(0~1)
a.Adjustments[2] = 3.0**0.5 / 2.0   # 高さに対する先端部横幅の割合(0~):60°
(7) テキストボックス
(4) の矩形の左上に合わせて、横書きテキストボックスで文字を表示します。
txt = "(x1, y1)"
x, y, w, h = r.Left, r.Top, 0, 0     # 矩形左端, 矩形上端, 幅, 高さ
orientation = MsoTextOrientation.msoTextOrientationHorizontal
t = MySlide.Shapes.AddTextbox(orientation, x, y, w, h)
t.Line.Visible = t.Fill.Visible = MsoTriState.msoFalse
tf = t.TextFrame
tf.TextRange.Text = txt
tf.TextRange.Font.Name = "Arial"
tf.TextRange.Font.Size = 16
tf.TextRange.Font.Color = WdColor.wdColorRed
tf.MarginRight = tf.MarginLeft = tf.MarginTop = tf.MarginBottom = 0
tf.WordWrap = MsoTriState.msoFalse
tf.AutoSize = PpAutoSize.ppAutoSizeShapeToFitText

(8) 図形の複製・配置操作
(7) のテキストボックスを複製し、(4) の矩形の右下に位置を合わせてみます。
txt = "(x2, y2)"
t2 = t.Duplicate()
t2.TextFrame.TextRange.Text = txt
sr = MySlide.Shapes.Range(Array[object]([r.Name, t2.Name]))
# 位置合わせの前提条件:t2の右下が矩形内にあること
# 右揃え判定:(t2.Left + t2.Width) <= (r.Left + r.Width)
# 下揃え判定:(t2.Top + t2.Height) <= (r.Top + r.Height)
sr.Align(MsoAlignCmd.msoAlignRights, False)
sr.Align(MsoAlignCmd.msoAlignBottoms, False)
<整列対象になる複数図形の指定>
Shapes.Rangeメソッドの引数として、各図形名をSystem.Array[object]で渡します。
<各図形の位置関係に注意>
PowerPointのShape.Duplicateメソッドは、元図形のやや右下に複写します。
ちなみに、WordのShape.Duplicateメソッドは、元図形と同じ位置に複写します。
上の例では、複写で作られたテキストボックス t2 が、矩形 r 内部に収まることがわかっていたので、位置関係をチェックせずにAlignメソッドを使っています。

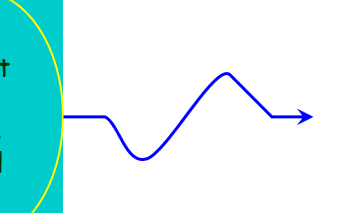
(9) 折れ線(または多角形)
頂点の座標はSystem.Singleの2次元配列5(C#的に書くとfloat[,])で渡します。
始点と終点の位置が同じ場合は閉じた図形(多角形)になります。
xy = [(300, 275), (325, 275), (350, 300), (400, 250), (425, 275), (450, 275)]
vertex = Array.CreateInstance(Single, len(xy), 2)
for n, (x, y) in enumerate(xy):
    vertex[n, 0] = x
    vertex[n, 1] = y

p = MySlide.Shapes.AddPolyline(vertex)
p.Fill.Visible = MsoTriState.msoFalse
p.Line.ForeColor.RGB = WdColor.wdColorBlue
p.Line.Weight = 2
p.Line.EndArrowheadStyle = MsoArrowheadStyle.msoArrowheadStealth
p.Line.EndArrowheadWidth = MsoArrowheadWidth.msoArrowheadWide
p.Line.EndArrowheadLength = MsoArrowheadLength.msoArrowheadLong

(10) スムージング
個人的にはあまり使いませんが、参考に、(9) の折れ線で頂点3と4をスムージングしてみます。
頂点の番号は始点が1です。
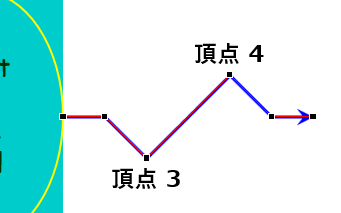
頂点4・3の順でスムージングします。
p.Nodes.SetEditingType(4, MsoEditingType.msoEditingAuto)
p.Nodes.SetEditingType(3, MsoEditingType.msoEditingAuto)
頂点にスムージングを実行すると、新たなNodeが後方に挿入されます。
よって、SetEditingTypeメソッドで指示する頂点の番号がずれないように、スムージングは終点側から始点側に向かって操作します。
これはPowerPoint上で手作業によってスムージングする場合でも同様です。
【↓↓↓ 失敗例 ↓↓↓】頂点3・4の順でスムージングすると...
(11) グループ化
スライド内の全図形をグループ化します。
g = MySlide.Shapes.Range().Group()
図形を選択してグループ化する場合は、(8) の例にならって必要な図形名を与えます。
g = MySlide.Shapes.Range(Array[object]([<図形名1>, <図形名2>, ...])).Group()
描画例
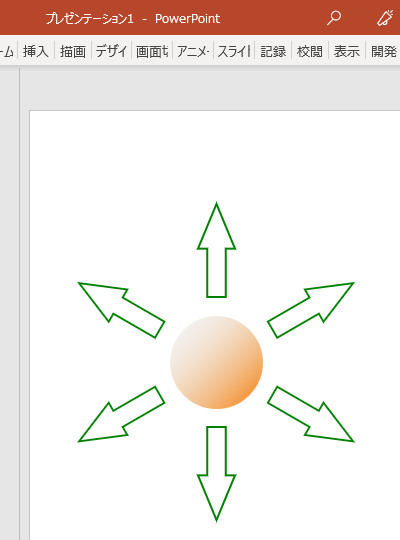
(例1) 任意の点を中心とした図形の回転複写
グラデーション付きの円の回りにブロック矢印を等角度で配置してみます。
図形を回転複写する関数
Pythonで記述するので、座標変換なども容易です。
実質10行ほどで、任意の中心点で図形を回転複写する関数を作成できます。
import math
import cmath
def rotate_shape(shape, x0, y0, deg_ccw):
    # 図形を回転複写する
    #
    # 点(x0, y0)を中心に、元図形(shape)を反時計回りにdeg_ccw[°]回転した図形を返す
    # 前提:元図形のRotationプロパティが 0
    # 必要なモジュール:math, cmath
    #
    # (x0, y0)を原点(0, 0)として、shapeの中心点の座標p1(x1, y1)を求める
    x1 = (shape.Left + shape.Width/2.0) - x0
    y1 = -(shape.Top + shape.Height/2.0) + y0
    #
    # 次にp1を反時計回りにdeg_ccw[°]回転させた点p2の座標を求める
    # 複素平面で、p1に対して、偏角が deg_ccw の単位ベクトルを掛ければ回転する
    p1 = complex(x1, y1)
    p2 = p1 * cmath.rect(1, math.radians(deg_ccw))
    #
    # shapeを複製し、その中心がp2になるように位置を決める
    new_shape = shape.Duplicate()
    new_shape.Left = shape.Left + (p2 - p1).real
    new_shape.Top = shape.Top - (p2 - p1).imag
    # 中心位置を回転後、複写した図形自体も回転させる
    # Rotationプロパティの角度は時計回りなので、設定値は正負反転
    new_shape.Rotation = -deg_ccw
    return new_shape
関数ができたので、描画してみます。
不要な図形を削除
とりあえず、事前にスライド上の他図形を全削除しておきましょう。
# 全図形削除(図形がない場合はエラー!)
MySlide.Shapes.Range().Delete()
<全図形削除について>
PowerPointのShapes.Rangeメソッドは引数省略時、全図形を返します。
一方、WordのShapes.Rangeメソッドは引数を省略できません。
Wordでの代替手段の例として
Documentオブジェクトに対してShapes.SelectAll()で全図形を選択してから
ApplicationオブジェクトでSelection.Delete()で削除できます。
中心点の指定と円の描画
ここでは、回転の中心点(x0, y0)を、スライド左上から右へ200、下へ270の位置とします。
ここを中心に円を描画します。
# グラデーション設定のために追加
from Microsoft.Office.Core import MsoGradientStyle
#
# 中心位置
x0, y0 = 200, 270
# 中心位置に直径100の円を描画(グラデーション付き)
w, h = 100, 100
x, y = (x0 - w/2.0), (y0 - h/2.0)
shape_type = MsoAutoShapeType.msoShapeOval
o = MySlide.Shapes.AddShape(shape_type, x, y, w, h)
o.Line.Visible = MsoTriState.msoFalse
o.Fill.TwoColorGradient(MsoGradientStyle.msoGradientDiagonalUp, 1)
o.Fill.ForeColor.RGB = 0xffffff
o.Fill.BackColor.RGB = 0x7fff
o.Fill.ForeColor.TintAndShade = -0.1
o.Fill.BackColor.TintAndShade = -0.1
ブロック矢印の描画
円の真上に上向きブロック矢印を描画します。
矢印の中心は回転中心から上に120、先端角度は45°です。
x1, y1 = x0, (y0 - 120)
w, h = 40, 100
x, y = (x1 - w/2.0), (y1 - h/2.0)
shape_type = MsoAutoShapeType.msoShapeUpArrow
a = MySlide.Shapes.AddShape(shape_type, x, y, w, h)
a.Fill.Visible = MsoTriState.msoFalse
a.Line.ForeColor.RGB = WdColor.wdColorGreen
a.Line.Weight = 2
a.Adjustments[2] = 0.5 / math.tan(math.radians(45.0 / 2.0))
回転複写とグループ化
この矢印を60°間隔で回転複写して、円とともにグループ化します。
他の図形がない場合は全図形のグループ化でも構いませんが、例示として、図形名を指定してグループ化してみました。
an_names = [rotate_shape(a, x0, y0, deg).Name for deg in range(60, 360, 60)]
g = MySlide.Shapes.Range(Array[object]([o.Name, a.Name] + an_names)).Group()
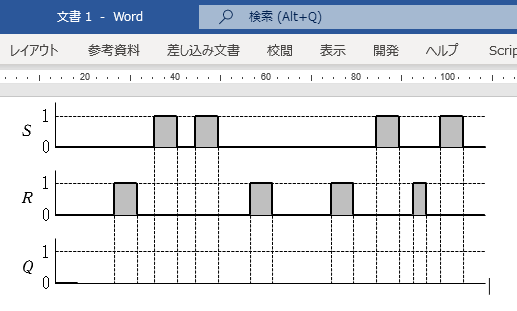
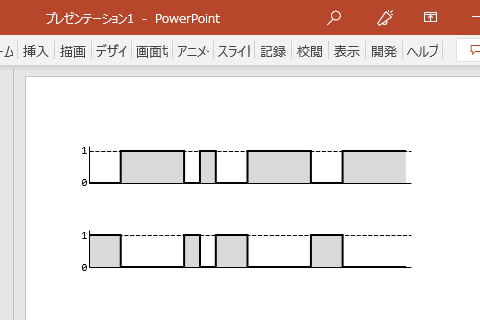
(例2) タイムチャート
タイムチャートの描画を関数化した例です。
import itertools
def DrawTimingChart(x, y, h, t0):
    # ディジタル信号のタイムチャートを描画する
    # x:転換点(立ち上がり・立ち下がり)の位置のリスト(始点と終点を含む)
    #   x[0]をスライド左端からの縦軸の位置とする
    # y:スライド上端からの横軸の位置
    # h:信号波形の高さ
    # t0:t=0 の信号値(0 または 1)
    #
    # -------------------------------------------------------------------------
    # 準備
    shape_names = []     # グループ化する図形名を入れるリスト
    # -------------------------------------------------------------------------
    # 信号が'1'の区間を薄いグレーで塗りつぶす(矩形描画)
    # スタート時(t=0) の値が"0"か"1"かで塗りつぶす区間を決定する
    if t0 != 0:
        x1x2 = zip(*[iter(x)]*2)
    else:
        x1x2 = zip(*[iter(x[1:])]*2)
    #
    for x1, x2 in x1x2:
        y1, w = (y - h), (x2 - x1)
        shape_type = MsoAutoShapeType.msoShapeRectangle
        r = MySlide.Shapes.AddShape(shape_type, x1, y1, w, h)
        r.Line.Visible = MsoTriState.msoFalse
        r.Fill.ForeColor.RGB = WdColor.wdColorGray15
        shape_names += [r.Name]
    # -------------------------------------------------------------------------
    # 軸の描画(縦横ともに5dotの余裕を付加)
    # 縦軸
    x1, y1, x2, y2 = x[0], y, x[0], (y - h - 5)
    lv = MySlide.Shapes.AddLine(x1, y1, x2, y2)
    lv.Line.Weight = 1
    lv.Line.ForeColor.RGB = WdColor.wdColorBlack
    shape_names += [lv.Name]
    # -------------------------------------------------------------------------
    # 横軸(Low)
    x1, y1, x2, y2 = x[0], y, (x[-1] + 5), y
    ll = MySlide.Shapes.AddLine(x1, y1, x2, y2)
    ll.Line.Weight = 1
    ll.Line.ForeColor.RGB = WdColor.wdColorBlack
    shape_names += [ll.Name]
    # -------------------------------------------------------------------------
    # 横軸(High)
    lh = ll.Duplicate()
    lh.Left = ll.Left
    lh.Top = ll.Top - h
    lh.Line.Weight = 0.5
    lh.Line.DashStyle = MsoLineDashStyle.msoLineLongDash
    shape_names += [lh.Name]
    # -------------------------------------------------------------------------
    # 信号波形作成(折れ線描画)
    #
    # x軸の各要素を2つずつ並べる(折れ線データの準備)
    # [X0, X1, ... , Xn] --> iter([X0, X0, X1, X1, ... , Xn, Xn])
    xx = itertools.chain(*zip(*[x]*2))
    #
    #  折れ線座標のデータ作成
    # [(X0, YL), (X1, YL), (X1, YH), ... , (Xn-1, YL), (Xn-1, YH), (Xn, YH)]
    xy = list(zip(xx, itertools.cycle([(y - h), y, y, (y - h)])))[1:-1]
    #
    vertex = Array.CreateInstance(Single, len(xy), 2)
    for n, (xn, yn) in enumerate(xy):
        vertex[n, 0] = xn
        vertex[n, 1] = yn
    p = MySlide.Shapes.AddPolyline(vertex)
    p.Line.ForeColor.RGB = WdColor.wdColorBlack
    p.Line.Weight = 2
    #
    if t0 != 0:
        p.Flip(MsoFlipCmd.msoFlipVertical)
    #
    shape_names += [p.Name]
    # -------------------------------------------------------------------------
    # 縦軸の値
    # 文字"1"を記入
    orientation = MsoTextOrientation.msoTextOrientationHorizontal
    t1 = MySlide.Shapes.AddTextbox(orientation, x[0], (y - h), 0, 0)
    t1.Line.Visible = t1.Fill.Visible = MsoTriState.msoFalse
    tf, tr = t1.TextFrame, t1.TextFrame.TextRange
    tr.Text = "1"
    tr.Font.Name = "Consolas"
    tr.Font.Size = h / 3.0
    tf.MarginRight = tf.MarginLeft = tf.MarginTop = tf.MarginBottom = 0
    tf.WordWrap = MsoTriState.msoFalse
    tf.AutoSize = PpAutoSize.ppAutoSizeShapeToFitText
    # 軸に対する位置調整
    t1.Left = x[0] - (t1.Width + 2)    # 縦軸との間に2dotの間隔を入れる
    t1.Top -= t1.Height / 2.0
    shape_names += [t1.Name]
    # -------------------------------------------------------------------------
    # 文字"0"を記入
    t2 = t1.Duplicate()
    t2.Left = t1.Left
    t2.Top = t1.Top + h
    t2.TextFrame.TextRange.Text = "0"
    shape_names += [t2.Name]
    # -------------------------------------------------------------------------
    # グループ化して返す
    return MySlide.Shapes.Range(Array[object](shape_names)).Group()
タイムチャートを2つ描いてみます。
# 始点~転換点~終点のリスト
x = [60, 90, 150, 165, 180, 210, 270, 300, 360]
# タイムチャートを描画
y, h, t0 = 100, 30, 0
DrawTimingChart(x, y, h, t0)
# 反転した波形を、80下げた位置に描画
y, t0 = (y + 80), 1
DrawTimingChart(x, y, h, t0)
結果です。
おわりに
IronPythonコンソールからスライドに描画してみました。
よく使う描画スタイルは関数として MyPowerPoint.py に書き込んでおいてもいいでしょう。
本稿では触れませんでしたが、PowerPoint上でマウスを使って描画した図形を選択して Selection オブジェクトとして受け取り、コンソールで編集することも可能です。
実務では、このように作った図形をコピーして、別のプレゼンテーションやOfficeアプリケーションに貼り付けて使っています。
Office文書内の図は、複数のファイル形式で保存できますが、svg形式のベクターファイルでも保存できるので幅広く活用できます。
さらにPowerPointでは、昔懐かしいwmf(Windowsメタファイル)形式での保存もサポートしています。
資料
PowerPointに関する .NET APIリファレンスは用意されていませんが、VBAリファレンスで各オブジェクトの操作に関する情報の大部分が得られます。
ただし、VBAリファレンスでは.NET上の扱いがわかりにくいのでWordやExcelの .NET APIリファレンスが参考になります。