Plotly(Python)でインタラクティブに結び目を描画する
1. はじめに
今回は結び目(knot)をPlotlyで三次元空間上に図示しようと思います。学習の補助になれば幸いです。
↓のようなものができます。
See the Pen dyoyxKW by Sota Misawa (@mitawaut) on CodePen.
2. 復習
結び目を図示するにあたって必要最低限の復習をしておきます。
結び目(knot)とは $S^3$ に区分線形的に埋め込まれた $S^1$ のことを指します。$S^3$ は $\mathbb{R}^3\cup \{\infty \}$ とみなせたことから,埋め込まれた $S^1$ が $\infty$ を含まなければ $\mathbb{R}^3$ に埋め込まれた $S^1$ と考えることができます。
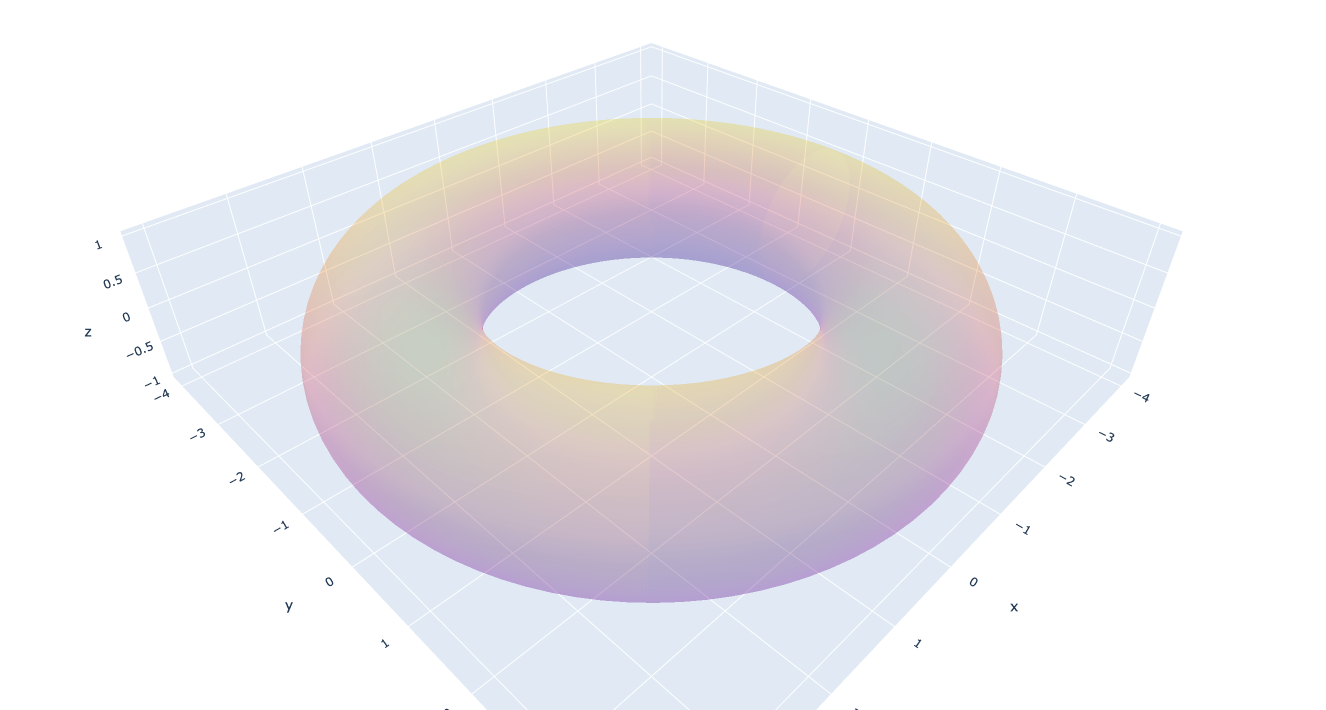
結び目の有名な表現方法として2次元トーラス面 $\mathbb{T}^2$ に沿った結び目というものが考えられます。トーラスとして次の写像が定める閉曲面を考えます:
$$\mathbb{T}^2 : [-\pi , \pi]^2 \ni (\phi,\ \theta)\longmapsto \bigl(\cos \phi \ (3+\cos \theta),\ \sin \phi \ (3+\cos \theta),\ -\sin \theta \bigr)\in \mathbb{R}^3$$
$\mathbb{T}^2$ 上の閉曲線で2つの整数の組 $(n,\ m)$ を用いて( $\mathbb{T}^2$ の定義域を適当に拡張して),
$$
T(n,\ m) : [-\pi , \pi]\ni t \longmapsto \mathbb{T}^2(nt,\ mt) \in \mathbb{R}^3$$
と表されるものを考えます。これは結び目と考えることができます。これに関して次の定理が知られています。
定理. $\mathbb{T}^2$ に含まれる任意の自明でない結び目 $K$ に対して,互いに素な整数の組 $(n,\ m)$ が存在して $K$ は $T(n,\ m)$と同値である。
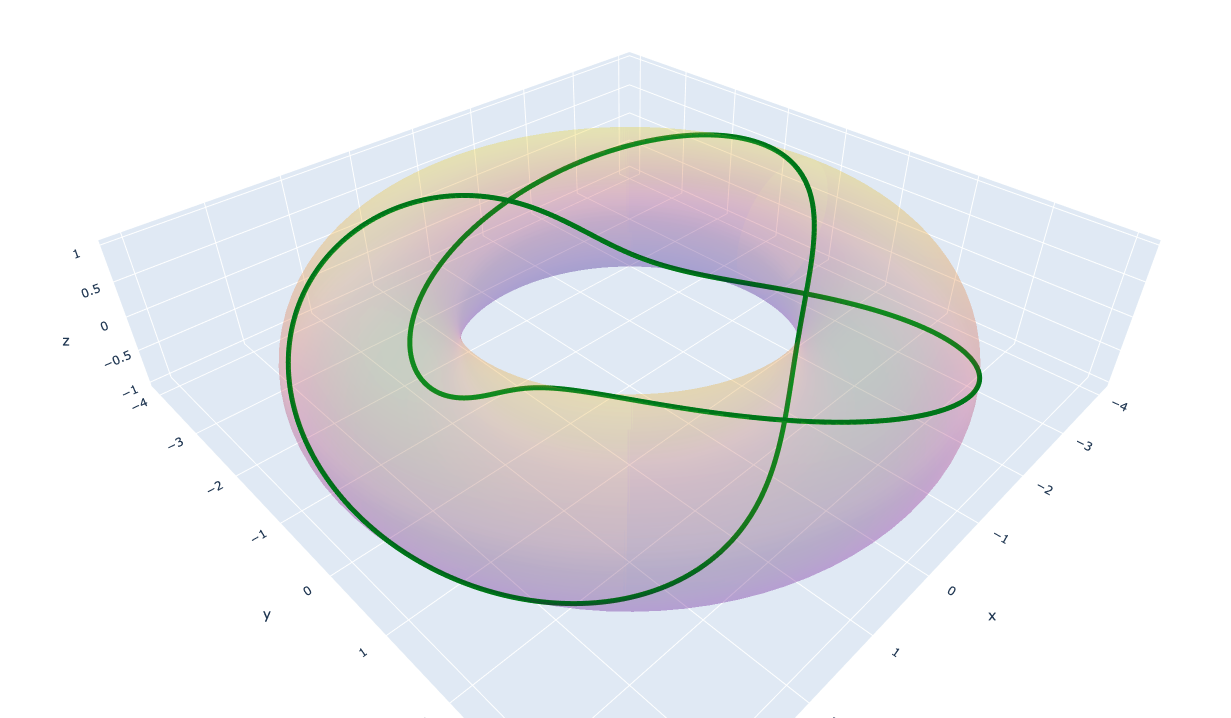
この定理より,結び目の表現として $T(n,\ m)$ を図示しようということです。以下に $T(2,\ 3)$の図を示しておきます。

3. 実装
ここから5分クッキングの始まりです。ipywidgetsを用いるのでjupyter notebook推奨です。
ipython==7.12.0
numpy==1.18.1
plotly==4.4.1
ipywidgetsで $n,\ m$ を操作できるようにするのを目標とします。まずは必要なものをインポートします。
# import modules
import plotly.offline as offline
import plotly.graph_objs as go
import numpy as np
from ipywidgets import interactive, VBox, widgets
from IPython.display import display

offline.init_notebook_mode(connected=True)
次に $\mathbb{T}^2$ と $T(n,\ m)$ も定義します。これも上の議論をそのまま実装するだけです。
# functions
def torus(p, t):
    x = np.cos(p) * (3 + np.cos(t))
    y = np.sin(p) * (3 + np.cos(t))
    z = -np.sin(t)
    return (x, y, z)

def knot(n, m):
    theta = np.linspace(-np.pi, np.pi, 1000)
    p, t = n*theta, m*theta
    return torus(p, t)
あとはplotするだけです。初期値を $(m,\ m) = (2,\ 3)$ にして,スライドバーの範囲は $n$ : -10~10, $m$ : 0~10としました。
fig = go.FigureWidget()
scatt = fig.add_scatter3d()

def update(n=2, m=3):
    with fig.batch_update():
        (cx, cy, cz) = knot(n, m)
        scatt.data[0].x=cx
        scatt.data[0].y=cy
        scatt.data[0].z=cz
        scatt.data[0].mode='lines'
        scatt.data[0].line=dict(
                    width=10,
                    color='green')

vb = VBox((fig, interactive(update, n=(-10, 11, 1), m=(0, 10, 1))))
display(vb)
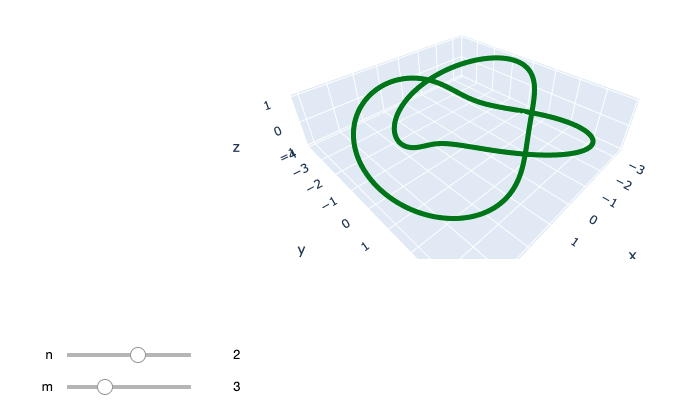
次のように表示されて,スライドバーをいじると同時に結び目が変われば成功です。

4. 最後に
表示されない人がいたらipython周りのversionを確認しましょう。 初投稿が数分クオリティなのはやばいと思ったので復習とかいう余分なセクションを生んでしまった
