Introduction
Sharperlight Publisher is an end-user application designed to facilitate the creation of tables, charts, and visualizations on a web browser based on dynamically extracted data from your preferred data sources.
Today, we will explore how to add an icon for downloading what has been created as a table in a Microsoft Excel file, and also adjusting its size and position.
Creating a Web Report
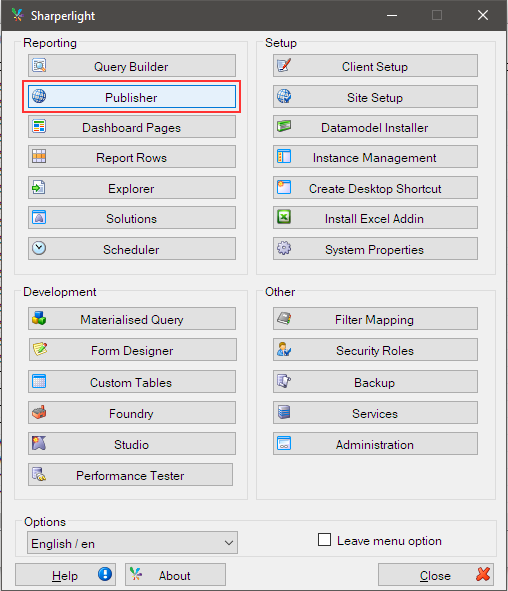
Launch the Publisher from the Sharperlight application menu.
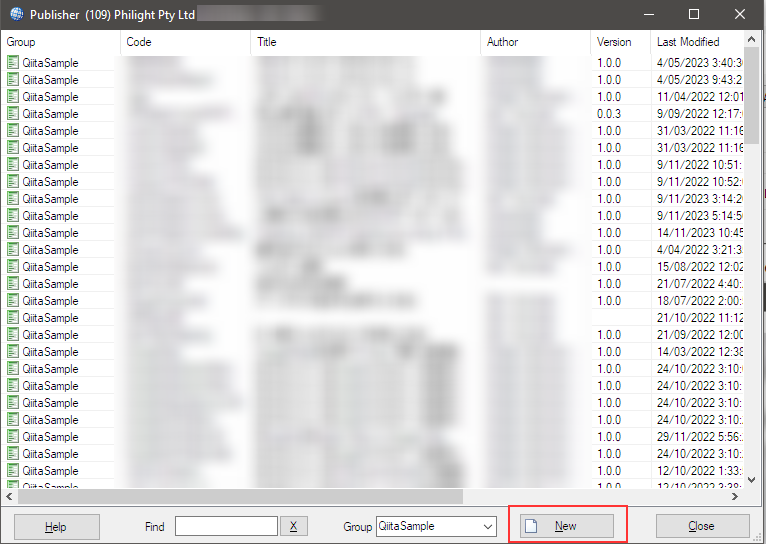
Once the Publisher is launched, initiate the creation of a web report by clicking New button.
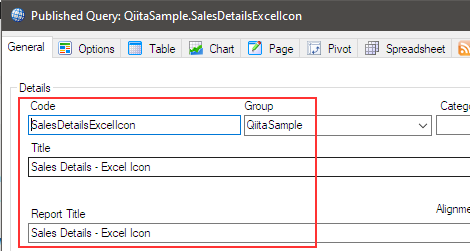
First, enter the Code, Group, Title, and Report Title. The combination of Code and Group will serve as a unique identifier for this report.
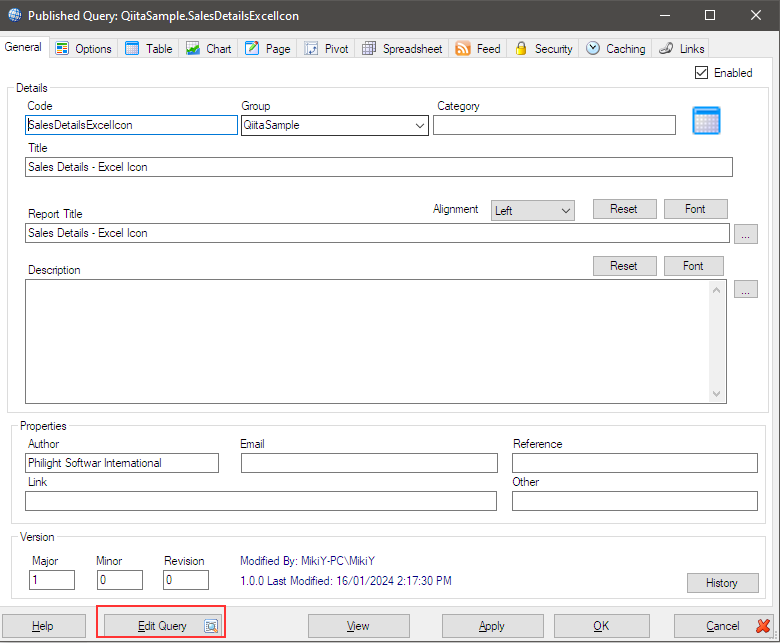
Next, create the core query for the report. Launch the Query Builder by clicking on the Edit Query button.
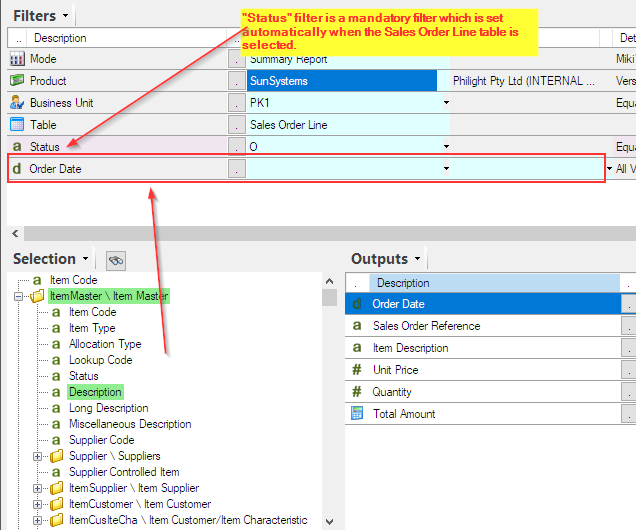
In the Query Builder, you will utilize an existing database. Sharperlight generally communicates with database through a datamodel, referred to as Product. Here, in the filter area, specify which datamodel to connect to under Product.
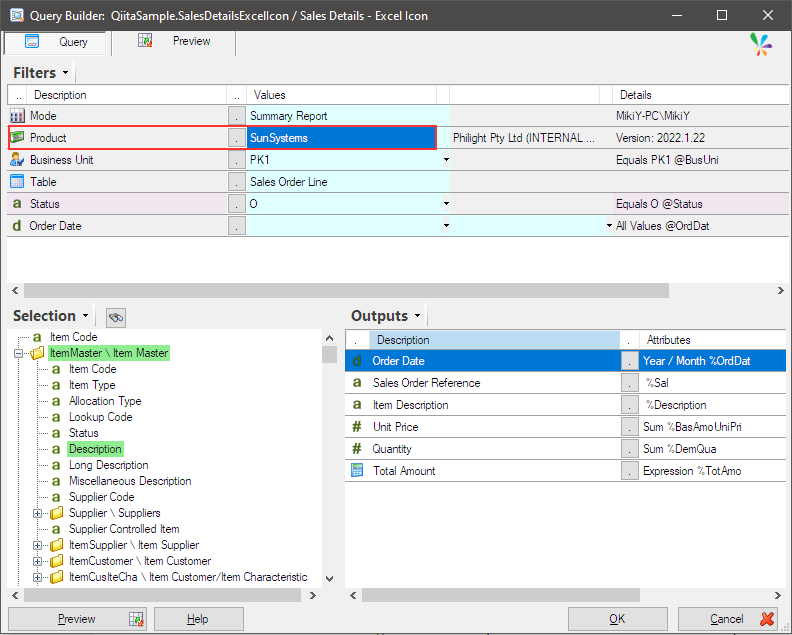
Once the datamodel is specified, you gain access to each table defined within that datamodel. In the Table section of the filter area, choose the table you want to use from the list.
When the table is specified, the columns belonging to that table and JOIN information will be displayed in a tree format in the selection area.
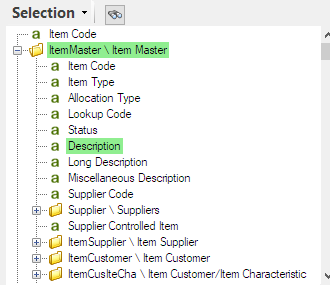
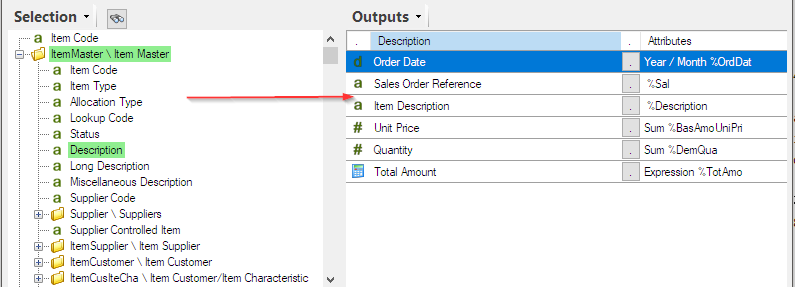
You will now select which columns' data to output from the displayed columns in the selection area. Double-click or drag and drop the desired columns to the output area.
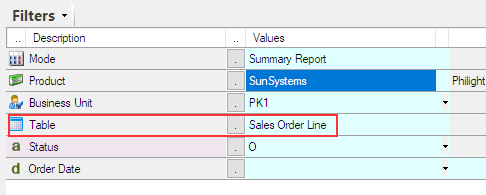
Additionally, you can set filter items by dragging and dropping them into the filter area. For this instance, you specified Order date as the filter.
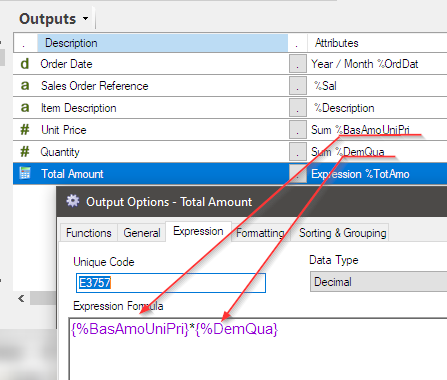
The item Total Amount at the bottom of the output area does not exist in the selection area. This is called an Expression, one of the extended options provided by Sharperlight. Here, you are defining an expression Unit Price x Quantity to calculate the total amount.
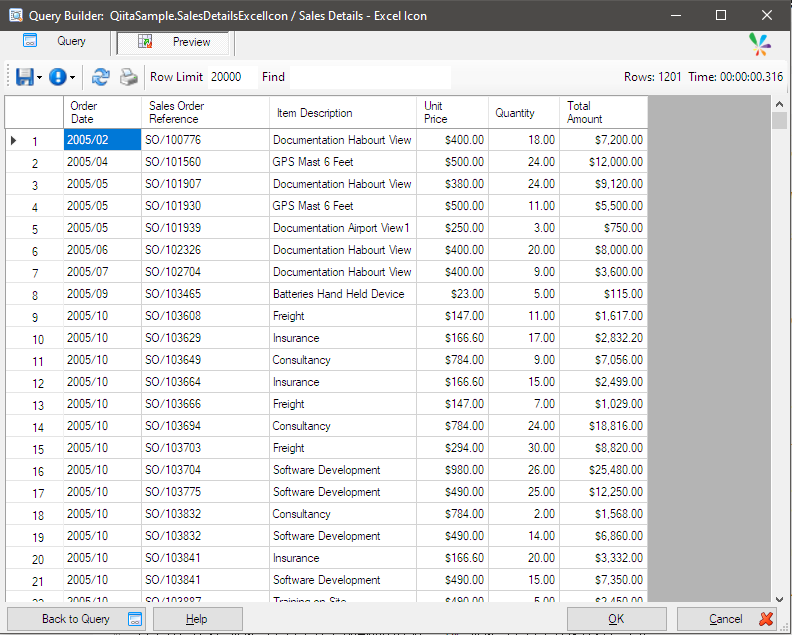
Verify the query by clicking the Preview button. If data is displayed, then it is considered successful.
Return to the query definition screen by clicking the Back to Query button, and then save the query by clicking the OK button.
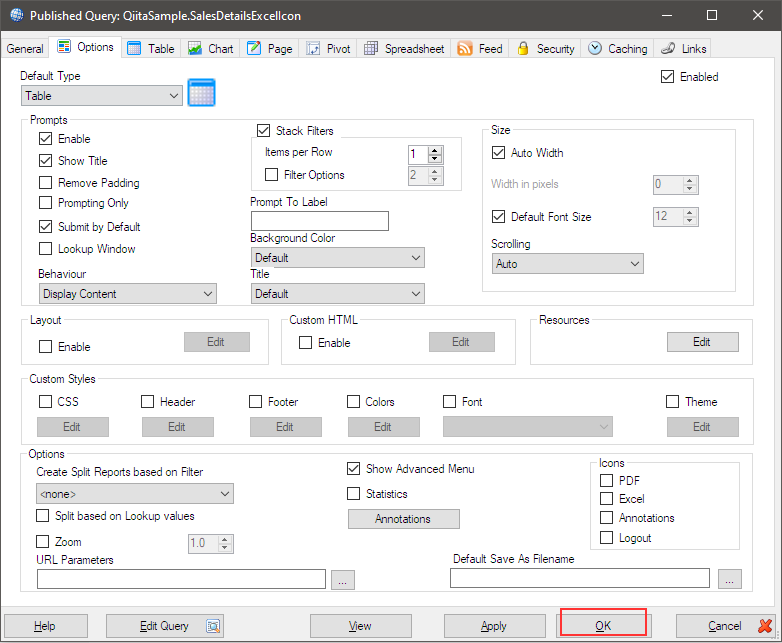
Next, navigate to the Options tab. Ensure that the Default Type is set to Table.
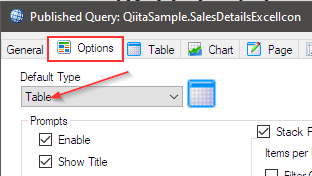
Leave the various other options as default and click the OK button to save the web report.
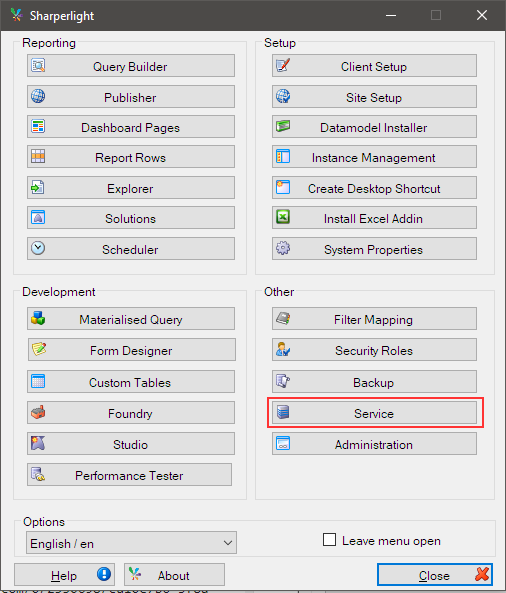
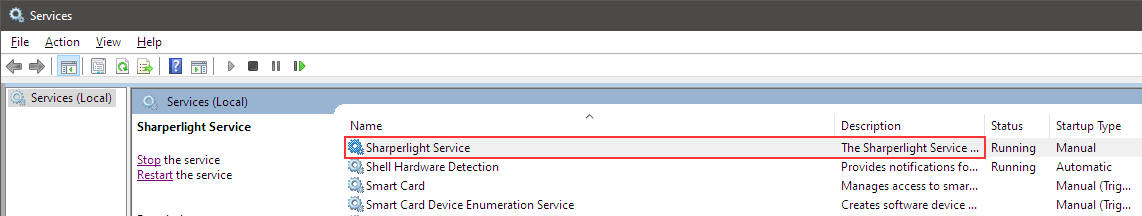
Launch the Sharperlight Service either from the Sharperlight application menu or through the Windows service dialog.
From the application menu, if available.
From the Windows Service dialog.
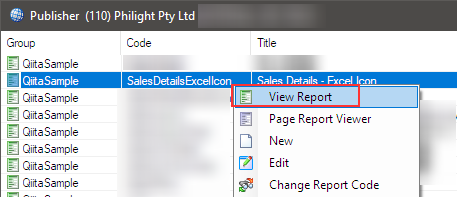
Return to the Publisher, select the report you created earlier, and execute View Report from the right-click menu.
The default browser will display a table like this. The columns you set in the filter area of the Query Builder are shown at the top of the report.
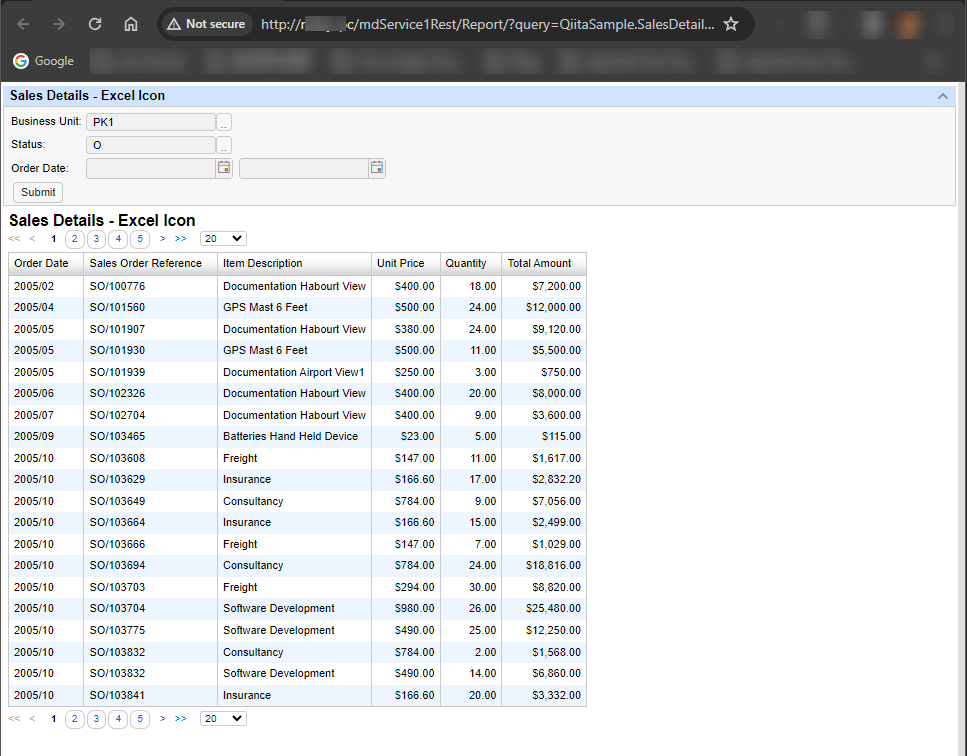
That completes the basic setup for the web report.
Displaying Icons
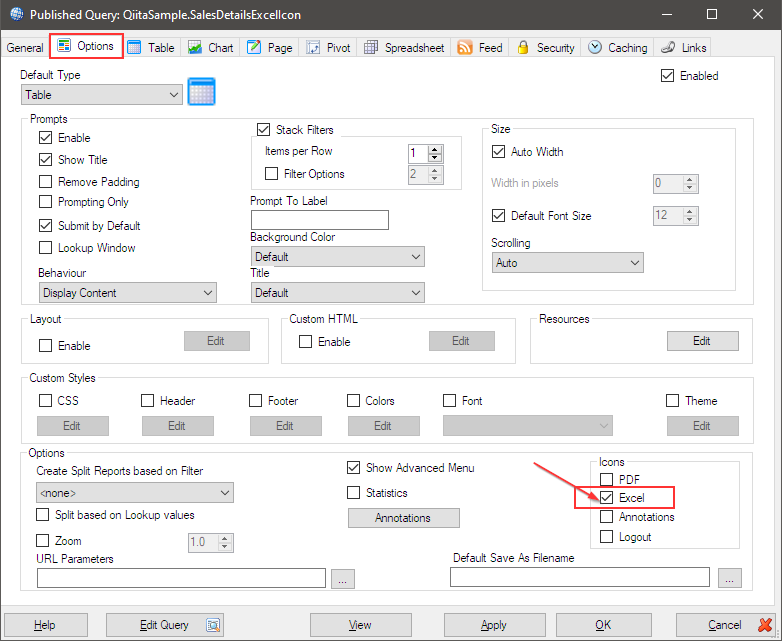
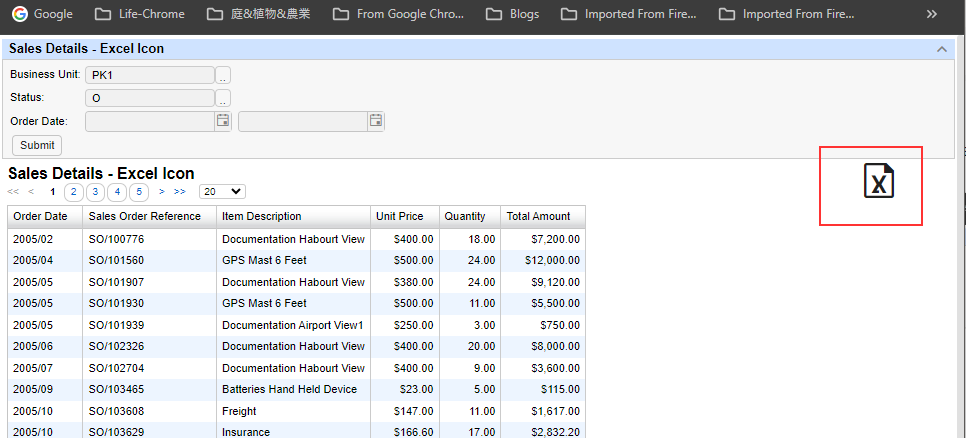
Now, let's add the Excel download icon. Go back to the Publisher and open the definition of the web report you created earlier. Move to the Options tab, and at the bottom right, check the Icon Excel checkbox to turn it On.
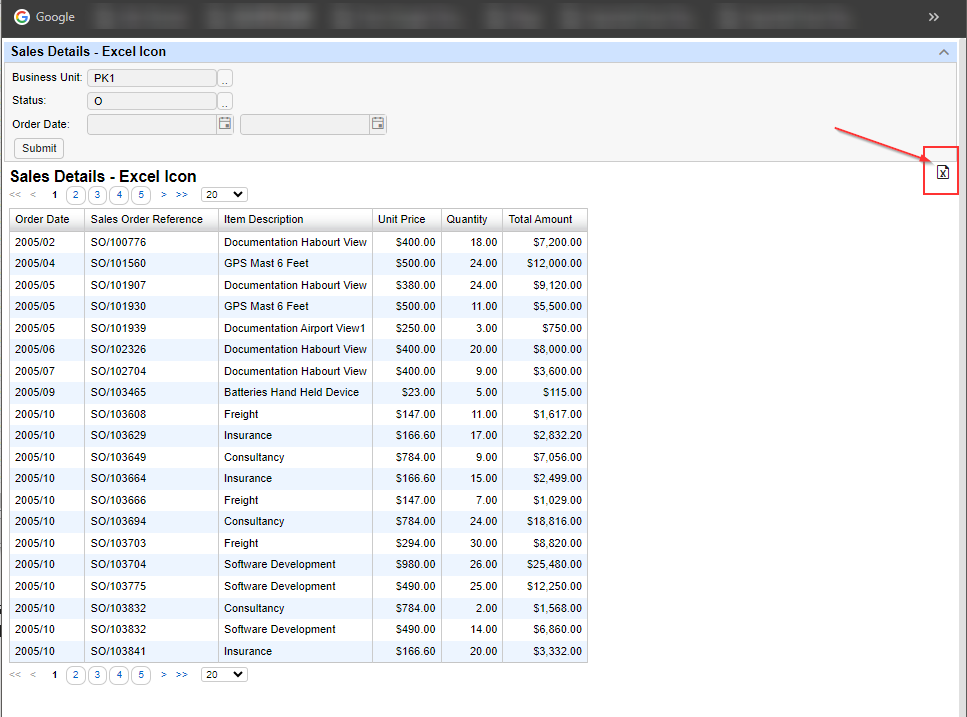
Save the definition of the web report with the OK button, and refresh the displayed report in the browser with the F5 key. An Excel icon should now appear in the corner. Clicking on it will download the displayed information as an Excel file.
Decorating the Icon
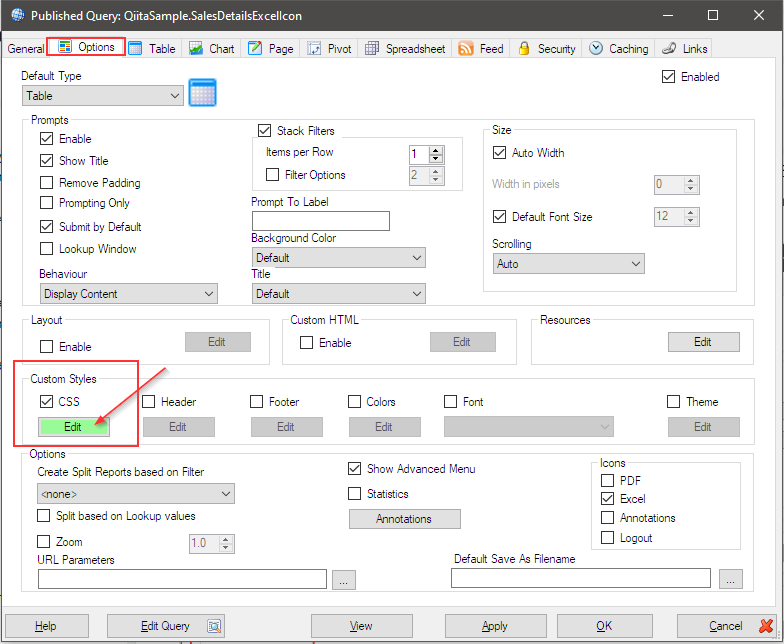
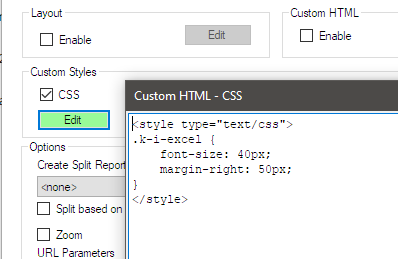
"But the icon is small; I want it to be bigger." If you think that, you can use CSS for customization. Return to the Publisher, open the definition of the web report again. In the Options tab, about halfway down, turn on the Custom Styles, CSS option.
Open the editor by clicking on the Edit button, and paste the following CSS syntax. (This is just an example.)
<style type="text/css">
.k-i-excel {
    font-size: 40px;
    margin-right: 50px;
}
</style>
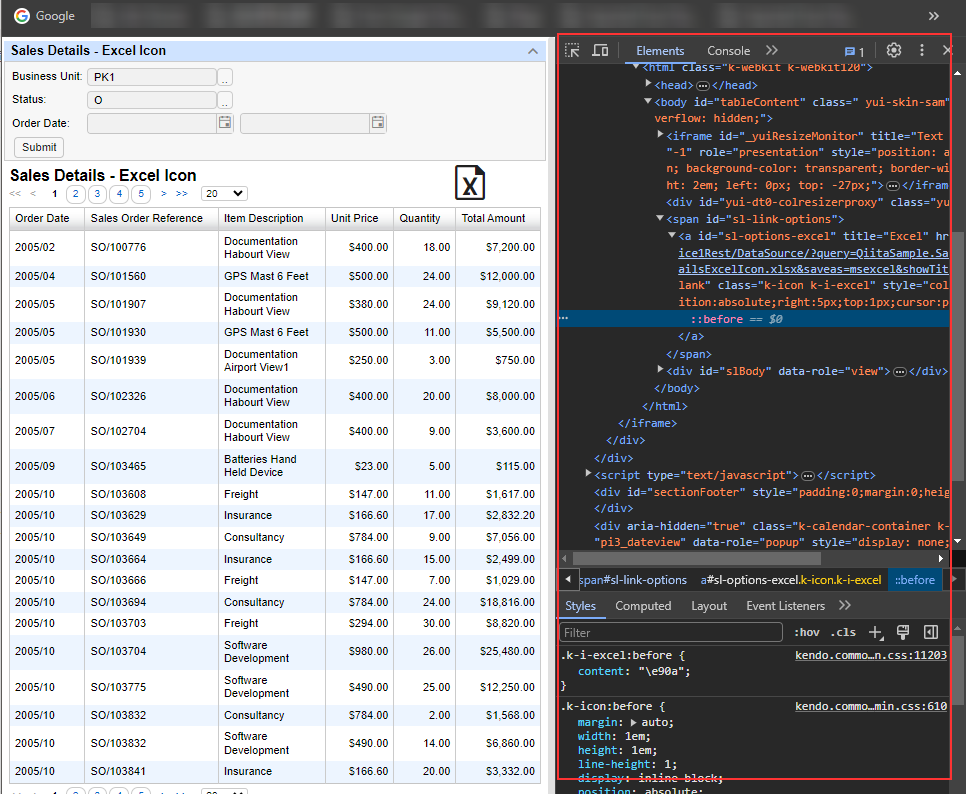
Save the changes, refresh the report again, and you should see the icon displayed larger as per the custom CSS.
You can use the browser's developer tools to inspect and find class names or IDs for elements like icons. Then, you can apply custom styles or decorations to enhance their appearance. Keep in mind that in some cases, customization might be limited by the application or platform.
Conclusion
Web reports created with Sharperlight are essentially standard HTML pages with CSS. As demonstrated, you can customize them freely, adjusting sizes, positions, and more as needed. Feel free to explore and try out different modifications.
Once again, keep in mind that in some cases, customization might be limited by the application or platform.