Introduction
Currently, there are still many cases where data is managed using Microsoft Excel.
Many companies, large and small, are still stuck in the hustle and bustle of their day-to-day work and are stuck in the familiar Excel-based data entry and management.
It seems that the data accumulated on a daily basis contains a lot of important information that determines the direction of the company's business, but how to read such important information from the data divided into multiple Excel files , it seems that it is necessary to spend a certain amount of effort and time.
In general, by accumulating and sharing data in a database server located on the internal network, each department in the company can view the data they need at any time, helping them to make quick decisions. That would be nice.
This time, I would like to use Sharperlight and take a look at the first step to realize it.
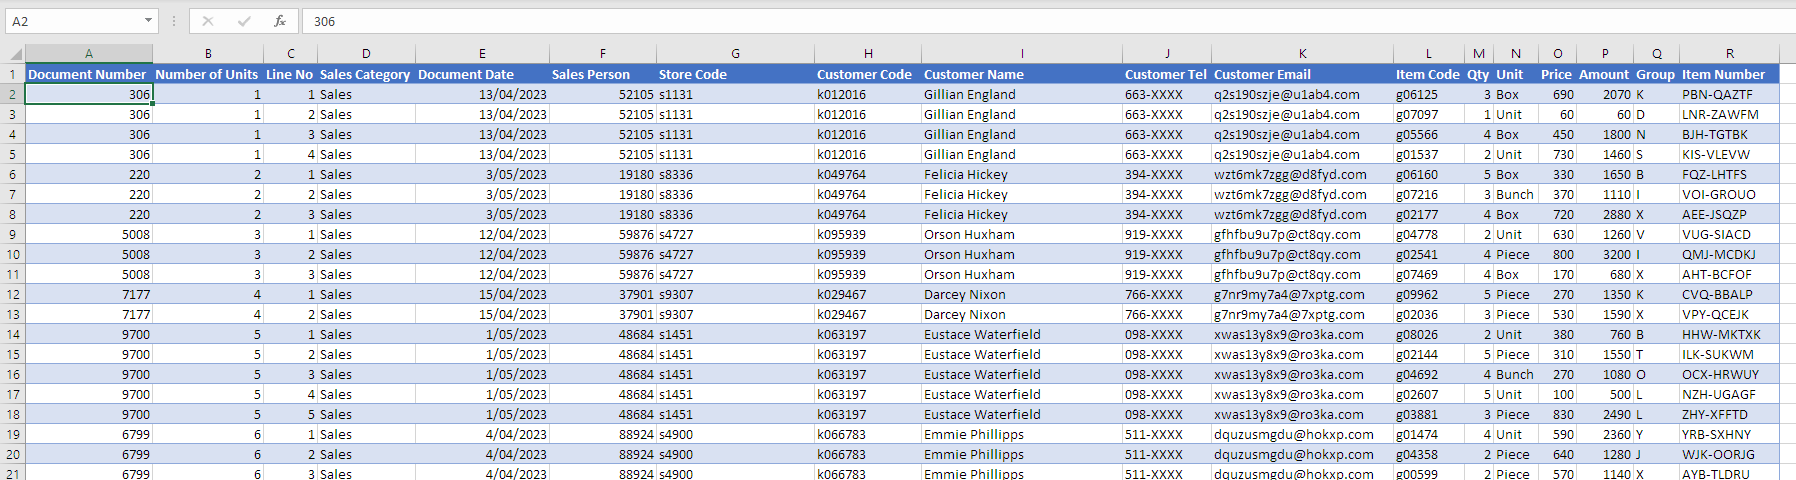
Let's say we have a sales ledger created in Excel like this. Let's use this sample to see how we can do.
Preparing the database
Prepare to save sales ledger data created in Excel to a Microsoft SQL Server database.
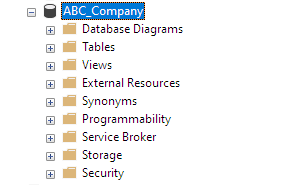
An empty database
Using MS SQL Server Management Studio, create a new database for data storage.
Tables
Prepare new tables in the created database.
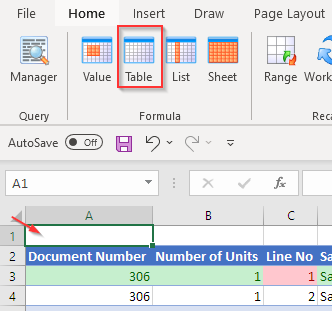
I read the sales ledger in Excel carefully.
It looks like it's divided into a header and its details.
Looking at the first record, it seems that the green column is the header information and the red column is the details.

Now, create a header table and a details table.
Use the column names on the Excel sheet.
--Sales Header Table
USE [ABC_Company]
GO

SET ANSI_NULLS ON
GO

SET QUOTED_IDENTIFIER ON
GO

CREATE TABLE [dbo].[SalesHeader](
	[Row_ID] [int] IDENTITY(1,1) NOT NULL,
	[DocumentNumber] [int] NOT NULL,
	[NumberOfUnits] [int] NOT NULL,
	[SalesCategory] [nvarchar](100) NOT NULL,
	[DocumentDate] [date] NOT NULL,
	[SalesPerson] [int] NOT NULL,
	[StoreCode] [nvarchar](50) NOT NULL,
	[CustomerCode] [nvarchar](50) NOT NULL,
	[CustomerName] [nvarchar](200) NOT NULL,
	[CustomerTel] [nvarchar](50) NOT NULL,
	[CustomerEmail] [nvarchar](200) NOT NULL,
 CONSTRAINT [PK_dbo_SalesHeader_Row_ID] PRIMARY KEY CLUSTERED
(
	[Row_ID] ASC
)WITH (PAD_INDEX = OFF, STATISTICS_NORECOMPUTE = OFF, IGNORE_DUP_KEY = OFF, ALLOW_ROW_LOCKS = ON, ALLOW_PAGE_LOCKS = ON) ON [PRIMARY]
) ON [PRIMARY]
GO
--Sale Detail Table
USE [ABC_Company]
GO

SET ANSI_NULLS ON
GO

SET QUOTED_IDENTIFIER ON
GO

CREATE TABLE [dbo].[SalesDetail](
	[Row_ID] [int] IDENTITY(1,1) NOT NULL,
	[DocumentNumber] [int] NOT NULL,
	[LineNo] [int] NOT NULL,
	[ItemCode] [nvarchar](50) NOT NULL,
	[Qty] [int] NOT NULL,
	[Unit] [nvarchar](20) NOT NULL,
	[Price] [int] NOT NULL,
	[Amount] [int] NOT NULL,
	[Group] [nvarchar](10) NOT NULL,
	[ItemNumber] [nvarchar](100) NOT NULL,
 CONSTRAINT [PK_dbo_SalesDetail_Row_ID] PRIMARY KEY CLUSTERED
(
	[Row_ID] ASC
)WITH (PAD_INDEX = OFF, STATISTICS_NORECOMPUTE = OFF, IGNORE_DUP_KEY = OFF, ALLOW_ROW_LOCKS = ON, ALLOW_PAGE_LOCKS = ON) ON [PRIMARY]
) ON [PRIMARY]
GO
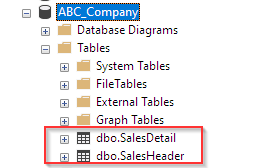
Now the sales data container is ready.
Creating Sharperlight data model
Here we prepare for using Sharperlight.
We create a connector : data model for establishing a conversation between Sharperlight and the database.
Datamodel creation is done in Sharperlight Studio.
Launch Studio from the Sharperlight application menu.
Database Connection
Connect Sharperlight Studio to the database and load the database schema required for conversation.
Click the New icon from the menu bar.

Enter the required information for the datamodel (here called Product). Proceed with OKbutton.

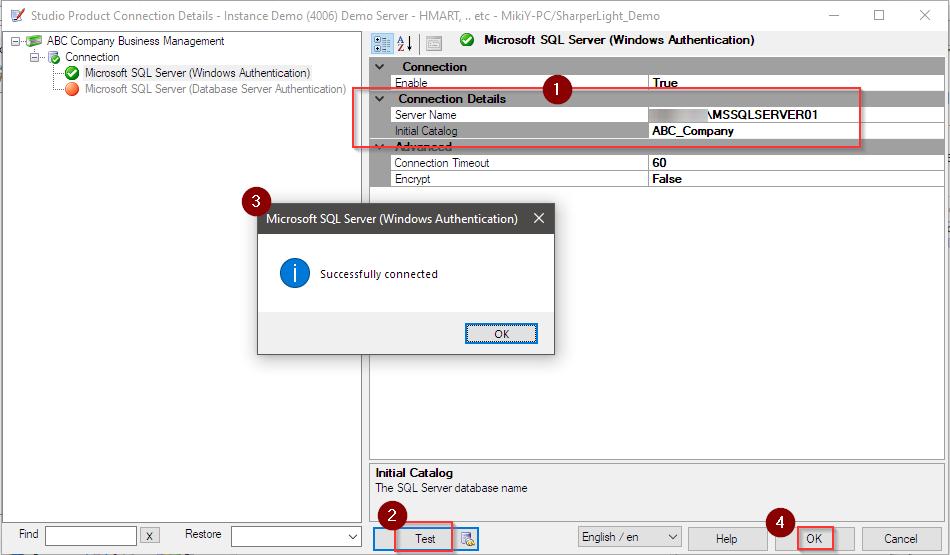
Establish a database connection.
Enter the connection information for the database you created earlier. Check the connection with the Test button. If the connection is successful, press the OK button to proceed.
Getting Schema
A confirmation message asking if you want to load the schema will be displayed, so click the Yes button to proceed.

A dialog for loading the schema will appear. Start loading with the Get Tables button.

When the schema information is displayed, load it with the OK button.
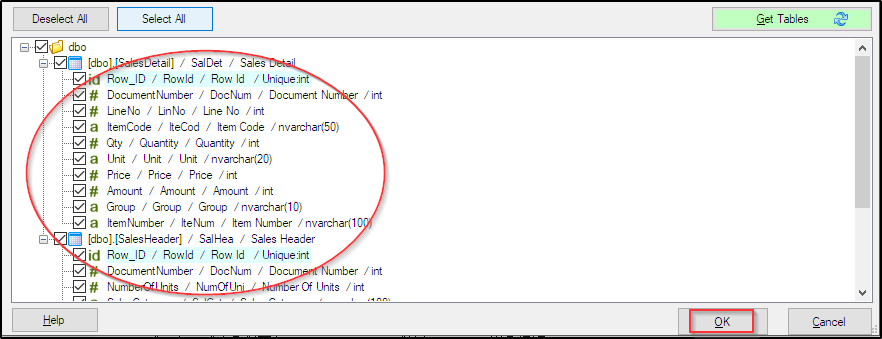

Schema loaded.

Editting table definition
By default, the conversation between this datamodel and the target database is read-only.
This time, we want to write the data from the Excel file to the database, so set the table to Writable.
Set the Allow Table Writeback option to True for both tables. The table icon turns red.

Saving Data Models and establishing the database connection for Sharperlight Applications
Save the data model with the save icon in the menu bar.
A warning message will be displayed, so press OK to proceed.

The default save location will be specified, so save with the Save button.

A message prompting you to configure the connection settings for the Sharperlight application will be displayed. Press the Yes button to move to the connection settings screen.

The Sharperlight Client Setup will open. This application manages connections between each installed datamodel and its target database.
Enter the connection information to the target database of the datamodel created this time, check the connection with the Test button, and proceed with the OK button.

The creation of the Sharperlight datamodel is completed. Close Sharperlight Studio.
Writeback data
Then, write data using the created datamodel and its connection.
Start MS Excel and login to the Sharperlight add-in.

and open the sales ledger.
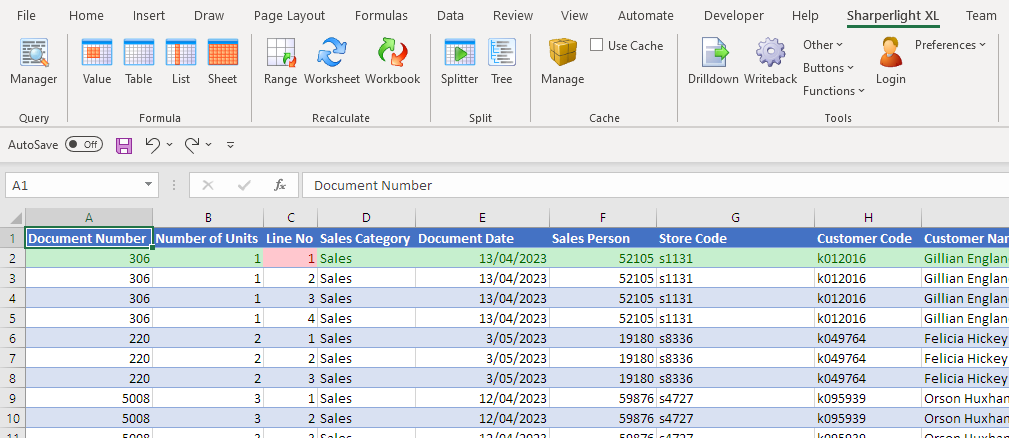
If the sales ledger is not the Excel Table, set it as the Excel Table.

Definition of Sharperlight Writeback
To write data, use Sharperlight's Writeback function.
Click the 'Writeback' icon on the Sharperlight ribbon to open the 'Writeback' dialog.

Product selection
Specify the product (datamodel). Select from the list with the search button.

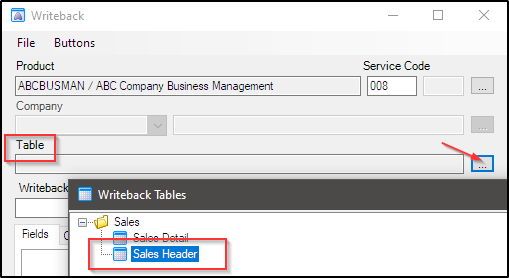
Table selection
If you click the search button, a list of writable tables within the selected product (datamodel) will be displayed, so select the target table to be written from the list.
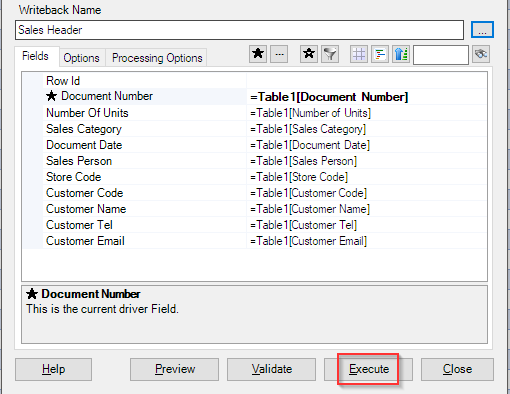
A list of fields to be written is displayed on the Field tab.

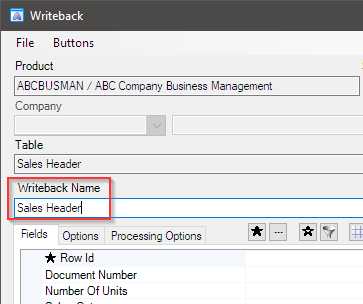
Enter writeback name
This will be the Name when saving this writeback definition to the sheet.
Field mapping
Connect the columns on the Excel worksheet with the columns on the database table via the datamodel.
Select any field on the Fields tab. Then double-click the table header on the Excel worksheet. The mapping function will start and you will see a message calling your attention. Confirm with the Yes button.

If the column name on the Excel worksheet and the column description defined in the datamodel are the same, this function will create a mapping.
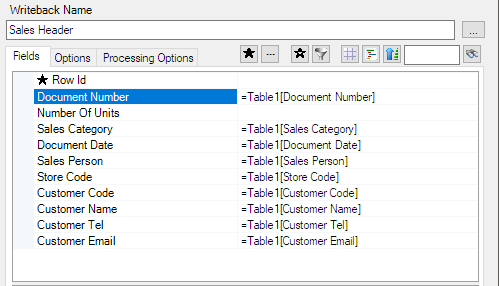
The Number Of Units field mapping is not complete. This is due to a column name mismatch. Let's do the mapping manually.
After selecting Number Of Units on the Fields tab, double-click the header of the Number Of units column on the Excel sheet. The same message as before will be displayed, so press the No button this time.

The mapping is set like this.

The mapping is completed.

Specifying Driver Column
Specifies which column to refer to when reading data from an Excel sheet.
Let the document number column be the driver.

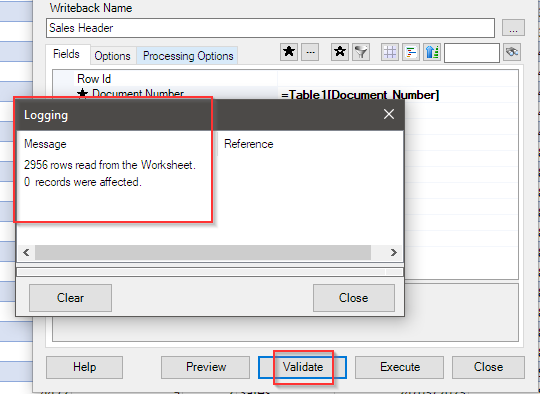
Validating the Writeback definition
Now that the definition is complete, let's verify the operation. Click the Validate button. It is normal to see such a message.
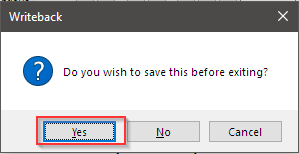
Saving Writeback definition
When you close the dialog, a message prompting you to save will be displayed, so save with the Yes button. It will be saved in this worksheet with the Writeback Name entered above.
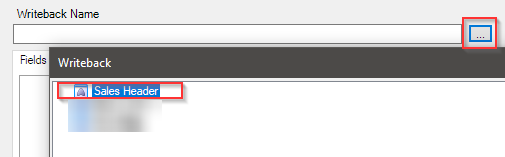
Performing Sharperlight Writeback
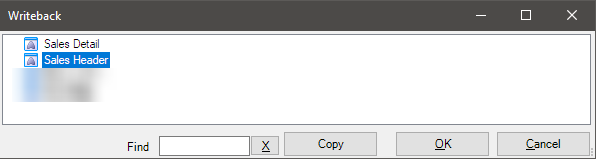
Let's run it now. Reopen the Writeback dialog with the Writeback icon on the Sharperlight ribbon, and view the list of saved writeback definitions with the Search button. Select the definition Sales Header you want to open.
Once the definitions are loaded, click the Execute button.
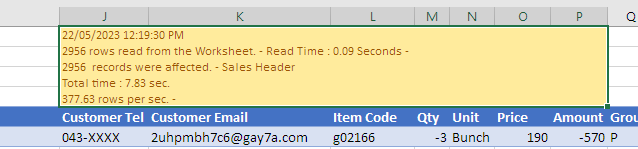
If you see a log like this, the execution was successful.

Let's check the database table.
Oops! The writeback was successful, but the header information is duplicated.
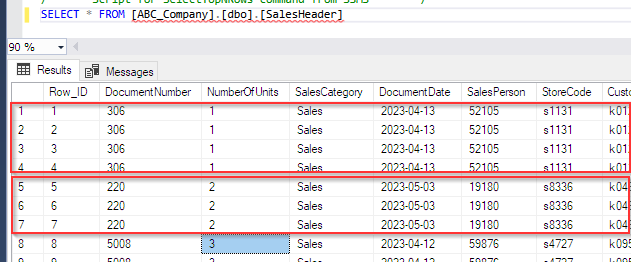
That needs fixing, doesn't it?
Unique key setting
Set the unique key in the datamodel.
Open the ABC Company Business Management datamodel in Sharperlight Studio.
Open the SalesHeader table definition in the Tables tab.
Set the Is Unique option to True for the DocumentNumber field.

Save the datamodel. Log off from the Excel add-in and log on again for the changes to take effect.
Empty the database table with the Truncate table command and write back again.
Writeback completed successfully.

On the database table side, the duplicates seem to have been resolved.
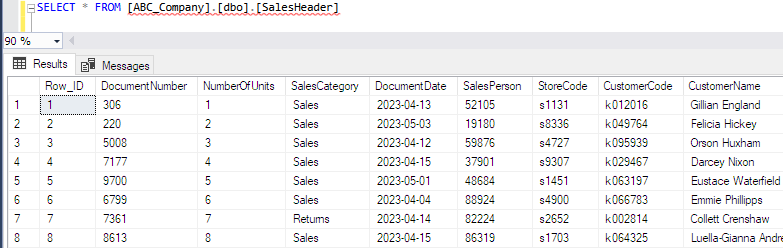
Let's check exactly.
SELECT DocumentNumber, COUNT(DocumentNumber)
FROM  [ABC_Company].[dbo].[SalesHeader]
GROUP BY DocumentNumber
HAVING COUNT(DocumentNumber) > 1
No duplicates.

Write back data to the SalesDetail table in a similar manner.
The SalesDetail table seems to have the same duplication issue, so update the table definition in the datamodel and then perform the writeback.
In the SalesDetail table, the Documentnumber, LineNo and ItemCode form a unique key.
Save the datamodel with these settings.

After that, create and execute the writeback definition in the same way as for the SalesHeader table.

Convert the Excel sales ledger into a dedicated write-back sheet
Now that the basic write-back definition has been created and the data on the Excel sales ledger has been written back to the database, we will improve the Excel sales ledger into a dedicated write-back sheet based on that data.
By repeating the steps below, you will be able to manage the input of sales data.
1. Synchronize the data in the database and the Excel sales ledger using queries.
2. Enter the new data into the Excel sales ledger.
3. Update the database using the write-back definition of the Excel sales ledger.
Take a back up of the Excel sales ledger before updating it.
Query definition
Add a table JOIN to the SalesDetail table definition in the datamodel before creating the query. When creating a query, it is very convenient.
This is a JOIN that is created on Sharperlight's datamodel, not on the actual database.
Select the DocumentNumber field and click New Join from the right-click menu.

A JOIN creation support dialog will be displayed, so create a JOIN to the SalesHeader table.
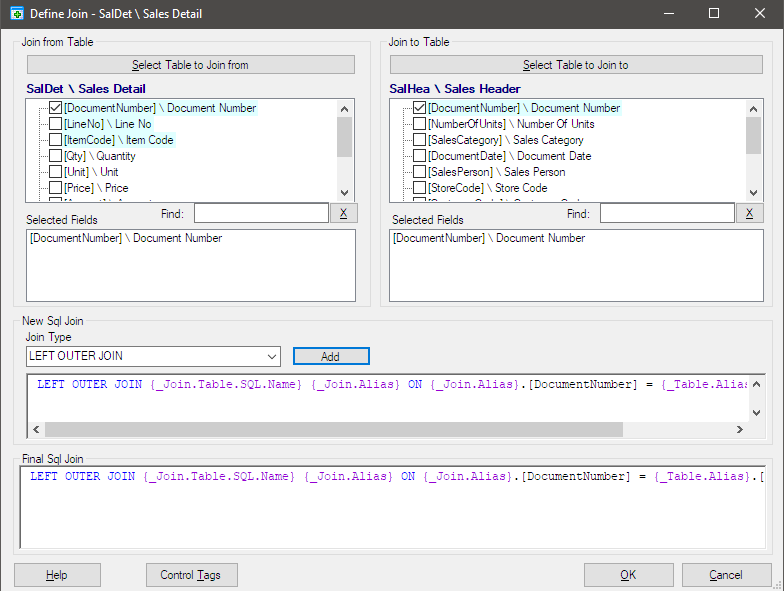
A table join has been created. Save the datamodel.

Back in the Excel Sales Ledger, log off Sharperlight and log in for the changes to the datamodel to take effect.
Add a row to the top. After selecting cell A1, click the Table icon from the Sharperlight ribbon to open the Query Builder.
In Query Builder, make a query as shown below.

It is a good idea to match the field descriptions of the output items with the table header names of the Excel sales ledger.

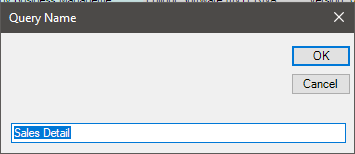
When click OK button on the query builder, a dialog prompting you to enter a query name will be displayed. Enter the query name and press OK.
A Sharperlight table formula is set in cell A1 and the query is executed immediately, but the results are not displayed as they are blocked by the existing Excel table.
Delete an existing table on the sheet. As soon as the existing table is dropped, the Sharperlight table formula will be executed again and a new table will be created.

Updating writeback definition
Now that the query has recreated the table, let's review the writeback definition we created earlier.
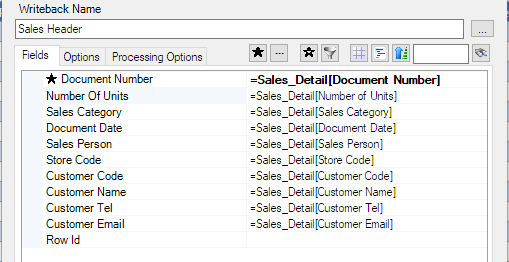
Open the saved Sales Header writeback definition and clear all mapping information.

Select the DocumentNumber of the writeback definition and double-click the header of the Excel table. A new mapping is created.
Save with the Close button.
In the same way the Sales Detail writeback definition also updates the mapping.
Executing the query and the writeback with buttons
Query and two writeback operations can be done with buttons.
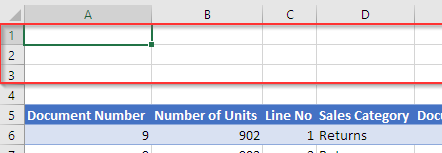
Add 3 more rows to the top of the Excel sheet. Place the buttons here.
Button for executing the query
From the Sharperlight ribbon, select Button->Recalculate->mdRecalcActiveWorksheet.
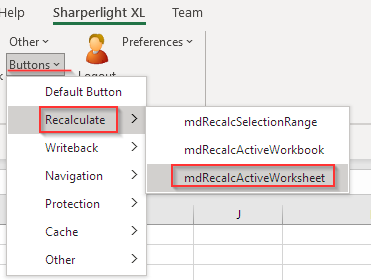
A button to run the query is added like this.

Link the query formula defined in cell A4 to this button.
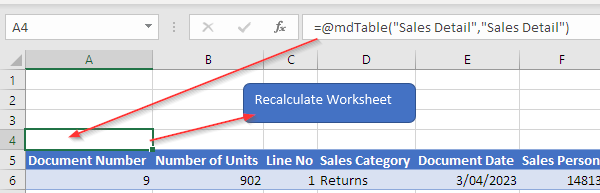
Select cell A4 and select Sharperlight XL -> Edit Button/Table Bindings from the right-click menu.

When Button Table Binding dialog open, set the target button's name, the target quert's name, the cell reference where the Sharperlight formula is and the corresponding table's name.
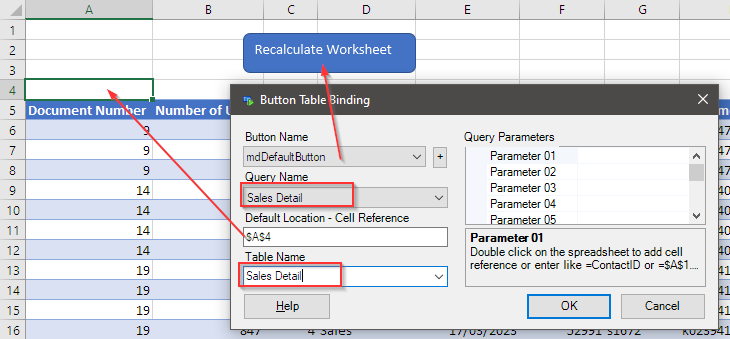
Press OK button to make the link.
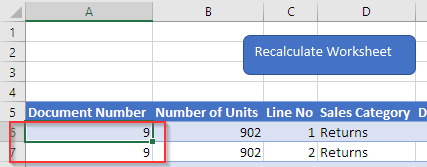
Delete the value in the cell A6 and A7.
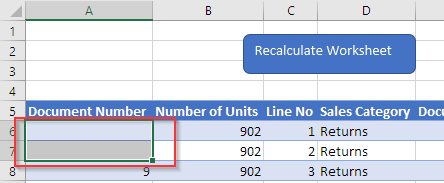
Then click the recalculate button to see it works fine.
Now we can remove the formula from the cell A4.
Button for executing the writebacks
Then add buttons to execute the writeback definitions.
From the Sharperlight ribbon, select Buttons->Writeback->mdWriteBack.
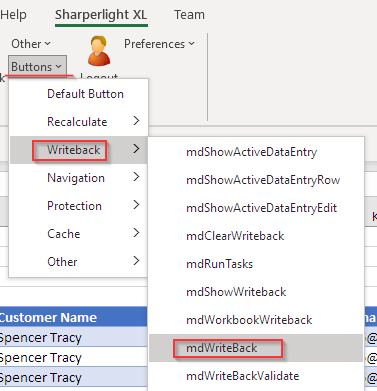
A list of write-back definitions will be displayed. Select a definition to be associated with this button to create a write-back button.
After adding two writeback buttons, edit the caption.

This saves the trouble of calling the writeback definition each time and executing it with the execute button on the writeback definition dialog.
Showing writeback log on the sheet
Finally, since the log information dialog that opens whenever the writeback is executed, change the writeback definition so that it is displayed in the specified location on the sheet.
Open each writeback definition and go to the Processing Options tab.
Specify a cell reference in the Logging Cell option.

Adjust the cell attributes on the specified sheet so that the log information is displayed well.
Now it is possible to write data back to the database using this sheet.
After synchronizing the sales ledger excel sheet with the database using the query button, add new sales records to it.
Then use the WB: Sales Header button to write the new record's header information back to the database first. Finally, use the WB: Sales Detail button to write its details of the new record back to the database.
For the time being, it is now possible to writeback the daily sales data to the database by following these steps.
Creating reports
With the above, the data in the Excel sales ledger has been migrated to the database.

After that, I will try to visualize the data using Sharperlight.
Reports
Of course, we can use the Sharperlight Excel add-in to create reports in Excel, but we can also create web reports with the Sharperlight Publisher and share them in our organization network using the Sharperlight service. It is also possible to publish the reports to the outside of the internal network after performing various security settings.
Start Sharperlight Publisher. Start creating a new report with the New button.

When the web report dialog opens, fill in the Code, Group, Title, etc. and start building the query with the Edit Query button.

Specify Summary Report for Mode, ABC Company Business Management for Product, and Sales Detail for Table.
A list of selectable fields is displayed in the selection area, so use them to set filters and output items.
I set a filter on the Sales Category and Document Date fields. The value DATE -2m in the Document Date filter is a Sharperlight-specific symbol that means 2 months ago (minus 2 months) from the current date. Also, the Year/Month option is set to the filter.
So if the query is executed on 15 May 2023, the generated WHERE clause will look like this:
CAST(YEAR(J002.[DocumentDate]) AS varchar(20)) + '/' + RIGHT('0' + CAST(MONTH(J002.[DocumentDate]]) AS varchar(20)),2) BETWEEN N'2023/03' AND N'2023/03'
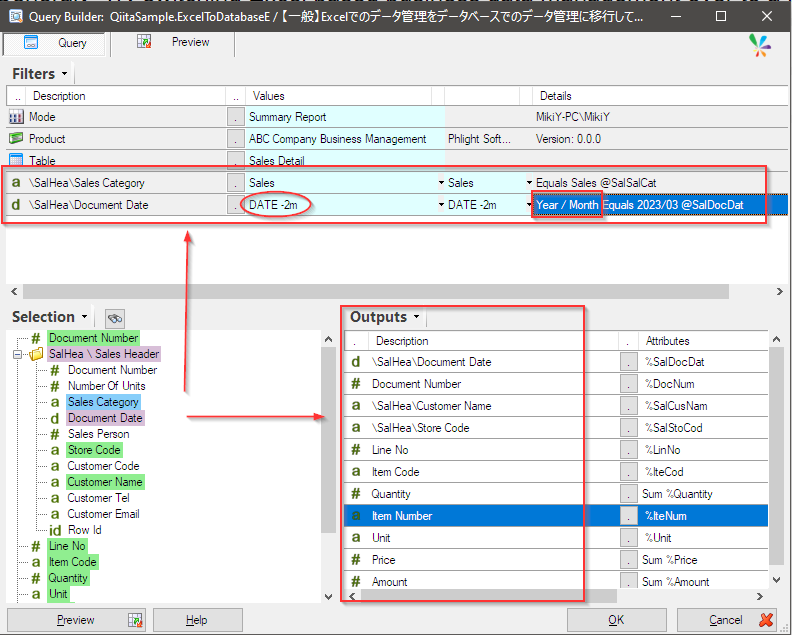
Now, save the query with the OK button, and save the web report with the OK button as well.
Start the Sharperlight service and open the report we just created in the browser. The report should be displayed with the URL below.
http://localhost/DemoRest/Report/?query=QiitaSample.ExcelToDatabaseE
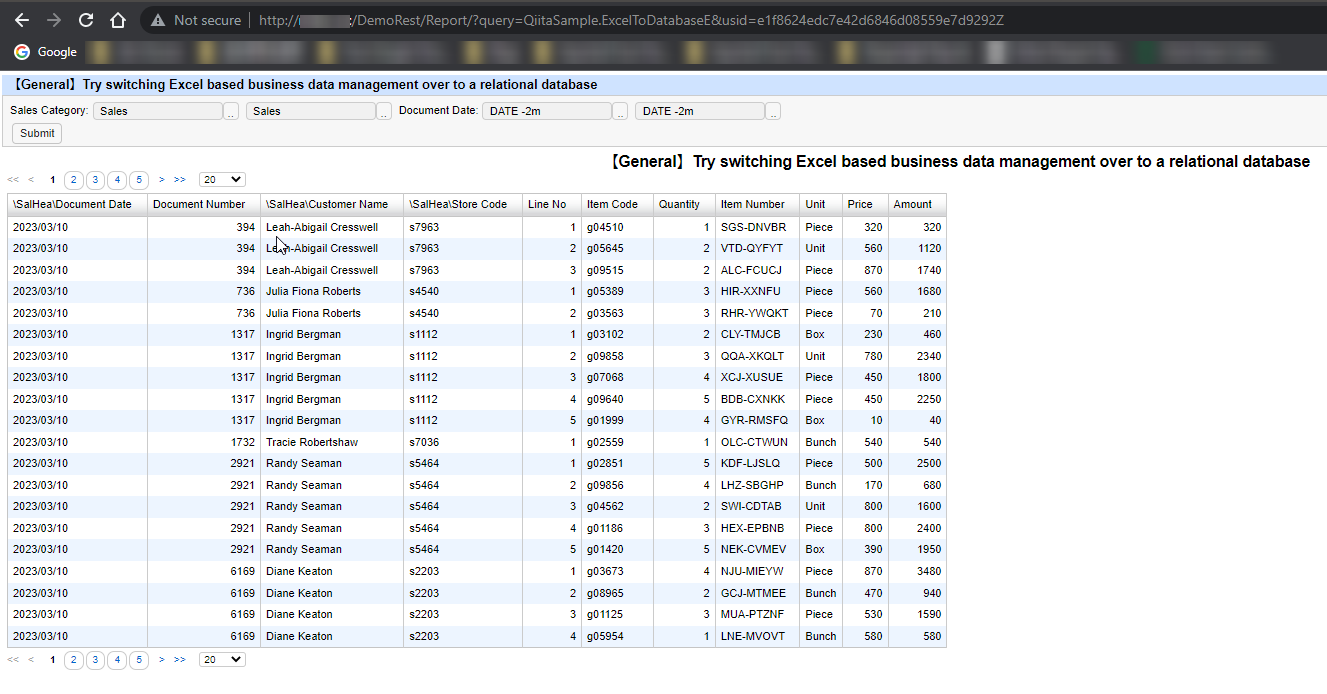
Let's edit it some more.
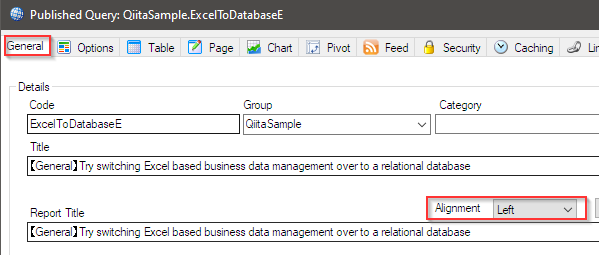
Edit the title of the report to appear on the left. It can be changed with the Alignment option on the General tab.
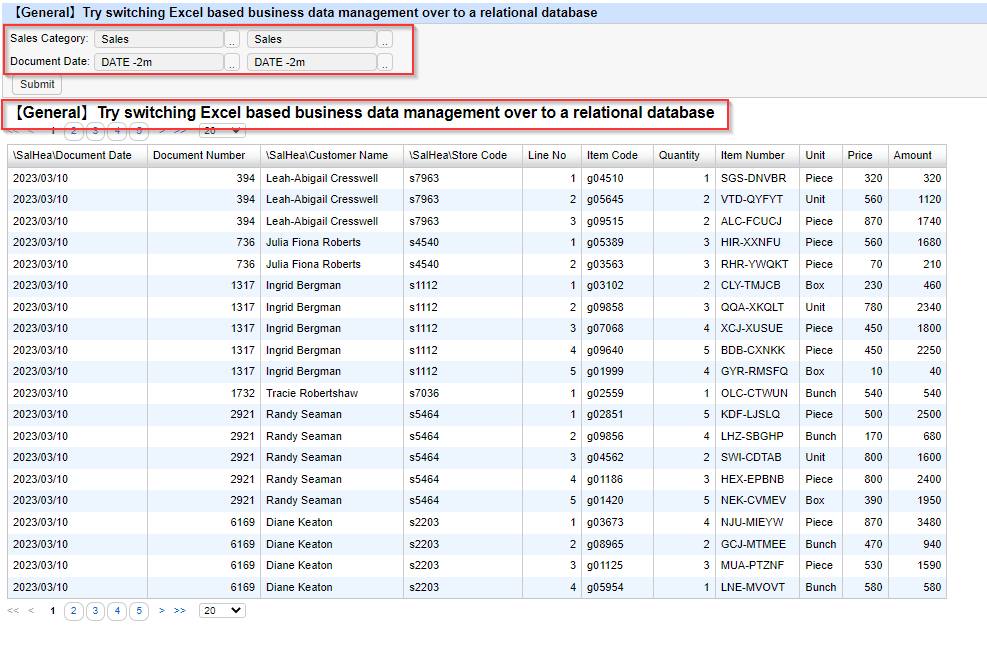
Displays prompts (filters) aligned vertically (over two lines). On the Options tab, set the Items per Row attribute of the Prompt options to 1. Display only one filter per line, this time there are 2 filters, so it will be displayed on 2 lines.

Now save the changes and refresh the report in the browser with F5! How about that!?
In addition, try grouping by document number.
Before do it, let's rename the description of the some output columns.
- \SalHea\Document Date
- \SalHea\Customer Name
- \SalHea\Store
Open the query definition.
Select Change Description from the right click menu on each column and rename them.

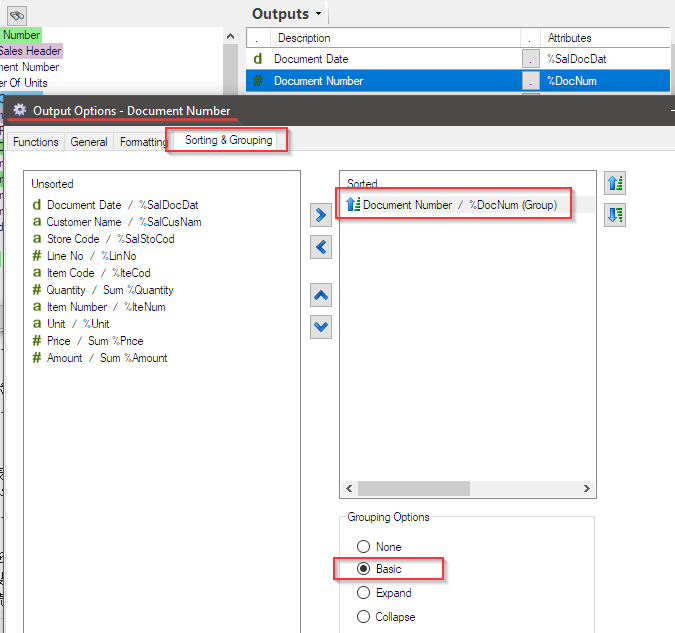
For grouping, open Output Options for Document Number output column.
On the Sorting and Grouping tab of the Output Options dialog, specify Document Number and set the Grouping Options Basic.
Now save the changes and refresh the report in the browser with F5! How about it!?

Chart
Let's display the transition of sales slips and return slips in a chart.
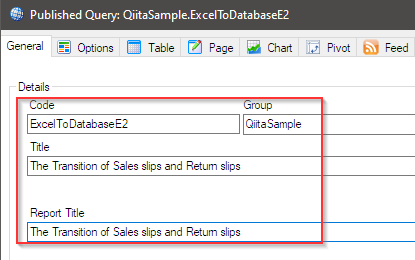
Create a new report. Fill in code, group and title etc..
Start creating a query with the Edit Query button.
Just like the report we created earlier, we set the Mode, Product, Table, some filters, and also specify the output items.
This time, we prepared two Sales Category filters for Sales and Returns. This will be used for the output items described below.
First set the Document Date for the output item. In addition, set two Document Number columns. One counts sales slips and the other counts return slips. Rewrite their descriptions as Sales Document and Return Document.

For the option to count sales documents, select Count for the Aggregations attribute, and select the Sales Category: SALES filter for the Apply Filters to this Output attribute.
For the option to count returns documents, select Count for the Aggregations attribute, and select the Sales Category: RETURNS filter for the Apply Filters to this Output attribute.


This setting will generate a SQL statement like this:
,COUNT( CASE WHEN (J002.[SalesCategory]=N'Sales'
) THEN J001.[DocumentNumber] ELSE NULL END )
,COUNT( CASE WHEN (J002.[SalesCategory]=N'Returns'
) THEN J001.[DocumentNumber] ELSE NULL END )
Check the query with the preview function.

Save the query and return to the report dialog.
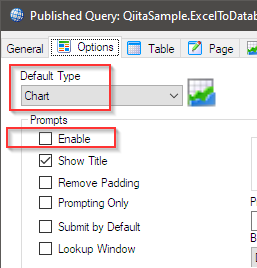
On the Options tab set the Default Type to Chart and disable Prompts.
In the Chart tab, set the Chart Type to Area, Size: Auto Width to 1300, Rotation Title - Degrees to Minus 45 degrees, and Custom Title should be # Documents.

Now save the report and view it in the browser.
http://localhost/DemoRest/Report/?query=QiitaSample.ExcelToDatabaseE2
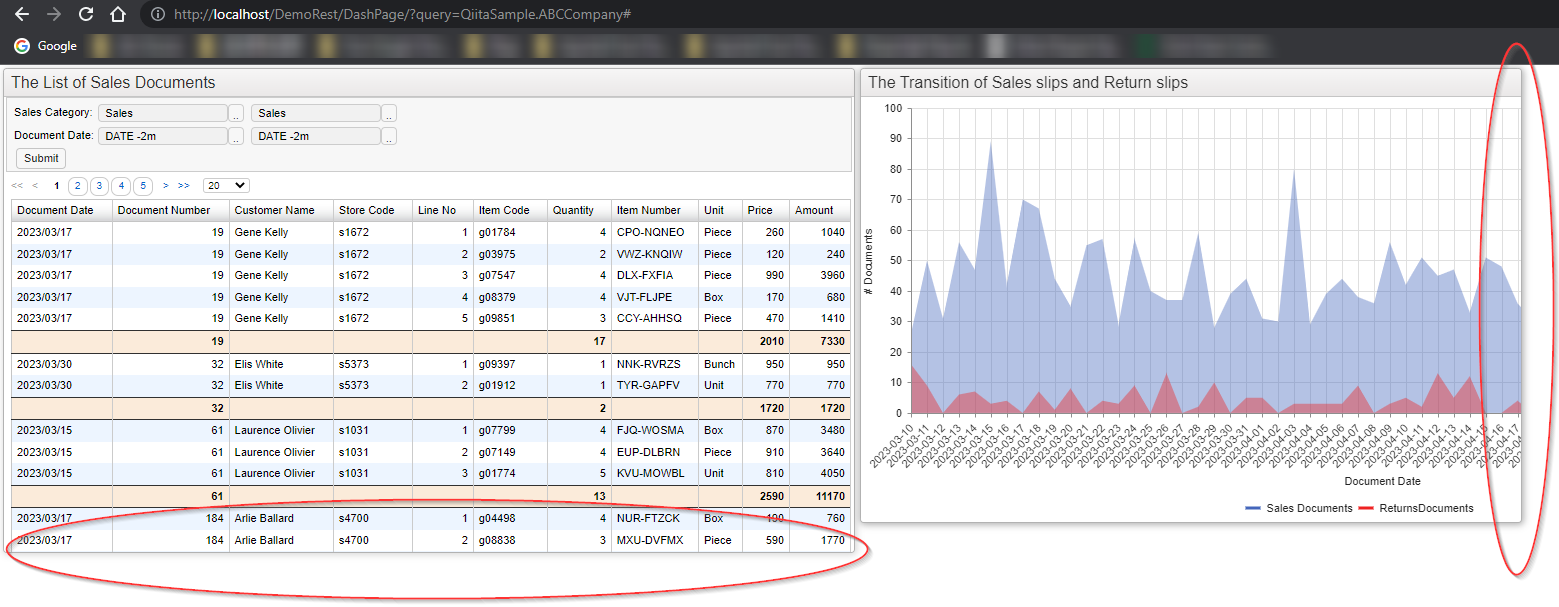
A chart like this was displayed.

Dashboard Page
I will use the Sharperlight Dashboard Pages to tile the two reports created earlier.
Launch the Dashboard Pages from the application menu.
Start creating a new dashboard page with the New button.

The dashboard page definition dialog is displayed.
Dashboard Page Details
In the General tab, fill in the information for this dashboard page. Code, Group and Title should be filled in at a minimum.

Tile Definition
The Tiles tab is where you actually define the tiles.
There are 4 tiles by default, but 2 is enough this time, so delete 2 with the Delete icon.

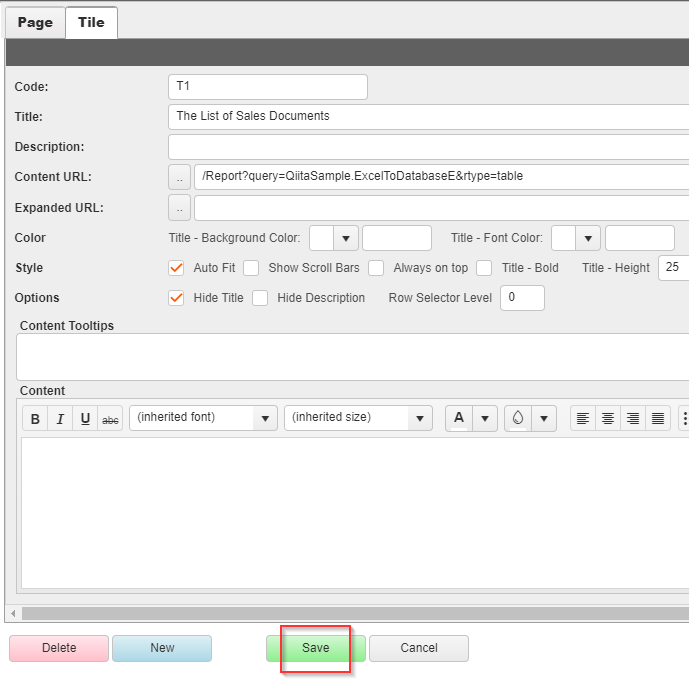
For the first tile, specify The List of Sales Documents for the Title, and specify the report created first for the Content URL. It can be searched using the search button on the right.

Turn on the option Hide Title attribute.

Finally, adjust the size and position in the Edit Layout grid.

Do the same for the chart tile. Specify The Transition of Sales slips and Return slips for Title, and specify the previously created chart report for Content URL. Specify the option &width=1000 to specify the width of the chart at the end of the specified content URL as follows
/Report?query=QiitaSample.ExcelToDatabaseE2&rtype=chart&ctype=area&width=1000
Also turn on the optional Hide Title attribute.
Finally, adjust the size and position in the edit layout grid.
Then save it with OK button.
Validating and Editting Dashboard Pages
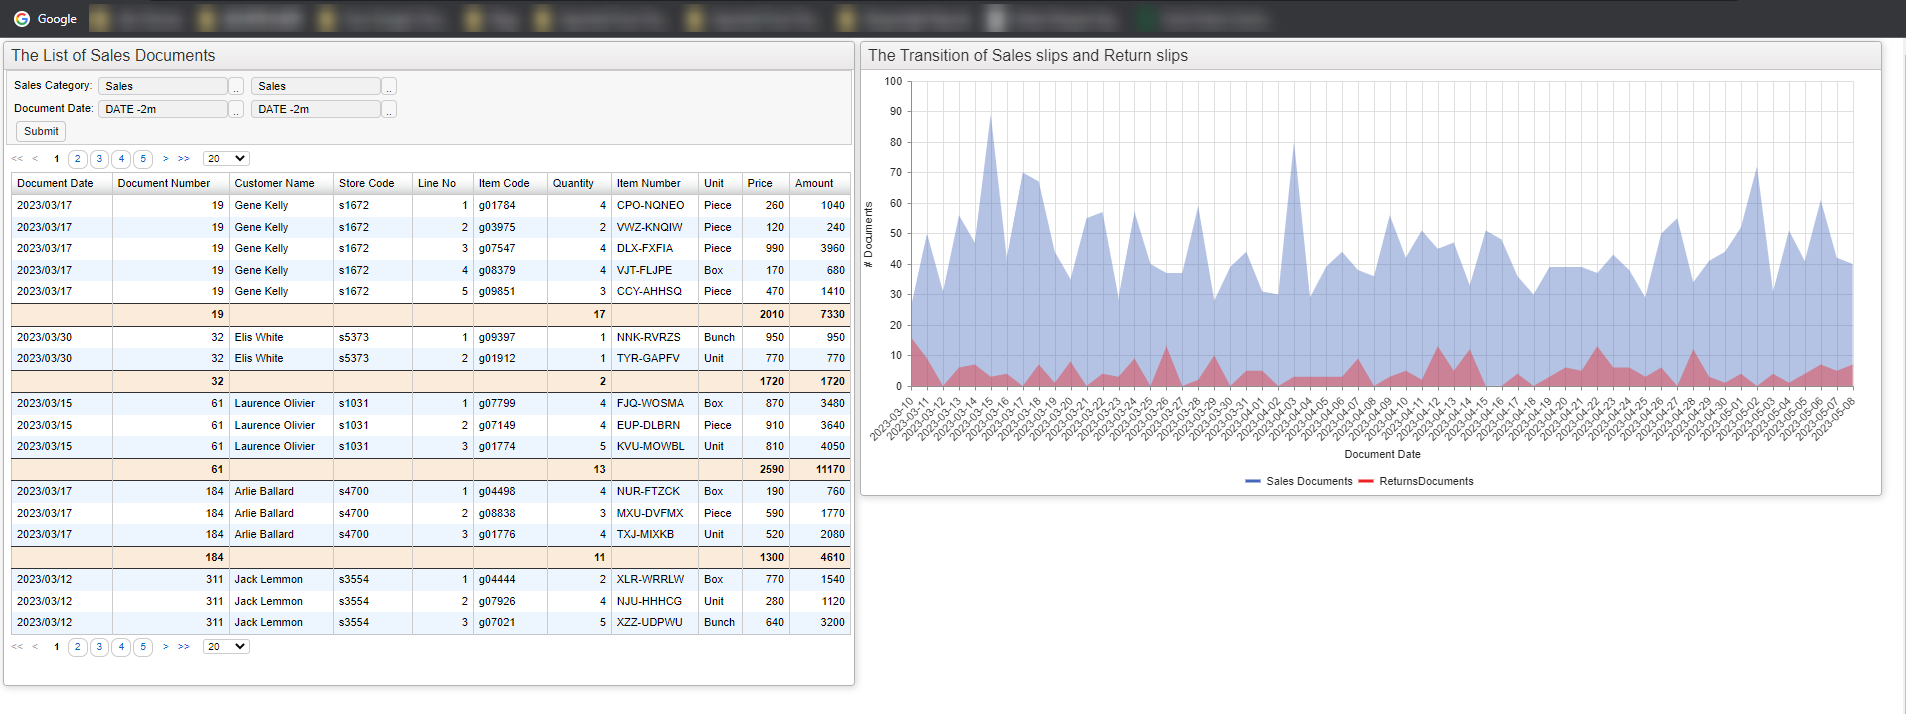
Select View Report from the right click menu on the Dashboard Pages dialog to display it in the browser.
At first, it seems that incomplete tiles that are partially not displayed well like this will be displayed.
Pull the corners of the tiles to adjust their size, or drag the tiles themselves to align them so that the content looks right.
After making adjustments, click the Gear icon that appears in the upper right corner of any tile to open the options page.

When the option page opens, save the adjusted size and position with the Save button.
Well, what do you think?
Postscript
It's a long article, but I hope that you can find something useful in this article and help you.