Introduction
I’m using Sharperlight Form Designer to design the fields of a table for capturing data and generating reports both on the web and in Excel.
Currently, I'm focusing on capturing data in Excel with Sharperlight Form Designer. While Excel is a great tool for data capture, it’s not easily shareable within the organization. Therefore, I plan to convert this into a form design. Once that’s complete, I’ll be able to enter data via the web and generate reports in both Excel and on the web.
Creating table and its fields in a database, capturing data and transferring data to the table, preparing the entry form on the web, they are all done by Sharperlight Form Deisgner.
Sample Data
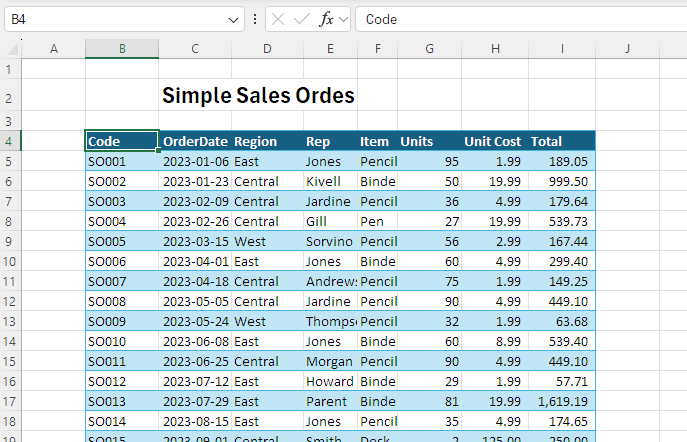
I use a simple Sales Order data here.
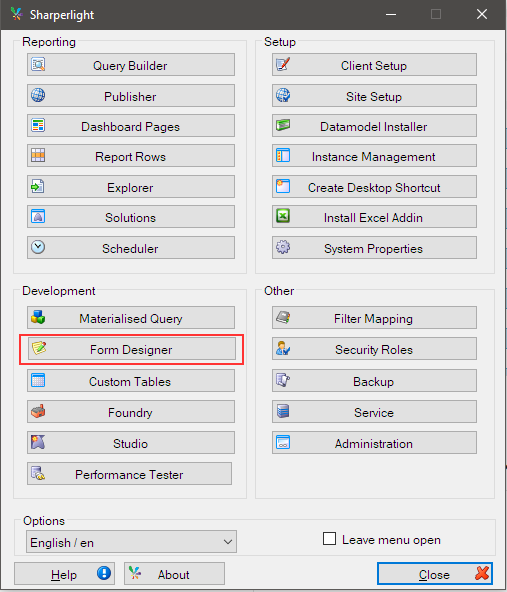
Sharperlight Form Designer
New Form
Let's start creating a new form.
I can start creating a new form with the popup menu,

or with New button.

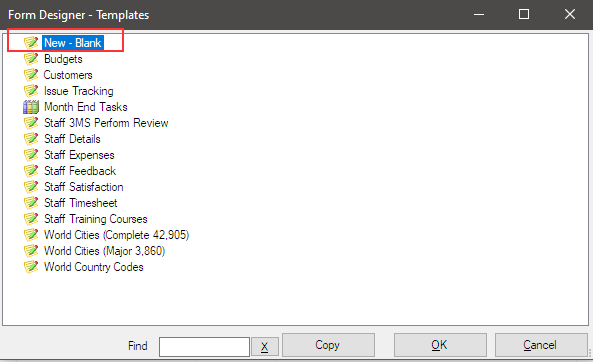
The template list is displayed, and choose New - Blank.
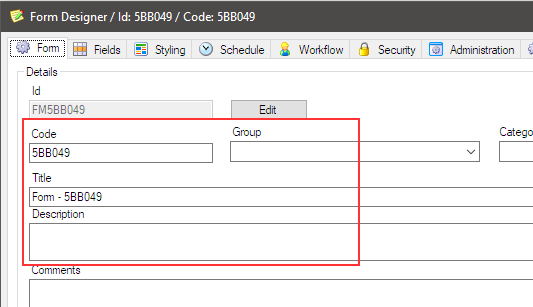
Once the new form dialog is opened, input Code, Group and Title at least.
Designing Fields
I move to Fields tab and I can design fields one by one here.
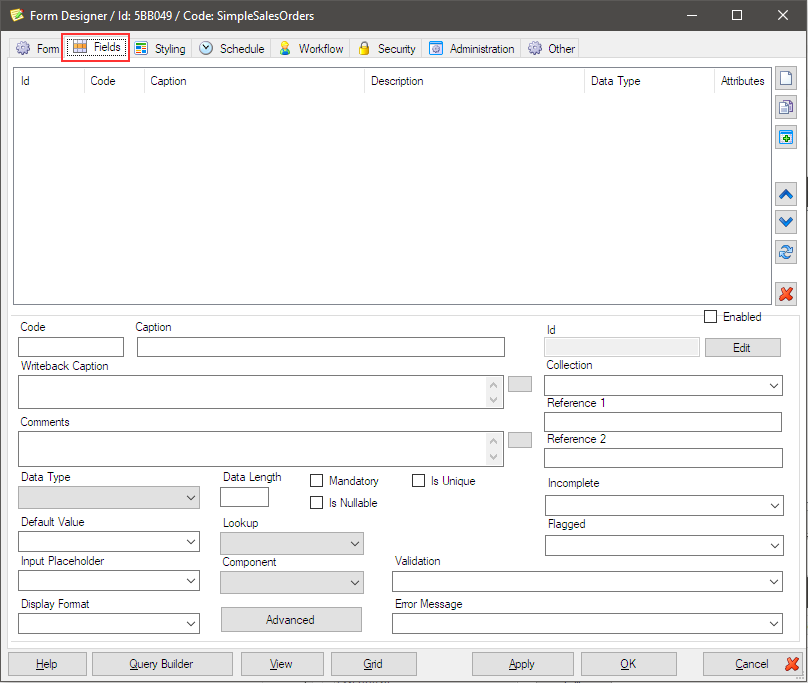
Let’s start by creating fields using the Excel sheet as the base.

To create a field, begin by clicking the New icon.
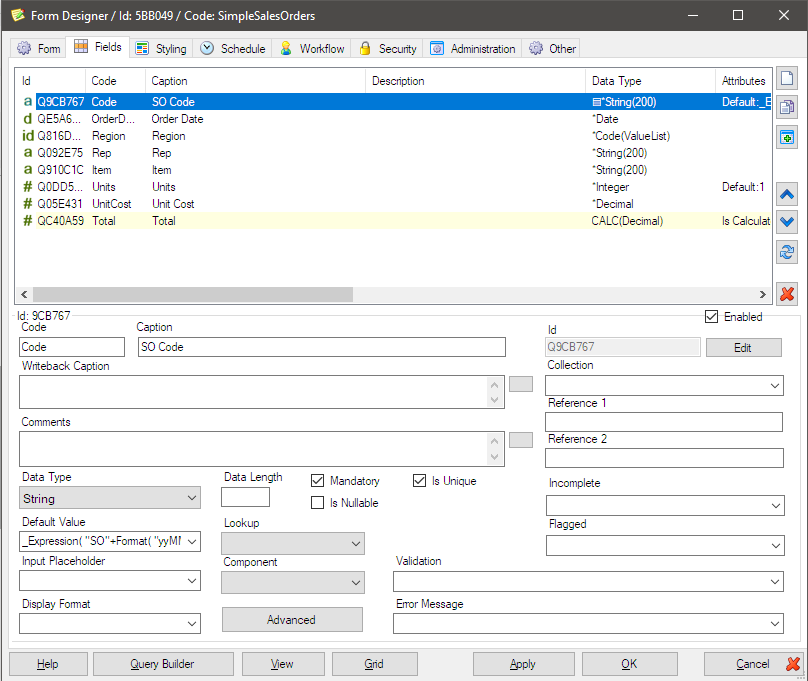
| SOCode | |
|---|---|
| Code | SOCode |
| Caption | SO Code |
| Data Type | String |
| Mandatory | true |
| Is Unique | true |
| Default Value | _Expression( "SO"+Format( "yyMMddHHmmss",Now())) \ |
| Order Date | |
|---|---|
| Code | OrderDate |
| Caption | Order Date |
| Data Type | Date |
| Mandatory | true |
| Region | |
|---|---|
| Code | Region |
| Caption | Region |
| Data Type | Code |
| Mandatory | true |
| Advanced - Value List | E=East C=Central W=West |
| Rep | |
|---|---|
| Code | Rep |
| Caption | Rep |
| Data Type | String |
| Mandatory | true |
| Input Placeholder | Enter your name |
| Item | |
|---|---|
| Code | Item |
| Caption | Item |
| Data Type | String |
| Mandatory | true |
| Units | |
|---|---|
| Code | Units |
| Caption | Units |
| Data Type | Integer |
| Mandatory | true |
| Default Value | 1 |
| Unit Cost | |
|---|---|
| Code | UnitCost |
| Caption | Unit Cost |
| Data Type | Decimal |
| Mandatory | true |
| Display Format | $#,##0.00 |
| Total | |
|---|---|
| Code | Total |
| Caption | Total |
| Data Type | Decimal |
| Mandatory | true |
| Display Format | $#,##0.00 |
| Advanced - Is Calculated | ([Units] * [UnitCost]) |
I also add two more fields to the form.
Add the following fields.

| Attention | |
|---|---|
| Code | Attention |
| Caption | Attention |
| Data Type | Color |
| Attachment | |
|---|---|
| Code | Attachment |
| Caption | Attachment |
| Data Type | File |
Click Apply to save the definition, and click View to show the form generated on the browser.
Please make sure the Sharperlight service is running.
An web input form is created at the same time as I design the fields that will hold the data.

Transferring data from Excel
Let's insert some data to the fields. I can input data one by one with the web form but I do bulk insert here.
Open the Excel sheet containing the Sample Sales Order data.
Login to Sharperlight.
Go for Writeback option.
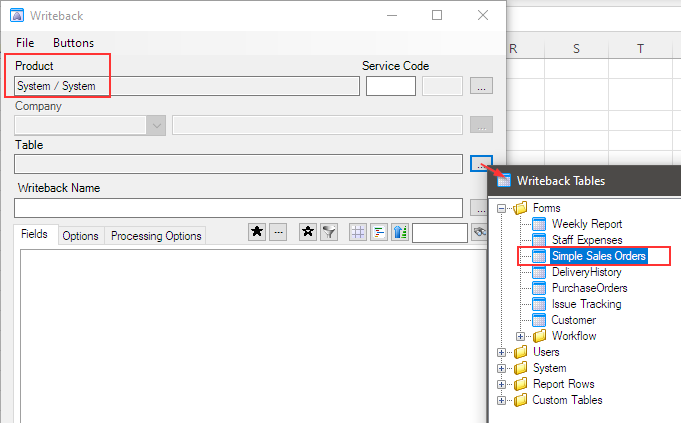
Choose System product where the form is saved as a table.
Select the form I just designed Simple Sales Orders.
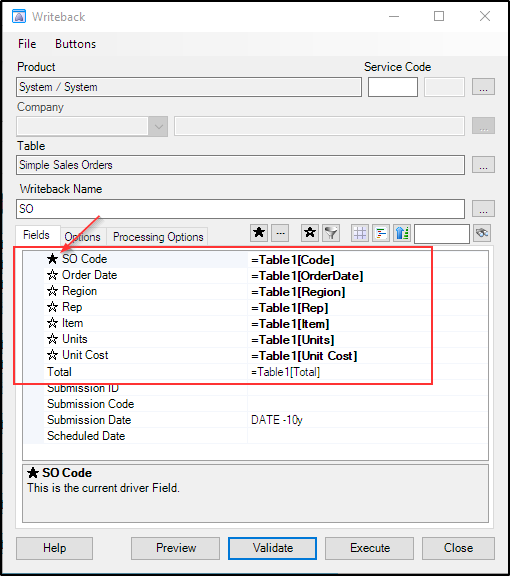
Map the fields, set SO Code field as the driver. (Black Star Icon)
Click Preview to check it.
Give a name for the writeback definition. I put SO this time.
Click Execute to push data to the table.
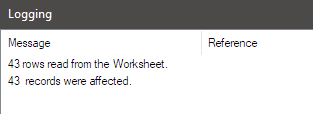
Viewing data in the form
Now I check the data transferred with Query Builder.
Create a new sheet.
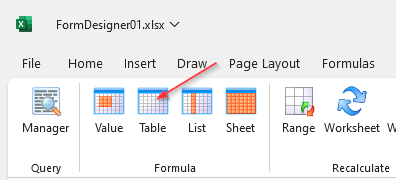
Select Cell B5, click Table formula icon to open query builder.
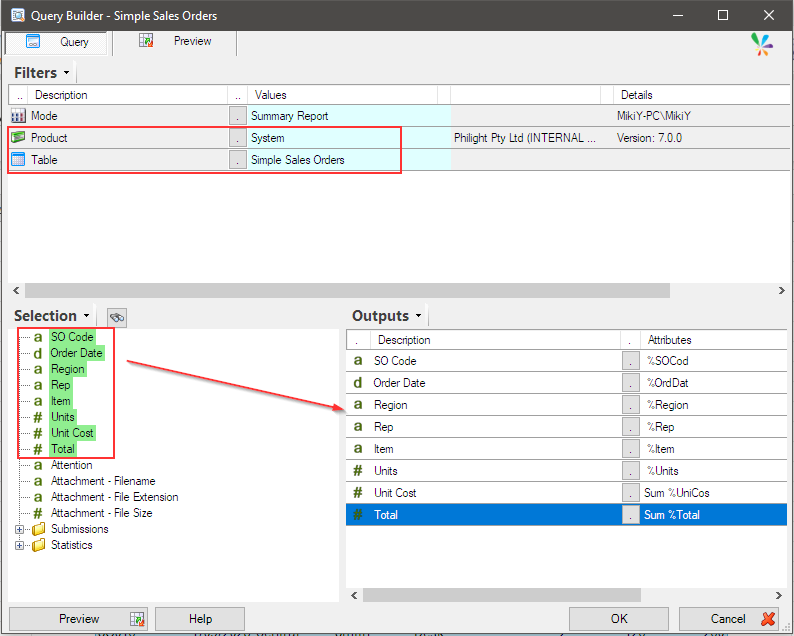
Choose System product and the Form designed, and select all fields to output.
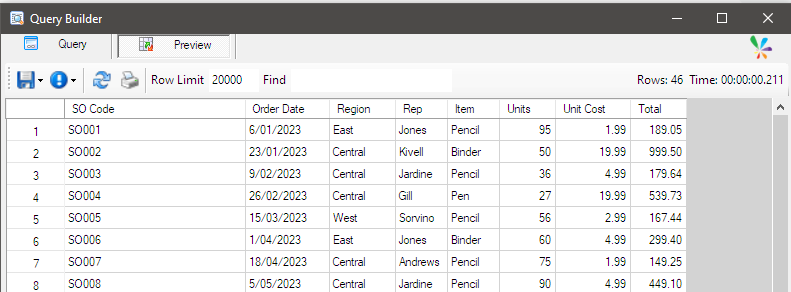
Click Preview button to see the query result.
Go back to Query definition, and click OK to populate a table onto the sheet.
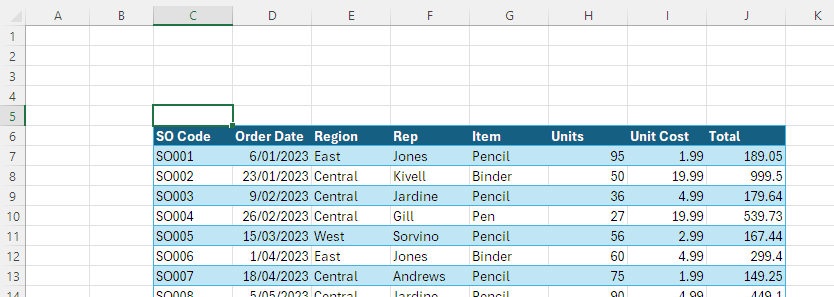
Managing data with an integrated web report
Open Sharperlight Publisher to create an integrated web report.
From the right-click menu, choose Other -> Create Table Reports.

Select System as Product.
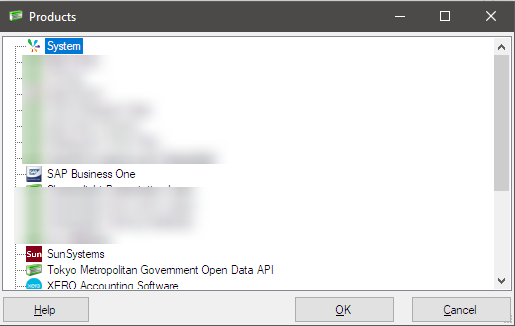
Select Sample Sales Orders form.

A report is created like this.

Open the report with the web browser by choosing View Report from the right-click menu.
I see the default pormpt first.

Click Submit button to show the table.
This is a simple web report.
However, we can edit the data with a form, or in a grid view.

Click the icon shown in the first column of a row.
The form is displayed like this, and I can update or delete the record.

Next, click the grid icon at the top-right corner of the report.
A Built-in grid editor is displayed.

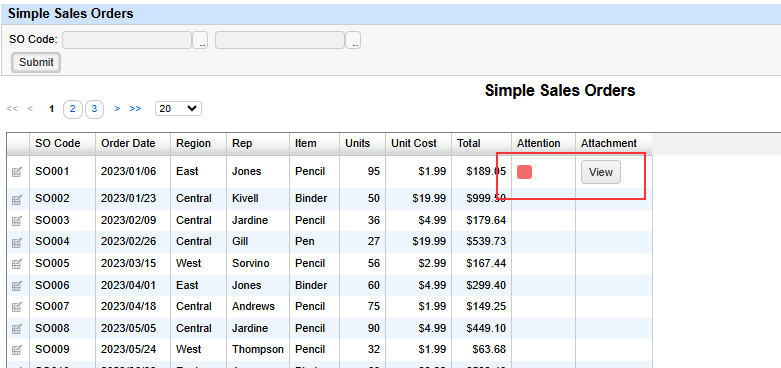
Let's set a colour for the Attention field. I can choose a colour with the color picker.

I also upload a file with the Upload button for the attachment.

Then save the changes.
Re-submit the main report, and I can now see the change I made.
Conclusion
This is just a part of the functionalities of Form Designer. We can still create simple web-based solutions with minimal effort and deploy them to the intranet or internet via the Sharperlight service.

