Introduction
This time, I will convert an Excel report with charts into a web-based spreadsheet. Here is how the converted spreadsheet looks:
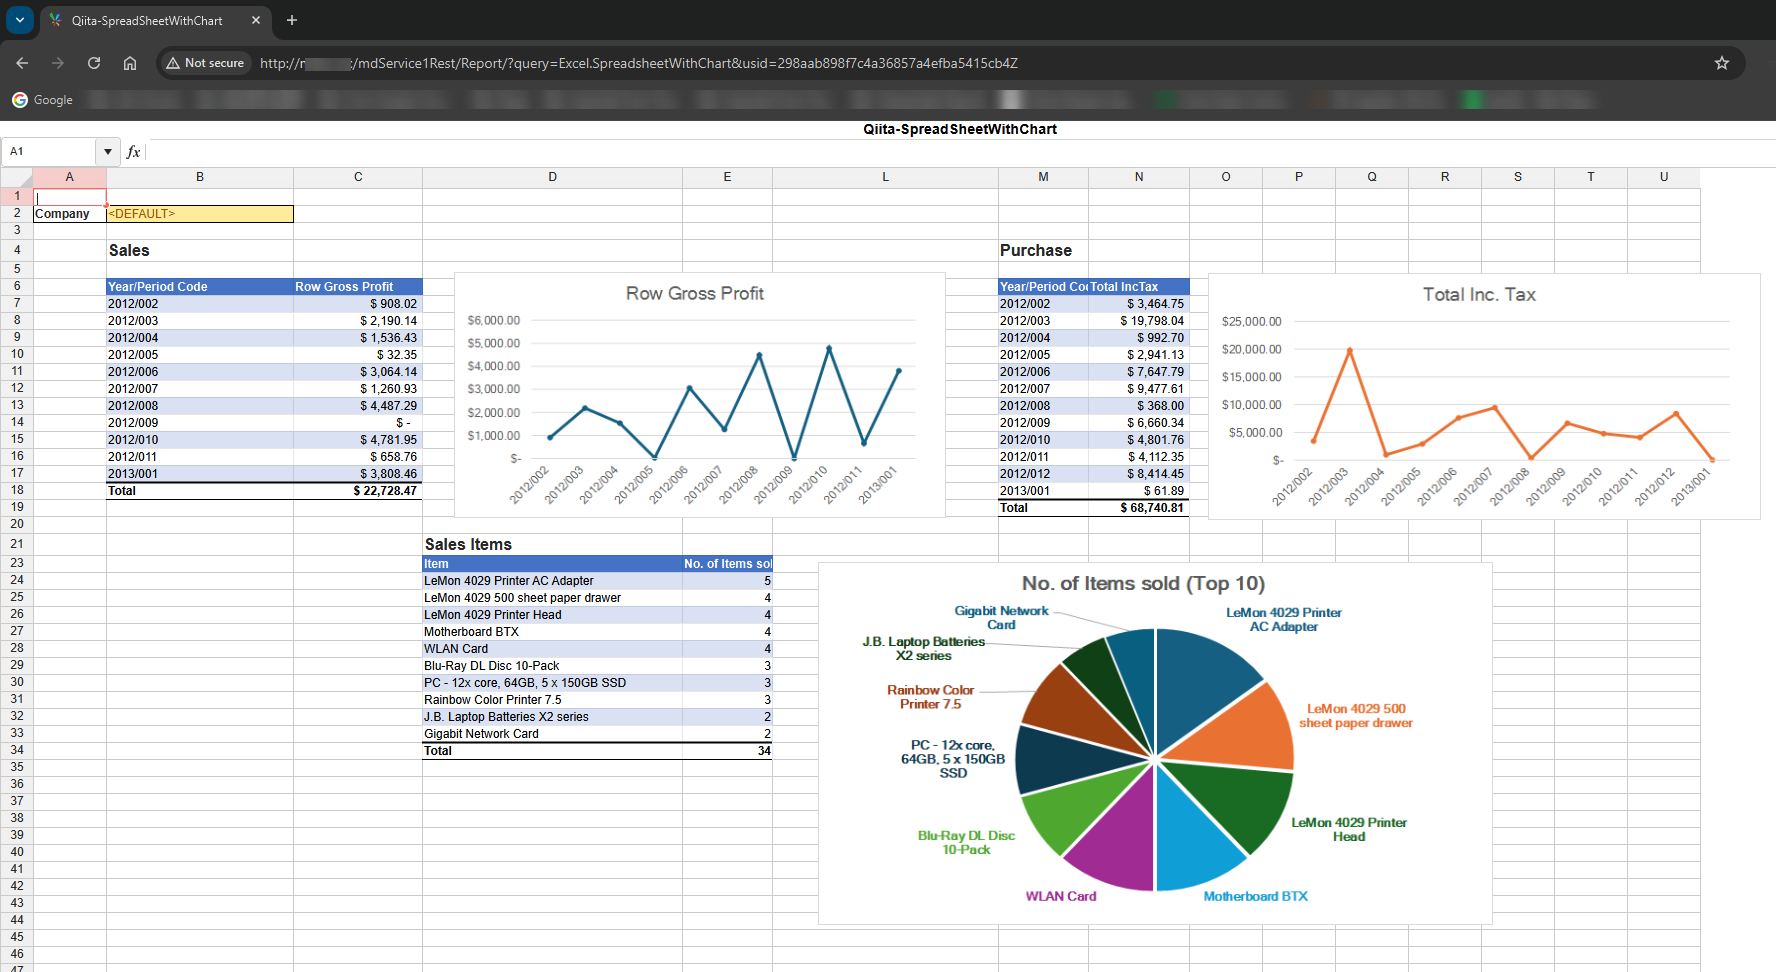
Now, let's review the steps.
Related Article
Excel Worksheet
I created three tables using Sharperlight table formulas with SAP Business One. The first table is defined in Cell B5 and pulls sales information.
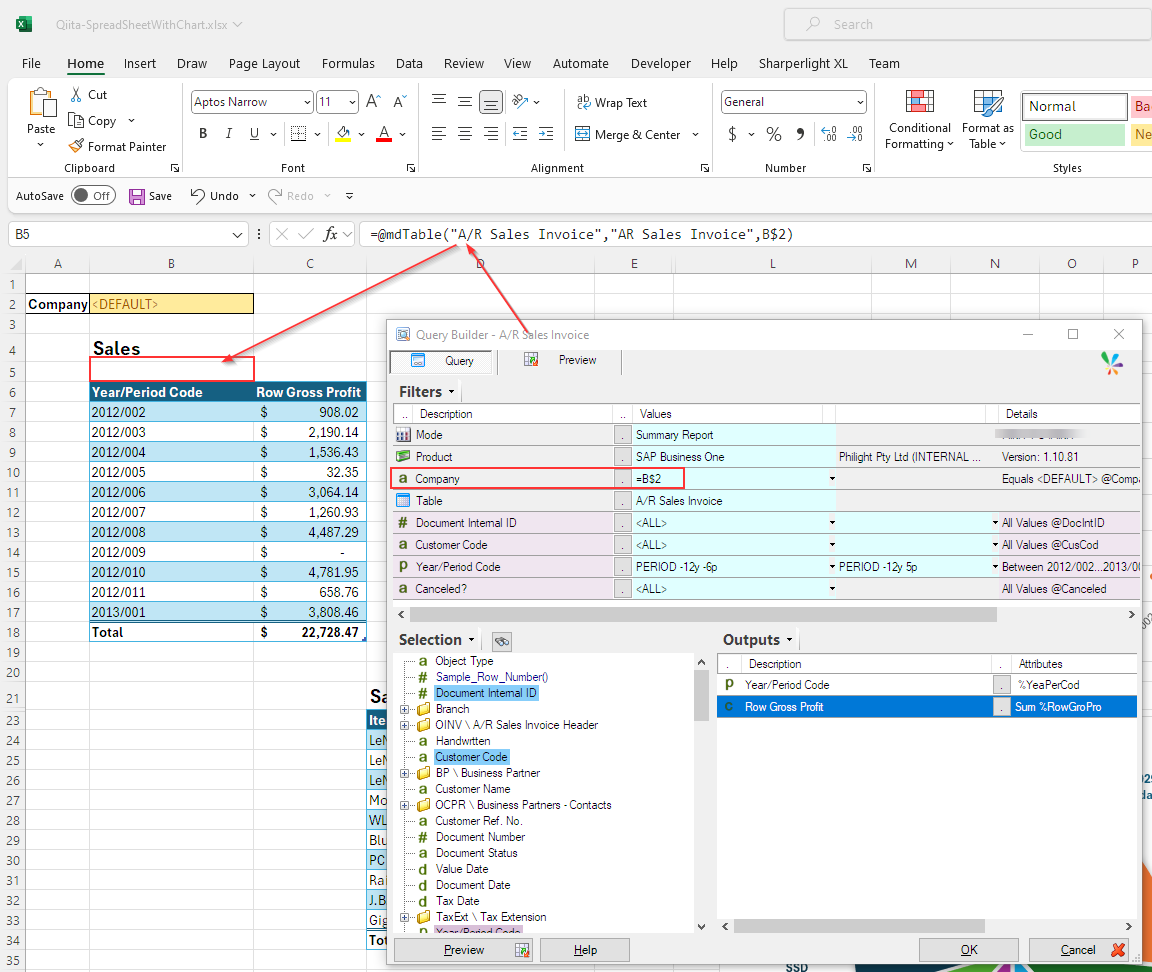
The second formula is in Cell M5 and pulls purchase information, while the third formula is in Cell D22 to retrieve sales items data.

Each table is accompanied by its own chart. The queries and the extracted data in the tables are managed using the Sharperlight Excel Add-in, and the charts are created using Excel's standard chart options.
Converting to Web Spreadsheet
I convert it to a web spreadsheet as a published report, making it accessible over the intranet or other networks where the Sharperlight Service is configured.
Select Publish Workbook icon from the Sharperlight ribbon.

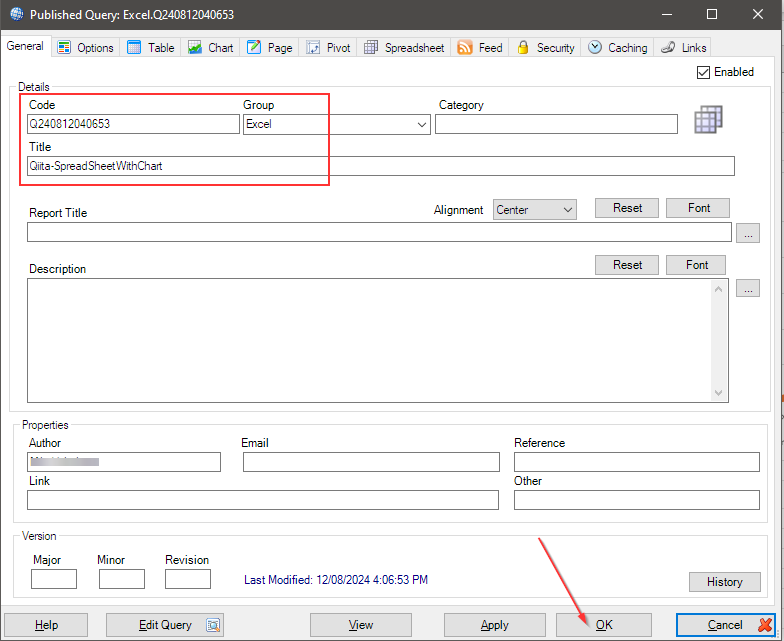
A new published report dialog is open, give appropriate Code, Group and Title, and click OK to save it as a published report.
The published report will be saved in the local Sharperlight if you are using a local connection, or in the remote Sharperlight if you are using a remote connection. Start the Sharperlight service you are using and navigate to the URL of the recently published report, as shown below.
http(s)://{server name}/{Sharperlight Service Code is here}Rest/Report/?query={Group}.{Code}

Conclusion
It can be utilized in various ways, such as sharing useful reports stored on individual employees' computers within the company, or centrally managing multiple similar reports. Give it a try.