目次
1.はじめに
2. PrometheusとThanosを統合する理由
3. Thanosの概要
3.1 Thanosアーキテクチャ
3.2 Thanosサイドカー
3.3 Thanosストア
3.4 Thanosクエリ
3.5 Thanos Compact
3.6 Thanos Ruler
4. Thanosの実装
5.デプロイメント
6. Grafanaダッシュボード
7.まとめ
1.はじめに
この記事では、Thanosを統合するクラスター化されたPrometheusセットアップをデプロイしていく過程を説明していきます。 ノード障害に対する回復力があり、適切なデータアーカイブを保証すると共に、セットアップもスケーラブルです。 同じ監視傘の下で複数のKubernetesクラスターにまたがることができます。 最後に、すべてのデータを視覚化し、アクセス可能な美しいGrafanaダッシュボードで監視する方法も説明していきたいと思います。
2. PrometheusとThanosを統合する理由
Prometheusはフェデレーションセットアップを使用してスケーリングされ、そのデプロイはポッドに永続ボリュームを使用します。 ただし、連合メカニズムを使用してすべてのデータを集約できるわけではありません。 多くの場合、Prometheus構成を管理するには別のツールが必要なのです。 これらの問題に対処するために、Thanosを使用します。 Thanosを使用すると、Prometheusの複数のインスタンスを作成し、データの重複排除し、GCSやS3などの長期ストレージにデータをアーカイブできるようになります。
3. Thanosの概要
3.1 Thanosアーキテクチャ
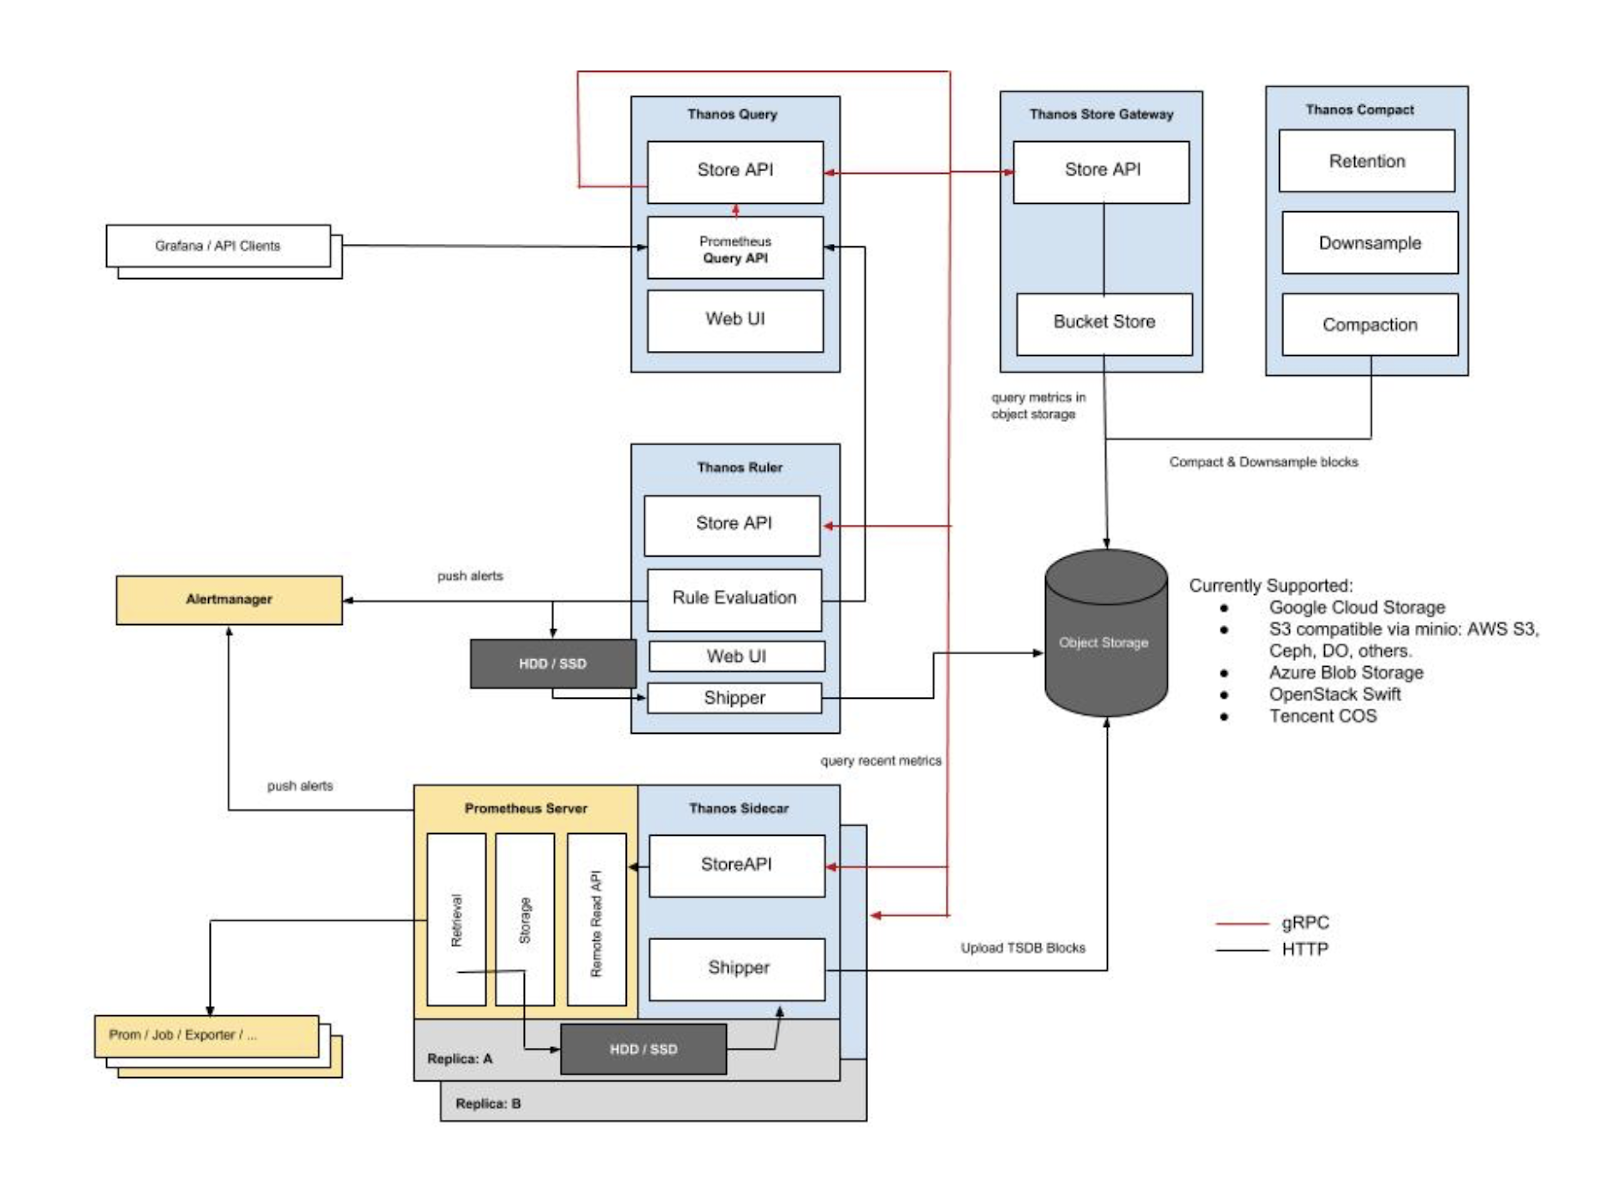
Thanosの構成要素は、サイドカー、ストア、クエリ、コンパクト、ルーラーです。それぞれが何をするのかを見てみましょう。
3.2 Thanosサイドカー
- Prometheusに従って機能するメインのコンポーネント
- オブジェクトストアのデータを読み込み、アーカイブ
- Prometheusの設定とライフサイクルの管理
- Prometheus の設定に外部ラベルを注入して、各Prometheusインスタンスを区別
- Prometheus サーバーのPromQLインターフェイス上でクエリを実行
- ThanosのgRPCプロトコルから、gRPCとREST間のクエリを変換
3.3 Thanosストア
- オブジェクトストレージバケット内の履歴データの上にStore APIをインプリメント
- 主にAPIゲートウェイとして動作するため、ローカルディスク容量を大幅に必要としない
- 起動時にThanosクラスタに参加し、アクセス可能なデータを宣伝
- ローカルディスク上のすべてのリモートブロックの情報をバケットと同期させ保持
- このデータは一般的に再起動時に削除しても安全ですが、起動時間が長くなる
3.4 Thanosクエリ
- HTTPをリッスンし、クエリをThanosのgRPC形式に変換
- 異なるソースからのクエリ結果を集約し、サイドカーとストアからデータを読み取る
- HA の設定では、Thanos Query は結果を重複排除
HAグループの実行時の複製に関する注意事項
Prometheusはステートフルであり、データベースの複製を許可していません。そのため、複数のPrometheusレプリカを実行して高可用性を高めることは容易ではありません。
単純なロードバランシングも機能しません。レプリカはアップしているかもしれませんが、クエリを実行すると、ダウンしていた期間の間、わずかなタイムギャップが発生します。これは、2つ目のレプリカを持っていても修正されません。なぜなら、2つ目のレプリカはいつでもダウンしている可能性があり、例えば、ローリング再起動時などにダウンしてしまうからです。これらの例は、ロードバランシングがいかに失敗するかを示しています。
Thanos Query は両方のレプリカからデータを取り出し、それらのシグナルを重複排除して、もしあればギャップを埋めて Querier コンシューマに送信します。
3.5 Thanos Compact
Prometheus 2.0 ストレージエンジンの圧縮手順をオブジェクトストレージのブロックデータに適用します。
一般的には安全なセマンティクスとは並行しておらず、バケットに対してシングルトンとしてデプロイされなければなりません。
データのダウンサンプリングを担当し、40時間後に5分ダウンサンプリング、10日後に1時間ダウンサンプリングします。
3.6 Thanos Ruler
Thanos Rulerは基本的にはクエリーと同じことをしますが、Prometheusルールのためのものです。唯一の違いは、Thanosのコンポーネントと通信できることです。
4. Thanosの実装
前提条件: このチュートリアルを完全に理解するためには、以下のものが必要です。
-
Kubernetes と kubectl の実務的な知識
-
- 3ノード以上の稼働中のKubernetesクラスタ(GKEを使用します)
-
Ingress ControllerとIngressオブジェクトの実装(Nginx Ingress Controllerを使用します)。必須ではありませんが、外部エンドポイントを減らすために強く推奨されています。
-
-
Thanosコンポーネントがオブジェクトストア(ここではGCSバケット)にアクセスするために使用するクレデンシャルの作成
a. 2つのGCSバケットを作成し、それらを prometheus-long-term と thanos-ruler という名前にします。

b. ストレージオブジェクト管理者としての役割を持つサービスアカウントを作成します。

c. キーファイルをjson credentialsとしてダウンロードし、名前をthatos-gcs-credentials.jsonとします。

d. 次のスニペットにあるように、資格情報を使ってKubernetesのシークレットを作成します。
-
kubectl create secret generic thanos-gcs-credentials --from-file=thanos-gcs-credentials.json -n monitoring
5 デプロイメント
Prometheusのサービスアカウント、クラスターロール、およびクラスターロールバインディングの配置 以下のマニフェストは、Prometheusが必要とする監視ネームスペース、サービスアカウント、クラスタロール、およびクラスタロールバインディングを作成します。
apiVersion: v1
kind: Namespace
metadata:
  name: monitoring
---
apiVersion: v1
kind: ServiceAccount
metadata:
  name: monitoring
  namespace: monitoring
---
apiVersion: rbac.authorization.k8s.io/v1beta1
kind: ClusterRole
metadata:
  name: monitoring
  namespace: monitoring
rules:
- apiGroups: [""]
  resources:
  - nodes
  - nodes/proxy
  - services
  - endpoints
  - pods
  verbs: ["get", "list", "watch"]
- apiGroups: [""]
  resources:
  - configmaps
  verbs: ["get"]
- nonResourceURLs: ["/metrics"]
  verbs: ["get"]
---
apiVersion: rbac.authorization.k8s.io/v1beta1
kind: ClusterRoleBinding
metadata:
  name: monitoring
subjects:
  - kind: ServiceAccount
    name: monitoring
    namespace: monitoring
roleRef:
  kind: ClusterRole
  name: monitoring
  apiGroup: rbac.authorization.k8s.io
---
Prometheusの設定configmapをデプロイします。
以下の config map は、Thanos サイドカーコンポーネントが読み込む Prometheus 設定ファイルのテンプレートです。このファイルは、同じポッドで動作している Prometheus コンテナによって消費され、設定ファイルにexternal_labelsセクションを追加することは非常に重要であり、クエリーがそれに基づいてデータを重複排除できるようにします。
apiVersion: v1
kind: ConfigMap
metadata:
  name: prometheus-server-conf
  labels:
    name: prometheus-server-conf
  namespace: monitoring
data:
  prometheus.yaml.tmpl: |-
    global:
      scrape_interval: 5s
      evaluation_interval: 5s
      external_labels:
        cluster: prometheus-ha
        # Each Prometheus has to have unique labels.
        replica: $(POD_NAME)

    rule_files:
      - /etc/prometheus/rules/*rules.yaml

    alerting:

      # We want our alerts to be deduplicated
      # from different replicas.
      alert_relabel_configs:
      - regex: replica
        action: labeldrop

      alertmanagers:
        - scheme: http
          path_prefix: /
          static_configs:
            - targets: ['alertmanager:9093']

    scrape_configs:
    - job_name: kubernetes-nodes-cadvisor
      scrape_interval: 10s
      scrape_timeout: 10s
      scheme: https
      tls_config:
        ca_file: /var/run/secrets/kubernetes.io/serviceaccount/ca.crt
      bearer_token_file: /var/run/secrets/kubernetes.io/serviceaccount/token
      kubernetes_sd_configs:
        - role: node
      relabel_configs:
        - action: labelmap
          regex: __meta_kubernetes_node_label_(.+)
        # Only for Kubernetes ^1.7.3.
        # See: https://github.com/prometheus/prometheus/issues/2916
        - target_label: __address__
          replacement: kubernetes.default.svc:443
        - source_labels: [__meta_kubernetes_node_name]
          regex: (.+)
          target_label: __metrics_path__
          replacement: /api/v1/nodes/${1}/proxy/metrics/cadvisor
      metric_relabel_configs:
        - action: replace
          source_labels: [id]
          regex: '^/machine\.slice/machine-rkt\\x2d([^\\]+)\\.+/([^/]+)\.service$'
          target_label: rkt_container_name
          replacement: '${2}-${1}'
        - action: replace
          source_labels: [id]
          regex: '^/system\.slice/(.+)\.service$'
          target_label: systemd_service_name
          replacement: '${1}'

    - job_name: 'kubernetes-pods'
      kubernetes_sd_configs:
        - role: pod
      relabel_configs:
        - action: labelmap
          regex: __meta_kubernetes_pod_label_(.+)
        - source_labels: [__meta_kubernetes_namespace]
          action: replace
          target_label: kubernetes_namespace
        - source_labels: [__meta_kubernetes_pod_name]
          action: replace
          target_label: kubernetes_pod_name
        - source_labels: [__meta_kubernetes_pod_annotation_prometheus_io_scrape]
          action: keep
          regex: true
        - source_labels: [__meta_kubernetes_pod_annotation_prometheus_io_scheme]
          action: replace
          target_label: __scheme__
          regex: (https?)
        - source_labels: [__meta_kubernetes_pod_annotation_prometheus_io_path]
          action: replace
          target_label: __metrics_path__
          regex: (.+)
        - source_labels: [__address__, __meta_kubernetes_pod_prometheus_io_port]
          action: replace
          target_label: __address__
          regex: ([^:]+)(?::\d+)?;(\d+)
          replacement: $1:$2


    - job_name: 'kubernetes-apiservers'
      kubernetes_sd_configs:
        - role: endpoints
      scheme: https
      tls_config:
        ca_file: /var/run/secrets/kubernetes.io/serviceaccount/ca.crt
      bearer_token_file: /var/run/secrets/kubernetes.io/serviceaccount/token
      relabel_configs:
        - source_labels: [__meta_kubernetes_namespace, __meta_kubernetes_service_name, __meta_kubernetes_endpoint_port_name]
          action: keep
          regex: default;kubernetes;https

    - job_name: 'kubernetes-service-endpoints'
      kubernetes_sd_configs:
        - role: endpoints
      relabel_configs:
        - action: labelmap
          regex: __meta_kubernetes_service_label_(.+)
        - source_labels: [__meta_kubernetes_namespace]
          action: replace
          target_label: kubernetes_namespace
        - source_labels: [__meta_kubernetes_service_name]
          action: replace
          target_label: kubernetes_name
        - source_labels: [__meta_kubernetes_service_annotation_prometheus_io_scrape]
          action: keep
          regex: true
        - source_labels: [__meta_kubernetes_service_annotation_prometheus_io_scheme]
          action: replace
          target_label: __scheme__
          regex: (https?)
        - source_labels: [__meta_kubernetes_service_annotation_prometheus_io_path]
          action: replace
          target_label: __metrics_path__
          regex: (.+)
        - source_labels: [__address__, __meta_kubernetes_service_annotation_prometheus_io_port]
          action: replace
          target_label: __address__
          regex: (.+)(?::\d+);(\d+)
          replacement: $1:$2
Prometheusルールの展開 configmap:
以下は、配信のためにAlertmanagerに中継されるアラートルールを作成します。
apiVersion: v1
kind: ConfigMap
metadata:
  name: prometheus-rules
  labels:
    name: prometheus-rules
  namespace: monitoring
data:
  alert-rules.yaml: |-
    groups:
      - name: Deployment
        rules:
        - alert: Deployment at 0 Replicas
          annotations:
            summary: Deployment {{$labels.deployment}} in {{$labels.namespace}} is currently having no pods running
          expr: |
            sum(kube_deployment_status_replicas{pod_template_hash=""}) by (deployment,namespace)  < 1
          for: 1m
          labels:
            team: devops

        - alert: HPA Scaling Limited
          annotations:
            summary: HPA named {{$labels.hpa}} in {{$labels.namespace}} namespace has reached scaling limited state
          expr: |
            (sum(kube_hpa_status_condition{condition="ScalingLimited",status="true"}) by (hpa,namespace)) == 1
          for: 1m
          labels:
            team: devops

        - alert: HPA at MaxCapacity
          annotations:
            summary: HPA named {{$labels.hpa}} in {{$labels.namespace}} namespace is running at Max Capacity
          expr: |
            ((sum(kube_hpa_spec_max_replicas) by (hpa,namespace)) - (sum(kube_hpa_status_current_replicas) by (hpa,namespace))) == 0
          for: 1m
          labels:
            team: devops

      - name: Pods
        rules:
        - alert: Container restarted
          annotations:
            summary: Container named {{$labels.container}} in {{$labels.pod}} in {{$labels.namespace}} was restarted
          expr: |
            sum(increase(kube_pod_container_status_restarts_total{namespace!="kube-system",pod_template_hash=""}[1m])) by (pod,namespace,container) > 0
          for: 0m
          labels:
            team: dev

        - alert: High Memory Usage of Container
          annotations:
            summary: Container named {{$labels.container}} in {{$labels.pod}} in {{$labels.namespace}} is using more than 75% of Memory Limit
          expr: |
            ((( sum(container_memory_usage_bytes{image!="",container_name!="POD", namespace!="kube-system"}) by (namespace,container_name,pod_name)  / sum(container_spec_memory_limit_bytes{image!="",container_name!="POD",namespace!="kube-system"}) by (namespace,container_name,pod_name) ) * 100 ) < +Inf ) > 75
          for: 5m
          labels:
            team: dev

        - alert: High CPU Usage of Container
          annotations:
            summary: Container named {{$labels.container}} in {{$labels.pod}} in {{$labels.namespace}} is using more than 75% of CPU Limit
          expr: |
            ((sum(irate(container_cpu_usage_seconds_total{image!="",container_name!="POD", namespace!="kube-system"}[30s])) by (namespace,container_name,pod_name) / sum(container_spec_cpu_quota{image!="",container_name!="POD", namespace!="kube-system"} / container_spec_cpu_period{image!="",container_name!="POD", namespace!="kube-system"}) by (namespace,container_name,pod_name) ) * 100)  > 75
          for: 5m
          labels:
            team: dev

      - name: Nodes
        rules:
        - alert: High Node Memory Usage
          annotations:
            summary: Node {{$labels.kubernetes_io_hostname}} has more than 80% memory used. Plan Capcity
          expr: |
            (sum (container_memory_working_set_bytes{id="/",container_name!="POD"}) by (kubernetes_io_hostname) / sum (machine_memory_bytes{}) by (kubernetes_io_hostname) * 100) > 80
          for: 5m
          labels:
            team: devops

        - alert: High Node CPU Usage
          annotations:
            summary: Node {{$labels.kubernetes_io_hostname}} has more than 80% allocatable cpu used. Plan Capacity.
          expr: |
            (sum(rate(container_cpu_usage_seconds_total{id="/", container_name!="POD"}[1m])) by (kubernetes_io_hostname) / sum(machine_cpu_cores) by (kubernetes_io_hostname)  * 100) > 80
          for: 5m
          labels:
            team: devops

        - alert: High Node Disk Usage
          annotations:
            summary: Node {{$labels.kubernetes_io_hostname}} has more than 85% disk used. Plan Capacity.
          expr: |
            (sum(container_fs_usage_bytes{device=~"^/dev/[sv]d[a-z][1-9]$",id="/",container_name!="POD"}) by (kubernetes_io_hostname) / sum(container_fs_limit_bytes{container_name!="POD",device=~"^/dev/[sv]d[a-z][1-9]$",id="/"}) by (kubernetes_io_hostname)) * 100 > 85
          for: 5m
          labels:
            team: devops
Promehteusのステートフルセットのデプロイ
apiVersion: storage.k8s.io/v1beta1
kind: StorageClass
metadata:
  name: fast
  namespace: monitoring
provisioner: kubernetes.io/gce-pd
allowVolumeExpansion: true
---
apiVersion: apps/v1beta1
kind: StatefulSet
metadata:
  name: prometheus
  namespace: monitoring
spec:
  replicas: 3
  serviceName: prometheus-service
  template:
    metadata:
      labels:
        app: prometheus
        thanos-store-api: "true"
    spec:
      serviceAccountName: monitoring
      containers:
        - name: prometheus
          image: prom/prometheus:v2.4.3
          args:
            - "--config.file=/etc/prometheus-shared/prometheus.yaml"
            - "--storage.tsdb.path=/prometheus/"
            - "--web.enable-lifecycle"
            - "--storage.tsdb.no-lockfile"
            - "--storage.tsdb.min-block-duration=2h"
            - "--storage.tsdb.max-block-duration=2h"
          ports:
            - name: prometheus
              containerPort: 9090
          volumeMounts:
            - name: prometheus-storage
              mountPath: /prometheus/
            - name: prometheus-config-shared
              mountPath: /etc/prometheus-shared/
            - name: prometheus-rules
              mountPath: /etc/prometheus/rules
        - name: thanos
          image: quay.io/thanos/thanos:v0.8.0
          args:
            - "sidecar"
            - "--log.level=debug"
            - "--tsdb.path=/prometheus"
            - "--prometheus.url=http://127.0.0.1:9090"
            - "--objstore.config={type: GCS, config: {bucket: prometheus-long-term}}"
            - "--reloader.config-file=/etc/prometheus/prometheus.yaml.tmpl"
            - "--reloader.config-envsubst-file=/etc/prometheus-shared/prometheus.yaml"
            - "--reloader.rule-dir=/etc/prometheus/rules/"
          env:
            - name: POD_NAME
              valueFrom:
                fieldRef:
                  fieldPath: metadata.name
            - name : GOOGLE_APPLICATION_CREDENTIALS
              value: /etc/secret/thanos-gcs-credentials.json
          ports:
            - name: http-sidecar
              containerPort: 10902
            - name: grpc
              containerPort: 10901
          livenessProbe:
              httpGet:
                port: 10902
                path: /-/healthy
          readinessProbe:
            httpGet:
              port: 10902
              path: /-/ready
          volumeMounts:
            - name: prometheus-storage
              mountPath: /prometheus
            - name: prometheus-config-shared
              mountPath: /etc/prometheus-shared/
            - name: prometheus-config
              mountPath: /etc/prometheus
            - name: prometheus-rules
              mountPath: /etc/prometheus/rules
            - name: thanos-gcs-credentials
              mountPath: /etc/secret
              readOnly: false
      securityContext:
        fsGroup: 2000
        runAsNonRoot: true
        runAsUser: 1000
      volumes:
        - name: prometheus-config
          configMap:
            defaultMode: 420
            name: prometheus-server-conf
        - name: prometheus-config-shared
          emptyDir: {}
        - name: prometheus-rules
          configMap:
            name: prometheus-rules
        - name: thanos-gcs-credentials
          secret:
            secretName: thanos-gcs-credentials
  volumeClaimTemplates:
  - metadata:
      name: prometheus-storage
      namespace: monitoring
    spec:
      accessModes: [ "ReadWriteOnce" ]
      storageClassName: fast
      resources:
        requests:
          storage: 20Gi
上記のマニフェストについて、以下のことを理解しておくことが重要です。
Prometheus は、3 つのレプリカを持つステートフルセットとして配備さ、各レプリカは、独自の永続的ボリュームを動的にプロビジョニングします。
Prometheus の設定は、上記で作成したテンプレートファイルを使用して Thanos Sidecar コンテナによって生成されます。
Thanosはデータの圧縮を処理するので、--storage.tsdb.min-block-duration=2hと--storage.tsdb.max-block-duration=2hを設定する必要があります。
Prometheusのステートフルセットには、 thanos-store-apiというラベルが付けられています。"true "とラベル付けされているので、各ポッドはヘッドレスサービスによって発見されます(次にその方法を紹介します)。このヘッドレスサービスは、Thanos Query がすべての Prometheus インスタンスにまたがるデータを問い合わせるために使用されます。
Thanos StoreとThanos Rulerコンポーネントにも同じラベルを適用して、それらがクエリーによって発見され、メトリクスのクエリに使用できるようにします。
GCS バケットのクレデンシャルパスは、GOOGLE_APPLICATION_CREDENTIALS 環境変数を使用して提供されます。設定ファイルは、前提条件の一部として作成されたシークレットからそれにマウントされます。
Prometheusサービスのデプロイ
apiVersion: v1
kind: Service
metadata:
  name: prometheus-0-service
  annotations:
    prometheus.io/scrape: "true"
    prometheus.io/port: "9090"
  namespace: monitoring
  labels:
    name: prometheus
spec:
  selector:
    statefulset.kubernetes.io/pod-name: prometheus-0
  ports:
    - name: prometheus
      port: 8080
      targetPort: prometheus
---
apiVersion: v1
kind: Service
metadata:
  name: prometheus-1-service
  annotations:
    prometheus.io/scrape: "true"
    prometheus.io/port: "9090"
  namespace: monitoring
  labels:
    name: prometheus
spec:
  selector:
    statefulset.kubernetes.io/pod-name: prometheus-1
  ports:
    - name: prometheus
      port: 8080
      targetPort: prometheus
---
apiVersion: v1
kind: Service
metadata:
  name: prometheus-2-service
  annotations:
    prometheus.io/scrape: "true"
    prometheus.io/port: "9090"
  namespace: monitoring
  labels:
    name: prometheus
spec:
  selector:
    statefulset.kubernetes.io/pod-name: prometheus-2
  ports:
    - name: prometheus
      port: 8080
      targetPort: prometheus
---
# This service creates a srv record for querier to find about store-api's
apiVersion: v1
kind: Service
metadata:
  name: thanos-store-gateway
  namespace: monitoring
spec:
  type: ClusterIP
  clusterIP: None
  ports:
    - name: grpc
      port: 10901
      targetPort: grpc
  selector:
    thanos-store-api: "true"
ステートフルセットの中で、Prometheusポッドごとに異なるサービスを作成しています。これらは厳密には必要ではありませんが、デバッグ目的のためだけに作成されます。thanos-store-gatewayのヘッドレスサービスの目的は上記で説明しました。次に、Prometheusのサービスをingressオブジェクトを使って公開します。
Thanos Queryのデプロイ:これはThanosのデプロイの主要なコンポーネントの一つです。以下の点に注意してください。
コンテナ引数 --store=dnssrv+thanos-store-gateway:10901 は、メトリックデータがクエリされるべきすべてのコンポーネントを発見するのに役立ちます。
thanos-querier サービスは、PromQL クエリを実行するための Web インターフェイスを提供し、また、さまざまな Prometheus クラスタ間でデータを重複排除するオプションもあります。
ここから、すべてのダッシュボードのデータソースとしてGrafanaを提供します。
apiVersion: v1
kind: Namespace
metadata:
  name: monitoring
---
apiVersion: apps/v1
kind: Deployment
metadata:
  name: thanos-querier
  namespace: monitoring
  labels:
    app: thanos-querier
spec:
  replicas: 1
  selector:
    matchLabels:
      app: thanos-querier
  template:
    metadata:
      labels:
        app: thanos-querier
    spec:
      containers:
      - name: thanos
        image: quay.io/thanos/thanos:v0.8.0
        args:
        - query
        - --log.level=debug
        - --query.replica-label=replica
        - --store=dnssrv+thanos-store-gateway:10901
        ports:
        - name: http
          containerPort: 10902
        - name: grpc
          containerPort: 10901
        livenessProbe:
          httpGet:
            port: http
            path: /-/healthy
        readinessProbe:
          httpGet:
            port: http
            path: /-/ready
---
apiVersion: v1
kind: Service
metadata:
  labels:
    app: thanos-querier
  name: thanos-querier
  namespace: monitoring
spec:
  ports:
  - port: 9090
    protocol: TCP
    targetPort: http
    name: http
  selector:
    app: thanos-querier
Thanos ストアゲートウェイの導入:
オブジェクトストレージからクエリーにメトリクスを提供するストアコンポーネントが作成されます。
apiVersion: v1
kind: Namespace
metadata:
  name: monitoring
---
apiVersion: apps/v1beta1
kind: StatefulSet
metadata:
  name: thanos-store-gateway
  namespace: monitoring
  labels:
    app: thanos-store-gateway
spec:
  replicas: 1
  selector:
    matchLabels:
      app: thanos-store-gateway
  serviceName: thanos-store-gateway
  template:
    metadata:
      labels:
        app: thanos-store-gateway
        thanos-store-api: "true"
    spec:
      containers:
        - name: thanos
          image: quay.io/thanos/thanos:v0.8.0
          args:
          - "store"
          - "--log.level=debug"
          - "--data-dir=/data"
          - "--objstore.config={type: GCS, config: {bucket: prometheus-long-term}}"
          - "--index-cache-size=500MB"
          - "--chunk-pool-size=500MB"
          env:
            - name : GOOGLE_APPLICATION_CREDENTIALS
              value: /etc/secret/thanos-gcs-credentials.json
          ports:
          - name: http
            containerPort: 10902
          - name: grpc
            containerPort: 10901
          livenessProbe:
            httpGet:
              port: 10902
              path: /-/healthy
          readinessProbe:
            httpGet:
              port: 10902
              path: /-/ready
          volumeMounts:
            - name: thanos-gcs-credentials
              mountPath: /etc/secret
              readOnly: false
      volumes:
        - name: thanos-gcs-credentials
          secret:
            secretName: thanos-gcs-credentials
---
Thanosコンパクトのデプロイ
apiVersion: v1
kind: Namespace
metadata:
  name: monitoring
---
apiVersion: apps/v1beta1
kind: StatefulSet
metadata:
  name: thanos-compactor
  namespace: monitoring
  labels:
    app: thanos-compactor
spec:
  replicas: 1
  selector:
    matchLabels:
      app: thanos-compactor
  serviceName: thanos-compactor
  template:
    metadata:
      labels:
        app: thanos-compactor
    spec:
      containers:
        - name: thanos
          image: quay.io/thanos/thanos:v0.8.0
          args:
            - "compact"
            - "--log.level=debug"
            - "--data-dir=/data"
            - "--objstore.config={type: GCS, config: {bucket: prometheus-long-term}}"
            - "--wait"
          env:
            - name : GOOGLE_APPLICATION_CREDENTIALS
              value: /etc/secret/thanos-gcs-credentials.json
          ports:
            - name: http
              containerPort: 10902
          livenessProbe:
            httpGet:
              port: 10902
              path: /-/healthy
          readinessProbe:
            httpGet:
              port: 10902
              path: /-/ready
          volumeMounts:
            - name: thanos-gcs-credentials
              mountPath: /etc/secret
              readOnly: false
      volumes:
        - name: thanos-gcs-credentials
          secret:
            secretName: thanos-gcs-credentials
Thanos Rulerのデプロイ
apiVersion: v1
kind: Namespace
metadata:
  name: monitoring
---
apiVersion: v1
kind: ConfigMap
metadata:
  name: thanos-ruler-rules
  namespace: monitoring
data:
  alert_down_services.rules.yaml: |
    groups:
    - name: metamonitoring
      rules:
      - alert: PrometheusReplicaDown
        annotations:
          message: Prometheus replica in cluster {{$labels.cluster}} has disappeared from Prometheus target discovery.
        expr: |
          sum(up{cluster="prometheus-ha", instance=~".*:9090", job="kubernetes-service-endpoints"}) by (job,cluster) < 3
        for: 15s
        labels:
          severity: critical
---
apiVersion: apps/v1beta1
kind: StatefulSet
metadata:
  labels:
    app: thanos-ruler
  name: thanos-ruler
  namespace: monitoring
spec:
  replicas: 1
  selector:
    matchLabels:
      app: thanos-ruler
  serviceName: thanos-ruler
  template:
    metadata:
      labels:
        app: thanos-ruler
        thanos-store-api: "true"
    spec:
      containers:
        - name: thanos
          image: quay.io/thanos/thanos:v0.8.0
          args:
            - rule
            - --log.level=debug
            - --data-dir=/data
            - --eval-interval=15s
            - --rule-file=/etc/thanos-ruler/*.rules.yaml
            - --alertmanagers.url=http://alertmanager:9093
            - --query=thanos-querier:9090
            - "--objstore.config={type: GCS, config: {bucket: thanos-ruler}}"
            - --label=ruler_cluster="prometheus-ha"
            - --label=replica="$(POD_NAME)"
          env:
            - name : GOOGLE_APPLICATION_CREDENTIALS
              value: /etc/secret/thanos-gcs-credentials.json
            - name: POD_NAME
              valueFrom:
                fieldRef:
                  fieldPath: metadata.name
          ports:
            - name: http
              containerPort: 10902
            - name: grpc
              containerPort: 10901
          livenessProbe:
            httpGet:
              port: http
              path: /-/healthy
          readinessProbe:
            httpGet:
              port: http
              path: /-/ready
          volumeMounts:
            - mountPath: /etc/thanos-ruler
              name: config
            - name: thanos-gcs-credentials
              mountPath: /etc/secret
              readOnly: false
      volumes:
        - configMap:
            name: thanos-ruler-rules
          name: config
        - name: thanos-gcs-credentials
          secret:
            secretName: thanos-gcs-credentials
---
apiVersion: v1
kind: Service
metadata:
  labels:
    app: thanos-ruler
  name: thanos-ruler
  namespace: monitoring
spec:
  ports:
    - port: 9090
      protocol: TCP
      targetPort: http
      name: http
  selector:
    app: thanos-ruler
ワークロードと同じ名前空間にある対話型シェルに行って、どの pods thanos-store-gateway が解決するかを確認すると、以下のようなものが表示されます。
root@my-shell-95cb5df57-4q6w8:/# nslookup thanos-store-gateway
Server:		10.63.240.10
Address:	10.63.240.10#53

Name:	thanos-store-gateway.monitoring.svc.cluster.local
Address: 10.60.25.2
Name:	thanos-store-gateway.monitoring.svc.cluster.local
Address: 10.60.25.4
Name:	thanos-store-gateway.monitoring.svc.cluster.local
Address: 10.60.30.2
Name:	thanos-store-gateway.monitoring.svc.cluster.local
Address: 10.60.30.8
Name:	thanos-store-gateway.monitoring.svc.cluster.local
Address: 10.60.31.2

root@my-shell-95cb5df57-4q6w8:/# exit
上で返されたIPは、Prometheusのポッド、thatos-storeとthatos-rulerに対応しています。これも以下のようにして検証することができます。
$ kubectl get pods -o wide -l thanos-store-api="true"
NAME                     READY   STATUS    RESTARTS   AGE    IP           NODE                              NOMINATED NODE   READINESS GATES
prometheus-0             2/2     Running   0          100m   10.60.31.2   gke-demo-1-pool-1-649cbe02-jdnv   <none>           <none>
prometheus-1             2/2     Running   0          14h    10.60.30.2   gke-demo-1-pool-1-7533d618-kxkd   <none>           <none>
prometheus-2             2/2     Running   0          31h    10.60.25.2   gke-demo-1-pool-1-4e9889dd-27gc   <none>           <none>
thanos-ruler-0           1/1     Running   0          100m   10.60.30.8   gke-demo-1-pool-1-7533d618-kxkd   <none>           <none>
thanos-store-gateway-0   1/1     Running   0          14h    10.60.25.4   gke-demo-1-pool-1-4e9889dd-27gc   <none>           <none>
Alert Managerのデプロイ
apiVersion: v1
kind: Namespace
metadata:
  name: monitoring
---
kind: ConfigMap
apiVersion: v1
metadata:
  name: alertmanager
  namespace: monitoring
data:
  config.yml: |-
    global:
      resolve_timeout: 5m
      slack_api_url: "<your_slack_hook>"
      victorops_api_url: "<your_victorops_hook>"

    templates:
    - '/etc/alertmanager-templates/*.tmpl'
    route:
      group_by: ['alertname', 'cluster', 'service']
      group_wait: 10s
      group_interval: 1m
      repeat_interval: 5m
      receiver: default
      routes:
      - match:
          team: devops
        receiver: devops
        continue: true
      - match:
          team: dev
        receiver: dev
        continue: true

    receivers:
    - name: 'default'

    - name: 'devops'
      victorops_configs:
      - api_key: '<YOUR_API_KEY>'
        routing_key: 'devops'
        message_type: 'CRITICAL'
        entity_display_name: '{{ .CommonLabels.alertname }}'
        state_message: 'Alert: {{ .CommonLabels.alertname }}. Summary:{{ .CommonAnnotations.summary }}. RawData: {{ .CommonLabels }}'
      slack_configs:
      - channel: '#k8-alerts'
        send_resolved: true


    - name: 'dev'
      victorops_configs:
      - api_key: '<YOUR_API_KEY>'
        routing_key: 'dev'
        message_type: 'CRITICAL'
        entity_display_name: '{{ .CommonLabels.alertname }}'
        state_message: 'Alert: {{ .CommonLabels.alertname }}. Summary:{{ .CommonAnnotations.summary }}. RawData: {{ .CommonLabels }}'
      slack_configs:
      - channel: '#k8-alerts'
        send_resolved: true

---
apiVersion: extensions/v1beta1
kind: Deployment
metadata:
  name: alertmanager
  namespace: monitoring
spec:
  replicas: 1
  selector:
    matchLabels:
      app: alertmanager
  template:
    metadata:
      name: alertmanager
      labels:
        app: alertmanager
    spec:
      containers:
      - name: alertmanager
        image: prom/alertmanager:v0.15.3
        args:
          - '--config.file=/etc/alertmanager/config.yml'
          - '--storage.path=/alertmanager'
        ports:
        - name: alertmanager
          containerPort: 9093
        volumeMounts:
        - name: config-volume
          mountPath: /etc/alertmanager
        - name: alertmanager
          mountPath: /alertmanager
      volumes:
      - name: config-volume
        configMap:
          name: alertmanager
      - name: alertmanager
        emptyDir: {}
---
apiVersion: v1
kind: Service
metadata:
  annotations:
    prometheus.io/scrape: 'true'
    prometheus.io/path: '/metrics'
  labels:
    name: alertmanager
  name: alertmanager
  namespace: monitoring
spec:
  selector:
    app: alertmanager
  ports:
  - name: alertmanager
    protocol: TCP
    port: 9093
    targetPort: 9093
Kubestateメトリクスのデプロイ
Kubestate メトリクスのデプロイは、いくつかの重要なコンテナメトリクスを中継するために必要です。これらのメトリクスは kubelet によってネイティブには公開されておらず、Prometheus で直接利用することはできません。
apiVersion: v1
kind: Namespace
metadata:
  name: monitoring
---
apiVersion: rbac.authorization.k8s.io/v1
# kubernetes versions before 1.8.0 should use rbac.authorization.k8s.io/v1beta1
kind: ClusterRoleBinding
metadata:
  name: kube-state-metrics
roleRef:
  apiGroup: rbac.authorization.k8s.io
  kind: ClusterRole
  name: kube-state-metrics
subjects:
- kind: ServiceAccount
  name: kube-state-metrics
  namespace: monitoring
---
apiVersion: rbac.authorization.k8s.io/v1
# kubernetes versions before 1.8.0 should use rbac.authorization.k8s.io/v1beta1
kind: ClusterRole
metadata:
  name: kube-state-metrics
rules:
- apiGroups: [""]
  resources:
  - configmaps
  - secrets
  - nodes
  - pods
  - services
  - resourcequotas
  - replicationcontrollers
  - limitranges
  - persistentvolumeclaims
  - persistentvolumes
  - namespaces
  - endpoints
  verbs: ["list", "watch"]
- apiGroups: ["extensions"]
  resources:
  - daemonsets
  - deployments
  - replicasets
  verbs: ["list", "watch"]
- apiGroups: ["apps"]
  resources:
  - statefulsets
  verbs: ["list", "watch"]
- apiGroups: ["batch"]
  resources:
  - cronjobs
  - jobs
  verbs: ["list", "watch"]
- apiGroups: ["autoscaling"]
  resources:
  - horizontalpodautoscalers
  verbs: ["list", "watch"]
---
apiVersion: rbac.authorization.k8s.io/v1
# kubernetes versions before 1.8.0 should use rbac.authorization.k8s.io/v1beta1
kind: RoleBinding
metadata:
  name: kube-state-metrics
  namespace: monitoring
roleRef:
  apiGroup: rbac.authorization.k8s.io
  kind: Role
  name: kube-state-metrics-resizer
subjects:
- kind: ServiceAccount
  name: kube-state-metrics
  namespace: monitoring
---
apiVersion: rbac.authorization.k8s.io/v1
# kubernetes versions before 1.8.0 should use rbac.authorization.k8s.io/v1beta1
kind: Role
metadata:
  namespace: monitoring
  name: kube-state-metrics-resizer
rules:
- apiGroups: [""]
  resources:
  - pods
  verbs: ["get"]
- apiGroups: ["extensions"]
  resources:
  - deployments
  resourceNames: ["kube-state-metrics"]
  verbs: ["get", "update"]
---
apiVersion: v1
kind: ServiceAccount
metadata:
  name: kube-state-metrics
  namespace: monitoring
---
apiVersion: apps/v1
kind: Deployment
metadata:
  name: kube-state-metrics
  namespace: monitoring
spec:
  selector:
    matchLabels:
      k8s-app: kube-state-metrics
  replicas: 1
  template:
    metadata:
      labels:
        k8s-app: kube-state-metrics
    spec:
      serviceAccountName: kube-state-metrics
      containers:
      - name: kube-state-metrics
        image: quay.io/mxinden/kube-state-metrics:v1.4.0-gzip.3
        ports:
        - name: http-metrics
          containerPort: 8080
        - name: telemetry
          containerPort: 8081
        readinessProbe:
          httpGet:
            path: /healthz
            port: 8080
          initialDelaySeconds: 5
          timeoutSeconds: 5
      - name: addon-resizer
        image: k8s.gcr.io/addon-resizer:1.8.3
        resources:
          limits:
            cpu: 150m
            memory: 50Mi
          requests:
            cpu: 150m
            memory: 50Mi
        env:
          - name: MY_POD_NAME
            valueFrom:
              fieldRef:
                fieldPath: metadata.name
          - name: MY_POD_NAMESPACE
            valueFrom:
              fieldRef:
                fieldPath: metadata.namespace
        command:
          - /pod_nanny
          - --container=kube-state-metrics
          - --cpu=100m
          - --extra-cpu=1m
          - --memory=100Mi
          - --extra-memory=2Mi
          - --threshold=5
          - --deployment=kube-state-metrics
---
apiVersion: v1
kind: Service
metadata:
  name: kube-state-metrics
  namespace: monitoring
  labels:
    k8s-app: kube-state-metrics
  annotations:
    prometheus.io/scrape: 'true'
spec:
  ports:
  - name: http-metrics
    port: 8080
    targetPort: http-metrics
    protocol: TCP
  - name: telemetry
    port: 8081
    targetPort: telemetry
    protocol: TCP
  selector:
    k8s-app: kube-state-metrics
Node-exporter Daemonsetをデプロイ
Node-exporter Daemonset は、各ノード上で Node-exporter pod を実行します。Prometheus インスタンスが引き出せる非常に重要なノードメトリクスを公開します。
apiVersion: v1
kind: Namespace
metadata:
  name: monitoring
---
apiVersion: extensions/v1beta1
kind: DaemonSet
metadata:
  name: node-exporter
  namespace: monitoring
  labels:
    name: node-exporter
spec:
  template:
    metadata:
      labels:
        name: node-exporter
      annotations:
         prometheus.io/scrape: "true"
         prometheus.io/port: "9100"
    spec:
      hostPID: true
      hostIPC: true
      hostNetwork: true
      containers:
        - name: node-exporter
          image: prom/node-exporter:v0.16.0
          securityContext:
            privileged: true
          args:
            - --path.procfs=/host/proc
            - --path.sysfs=/host/sys
          ports:
            - containerPort: 9100
              protocol: TCP
          resources:
            limits:
              cpu: 100m
              memory: 100Mi
            requests:
              cpu: 10m
              memory: 100Mi
          volumeMounts:
            - name: dev
              mountPath: /host/dev
            - name: proc
              mountPath: /host/proc
            - name: sys
              mountPath: /host/sys
            - name: rootfs
              mountPath: /rootfs
      volumes:
        - name: proc
          hostPath:
            path: /proc
        - name: dev
          hostPath:
            path: /dev
        - name: sys
          hostPath:
            path: /sys
        - name: rootfs
          hostPath:
            path: /
Grafana の配置
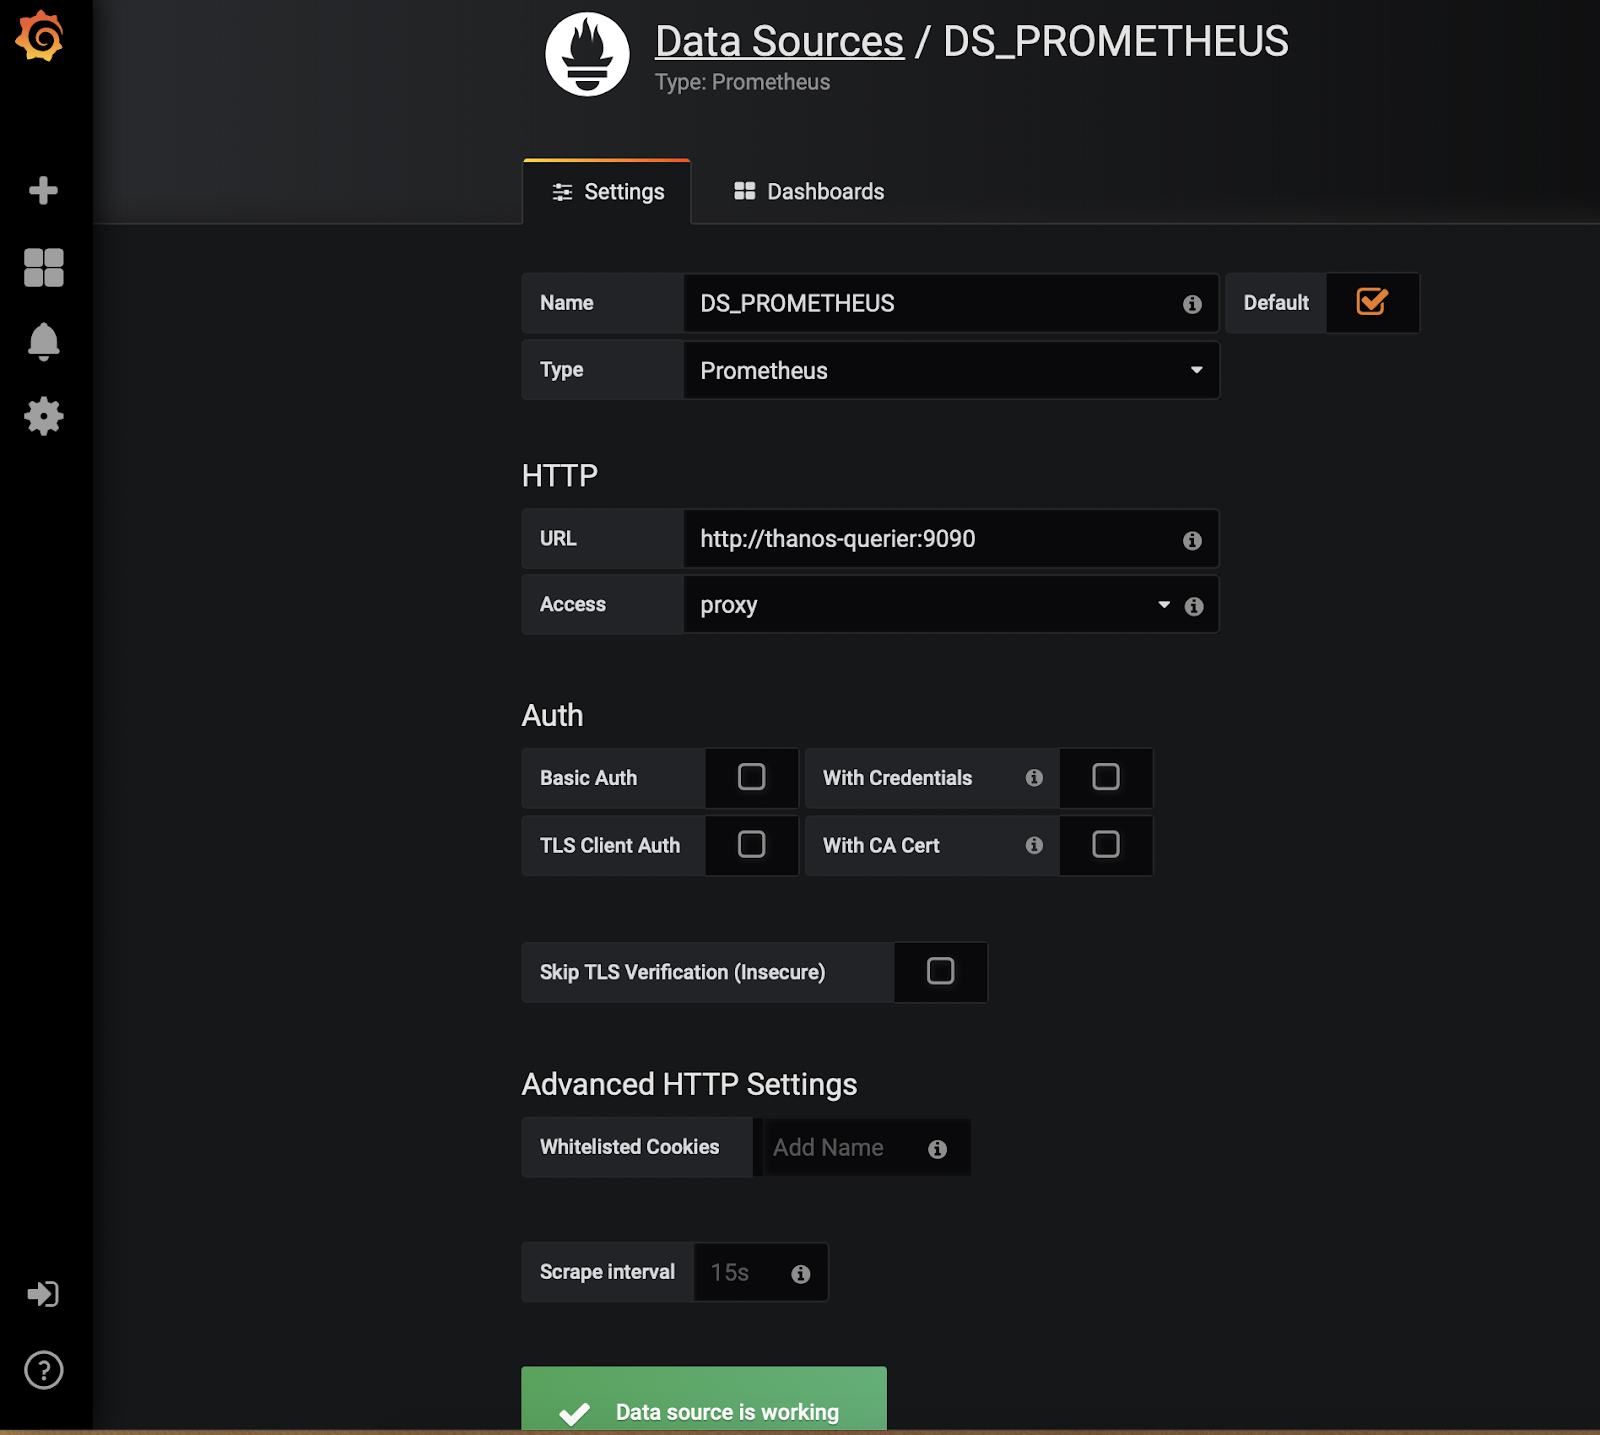
ここでは、Grafana の配置とサービスを作成し、ingress オブジェクトを使用して公開します。Grafana デプロイメントのデータソースとして thanos-querier を追加します。そのためには、以下の手順に従います。
- "Add DataSource"をクリック
- Name: DS_PROMETHEUS
- Set Type: Prometheus
- Set URL: http://thanos-querier:9090
- Save and Test. これで、カスタム・ダッシュボードを構築したり、grafana.netからダッシュボードをインポートしたりすることができます。ダッシュボード#315と#1471は、始めるのに非常に良い場所です。
apiVersion: v1
kind: Namespace
metadata:
  name: monitoring
---
apiVersion: storage.k8s.io/v1beta1
kind: StorageClass
metadata:
  name: fast
  namespace: monitoring
provisioner: kubernetes.io/gce-pd
allowVolumeExpansion: true
---
apiVersion: apps/v1beta1
kind: StatefulSet
metadata:
  name: grafana
  namespace: monitoring
spec:
  replicas: 1
  serviceName: grafana
  template:
    metadata:
      labels:
        task: monitoring
        k8s-app: grafana
    spec:
      containers:
      - name: grafana
        image: k8s.gcr.io/heapster-grafana-amd64:v5.0.4
        ports:
        - containerPort: 3000
          protocol: TCP
        volumeMounts:
        - mountPath: /etc/ssl/certs
          name: ca-certificates
          readOnly: true
        - mountPath: /var
          name: grafana-storage
        env:
        - name: GF_SERVER_HTTP_PORT
          value: "3000"
          # The following env variables are required to make Grafana accessible via
          # the kubernetes api-server proxy. On production clusters, we recommend
          # removing these env variables, setup auth for grafana, and expose the grafana
          # service using a LoadBalancer or a public IP.
        - name: GF_AUTH_BASIC_ENABLED
          value: "false"
        - name: GF_AUTH_ANONYMOUS_ENABLED
          value: "true"
        - name: GF_AUTH_ANONYMOUS_ORG_ROLE
          value: Admin
        - name: GF_SERVER_ROOT_URL
          # If you're only using the API Server proxy, set this value instead:
          # value: /api/v1/namespaces/kube-system/services/monitoring-grafana/proxy
          value: /
      volumes:
      - name: ca-certificates
        hostPath:
          path: /etc/ssl/certs
  volumeClaimTemplates:
  - metadata:
      name: grafana-storage
      namespace: monitoring
    spec:
      accessModes: [ "ReadWriteOnce" ]
      storageClassName: fast
      resources:
        requests:
          storage: 5Gi
---
apiVersion: v1
kind: Service
metadata:
  labels:
    kubernetes.io/cluster-service: 'true'
    kubernetes.io/name: grafana
  name: grafana
  namespace: monitoring
spec:
  ports:
  - port: 3000
    targetPort: 3000
  selector:
    k8s-app: grafana
Ingressオブジェクトの配置
これがパズルの最後のピースです。これは、Kubernetesクラスタの外部にすべてのサービスを公開し、それらにアクセスするのに役立ちます。
を独自のドメイン名に置き換えてください。ingress-controllerのサービスを指し示すことができます。
apiVersion: extensions/v1beta1
kind: Ingress
metadata:
  name: monitoring-ingress
  namespace: monitoring
  annotations:
    kubernetes.io/ingress.class: "nginx"
spec:
  rules:
  - host: grafana.<yourdomain>.com
    http:
      paths:
      - path: /
        backend:
          serviceName: grafana
          servicePort: 3000
  - host: prometheus-0.<yourdomain>.com
    http:
      paths:
      - path: /
        backend:
          serviceName: prometheus-0-service
          servicePort: 8080
  - host: prometheus-1.<yourdomain>.com
    http:
      paths:
      - path: /
        backend:
          serviceName: prometheus-1-service
          servicePort: 8080
  - host: prometheus-2.<yourdomain>.com
    http:
      paths:
      - path: /
        backend:
          serviceName: prometheus-2-service
          servicePort: 8080
  - host: alertmanager.<yourdomain>.com
    http:
      paths:
      - path: /
        backend:
          serviceName: alertmanager
          servicePort: 9093
  - host: thanos-querier.<yourdomain>.com
    http:
      paths:
      - path: /
        backend:
          serviceName: thanos-querier
          servicePort: 9090
  - host: thanos-ruler.<yourdomain>.com
    http:
      paths:
      - path: /
        backend:
          serviceName: thanos-ruler
          servicePort: 9090
これで、http://thanos-querier..com から Thanos Querier にアクセスできるようになり、以下のようになります。
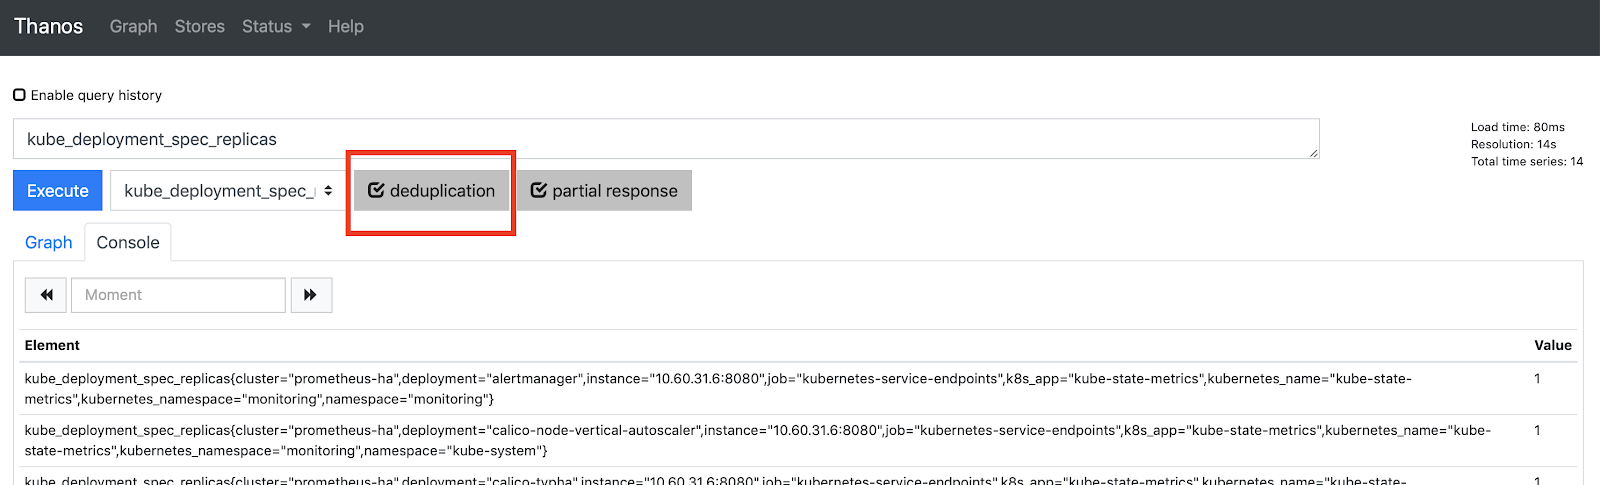
重複排除が選択されていることを確認します。
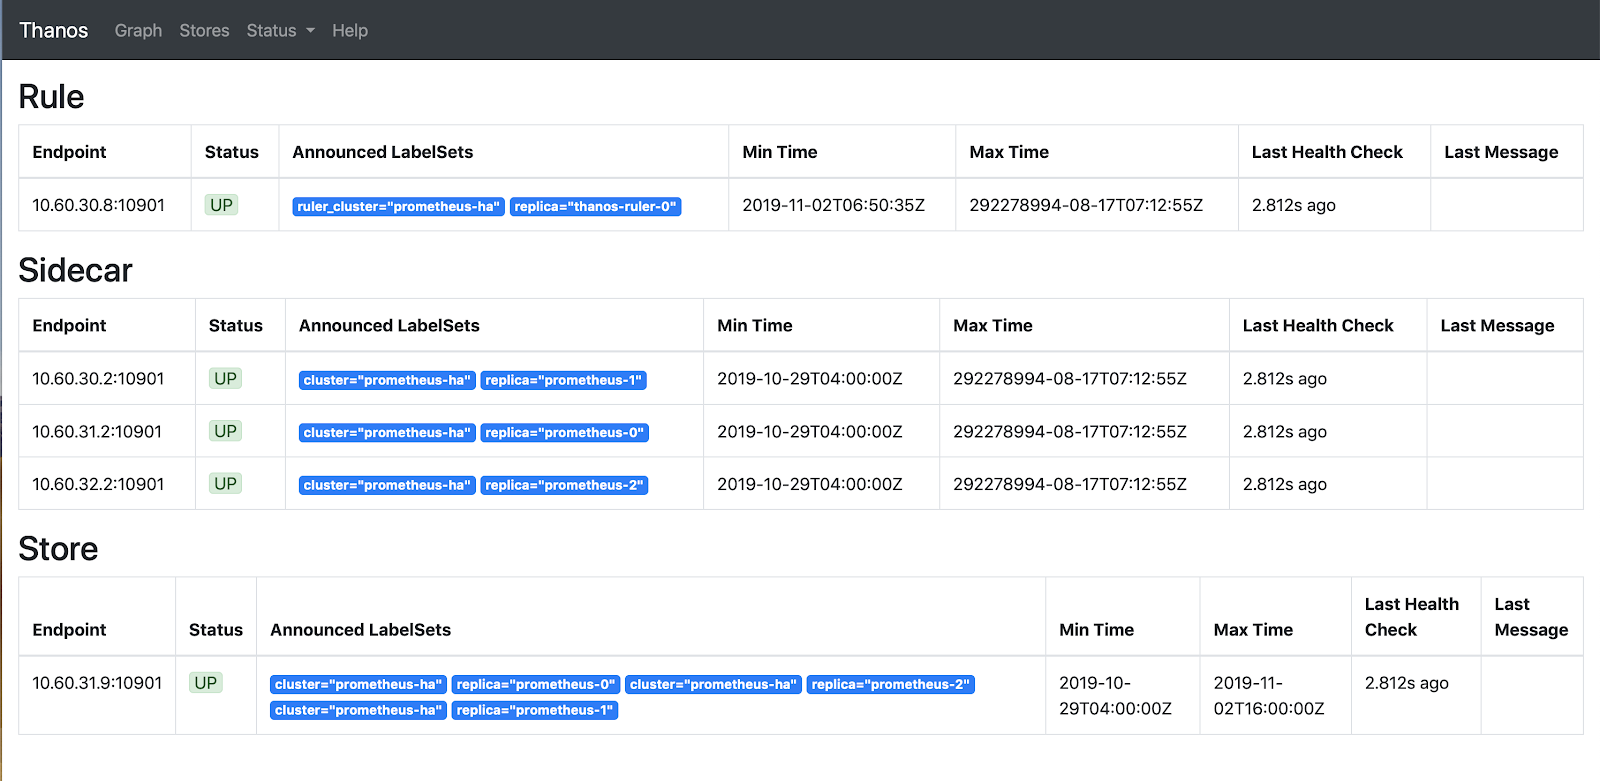
Storesをクリックすると、thatos-store-gatewayで発見されたすべてのアクティブなエンドポイントが表示されます。
Grafanaのダッシュボード
最後に、Thanos QuerierをGrafanaのデータソースとして追加し、ダッシュボードの作成を開始します。
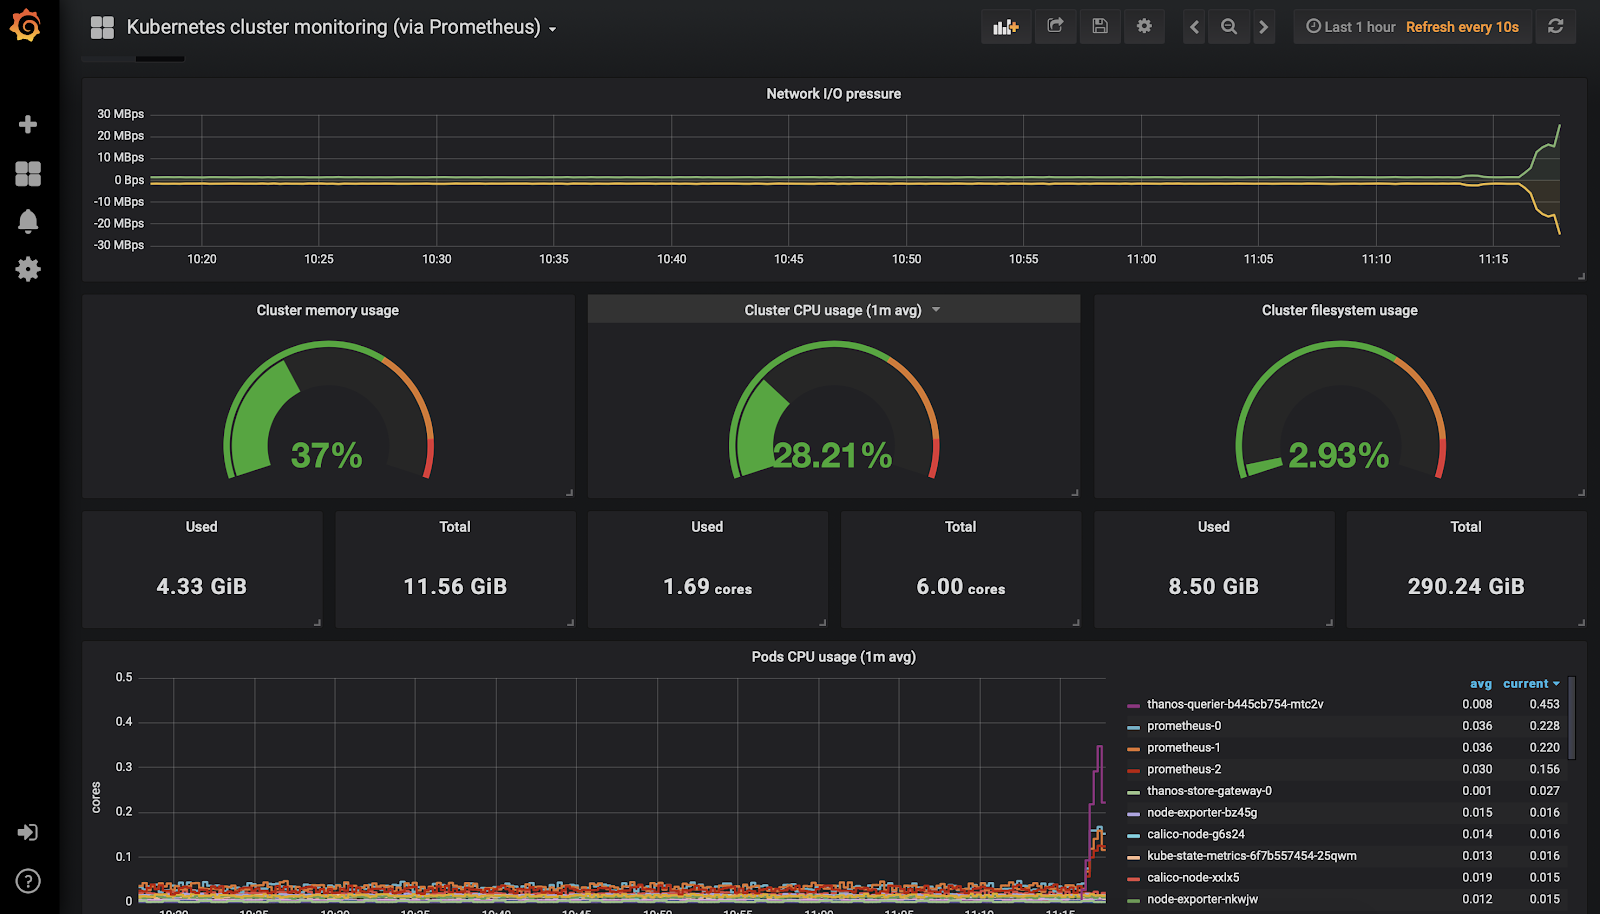
Kubenetesクラスタ監視ダッシュボード
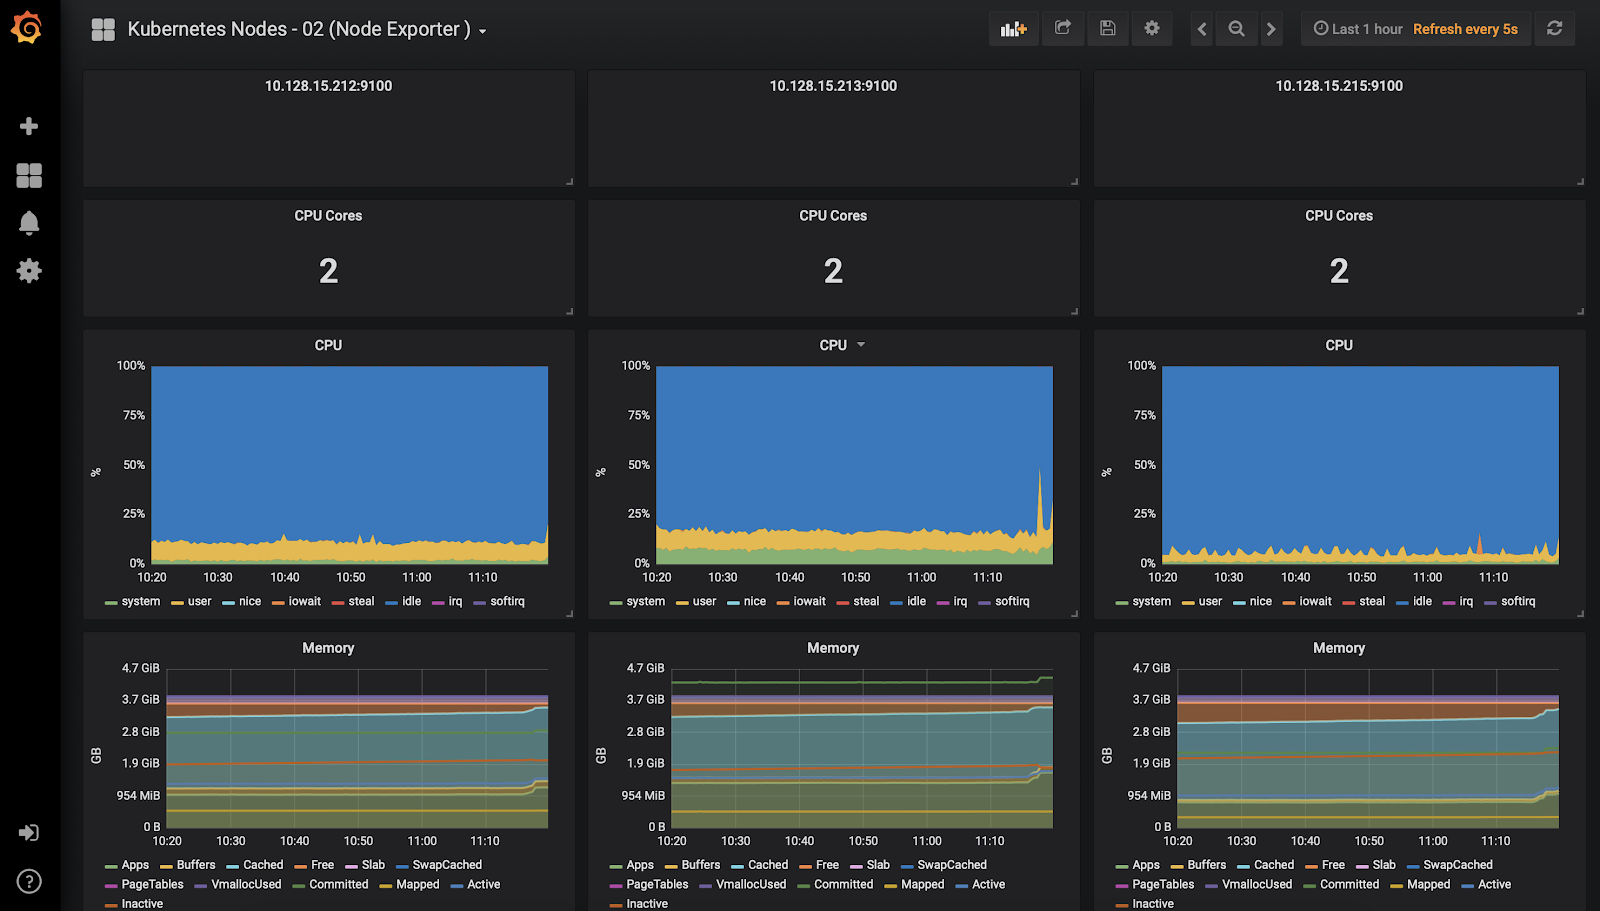
Kubenetesノード監視ダッシュボード
まとめ
ThanosとPrometheusを統合することで、Prometheusを横にスケールすることができます。Thanos Querier は他の Querier インスタンスからメトリクスを引き出すことができるので、クラスタ間でメトリクスを引き出し、Grafana ダッシュボードで可視化することができます。また、Thanosでは、監視システムに無限のストレージを提供するオブジェクトストアにメトリックデータをアーカイブすることができ、オブジェクトストレージ自体からメトリクスを提供します。このセットアップの主な運用コストは、オブジェクトストレージ(S3 または GCS)に起因していて、適切な保持ポリシーを適用することで削減できます。
今日のセットアップでは、かなりの量の設定が必要になります。上記のマニフェストは本番環境でテストされており、プロセスを簡単にすることができるはずです。これらについてご質問がある場合は、お気軽にお問い合わせください。ご自身で設定を行いたくないとお考えの場合は、MetricFireが提供するHosted Prometheusのサービスをご利用ください。無料トライアルをお試しいただくか、デモを予約して直接お問い合わせしていただくことも可能です。
それでは、またの記事で。