では書きます。
ハイパーパラメータとは
学習時に訓練データによって自動的に取得されない値を指します。
例えば正則化であれば
E=E_0+\lambda E_w(w)
の$\lambda$が該当します。
このハイパーパラメータの決め方をハイパーパラメータチューニングといいます。
ハイパーパラメータチューニングの手法
ここではハイパーパラメータチューニングの手法を紹介します。
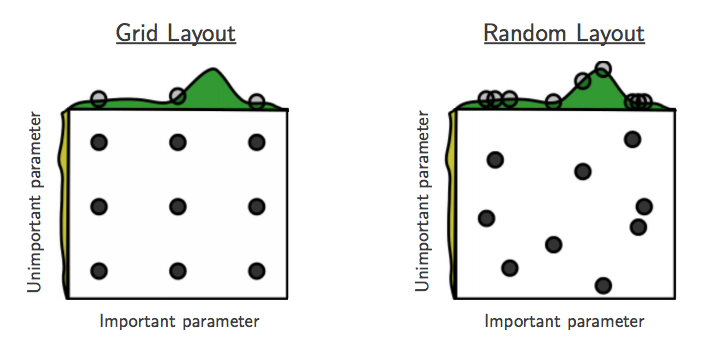
引用:http://olanleed.hatenablog.com/entry/2015/12/23/180457
グリッドサーチ
図の左側に該当する手法。
あらかじめパラメータの探索候補を与え、そのすべての組み合わせでモデルを評価する手法。
例えば
E=E_0+\lambda E_w(w)
なら
\lambda =0.1, 0.01, 0.001, 0.0001
のように探索候補を作り、その数値ごとのモデルを評価し、一番良い値をモデルに用います。
ランダムサーチ
探査候補をある分布に従って与える手法。
パラメータに連続量が含まれる場合、性能をグリッドサーチを超える場合がございます。統計の知識やドメインの知識がある方はこっちを使った方が良いかもしれません。
余談ですがハイパーパラメータチューニングをするライブラリも現在発展途中です。
Hyperoptなどがあります。
グリッドサーチの実装
せっかくなのでグリッドサーチを実装します。
使うのはアヤメデータ、分析手法はSVCです。
ハイパーパラメータチューニングの対象はCとgammaになります。
from sklearn.datasets import load_iris
iris = load_iris()

from sklearn.svm import SVC
from sklearn.model_selection import train_test_split
X_train, X_test,y_train,y_test=train_test_split(
    iris.data, iris.target, random_state=0
)
print("Size of trainig set:{} Size of test set:{}".format(
    X_train.shape[0], X_test.shape[0]
))

# パラメータグリッドの設定
param_grid_svm = {'gamma':[0.001,0.01,0.1,1,10,100],
                       'C':[0.001,0.01,0.1,1,10,100]}

from sklearn.model_selection import GridSearchCV
grid_search=GridSearchCV(SVC(),param_grid_svm, cv=5)

grid_search.fit(X_train, y_train)

print("Best parameters:{}".format(grid_search.best_params_))
print("Best cross-validation score:{}".format(grid_search.best_score_))
print("Best estimator:\n{}".format(grid_search.best_estimator_))
結果
Size of trainig set:112 Size of test set:38
Best parameters:{'C': 10, 'gamma': 0.1}
Best cross-validation score:0.9731225296442687
Best estimator:
SVC(C=10, break_ties=False, cache_size=200, class_weight=None, coef0=0.0,
    decision_function_shape='ovr', degree=3, gamma=0.1, kernel='rbf',
    max_iter=-1, probability=False, random_state=None, shrinking=True,
    tol=0.001, verbose=False)
Cは10,gammaは0.1がよいとわかりました。
せっかくなので可視化してみましょう。
import pandas as pd
import numpy as np
import mglearn

results=pd.DataFrame(grid_search.cv_results_)

scores=np.array(results.mean_test_score).reshape(6,6)
mglearn.tools.heatmap(scores, xlabel='gamma', xticklabels=param_grid_svm['gamma'],
                      ylabel='C',yticklabels=param_grid_svm['C'],cmap='viridis')
結果
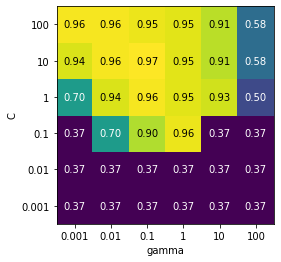
ほかのパラメータに対しても可視化できました。
参考文献
Pythonではじめる機械学習――scikit-learnで学ぶ特徴量エンジニアリングと機械学習の基礎