目次
- はじめに
- ブレークポイントの設定とデバッガの操作方法
- おわりに
1. はじめに
みなさんこんにちは、三井情報株式会社です。
今回は、Script Debuggerの使い方についてご紹介します。
Script Debuggerとはサーバサイドのスクリプトのデバッグを行うための機能です。
※Script Debuggerについての詳細情報は以下のリファレンスサイトをご参照ください。
https://docs.servicenow.com/ja-JP/bundle/vancouver-api-reference/page/script/debugging/concept/script-debugger.html
2. ブレークポイントの設定とデバッガの操作方法
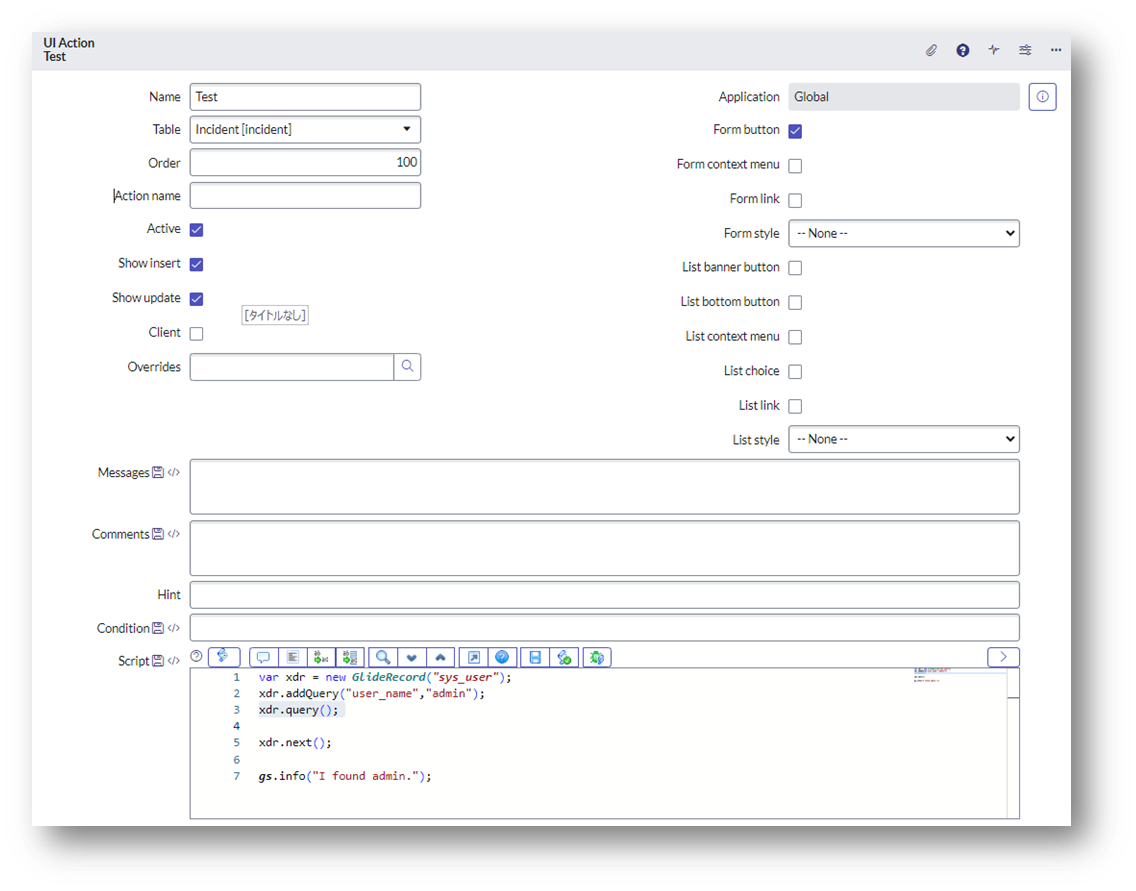
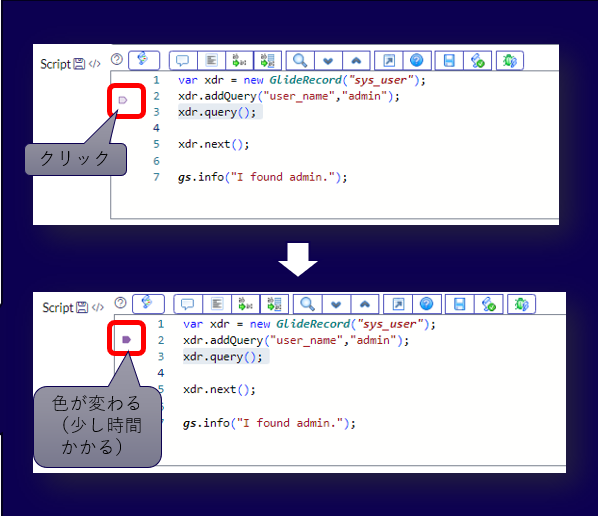
① デバッグしたいサーバサイドスクリプトを開き、ブレークポイントを設定します。
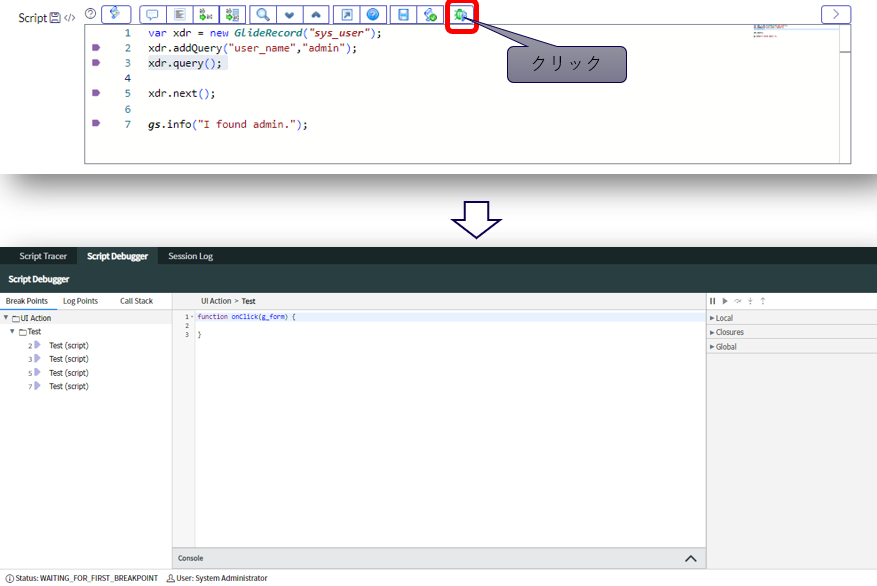
② Script Debuggerを起動します。
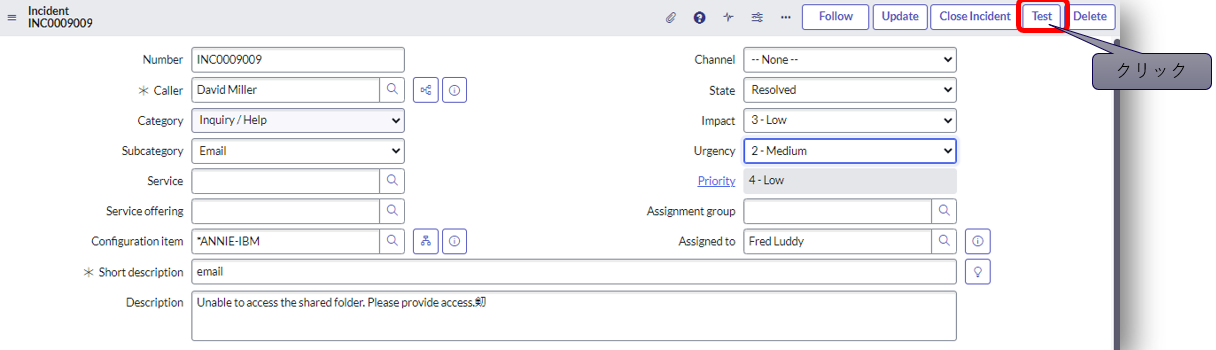
③ スクリプトが実行される操作を行います。
この例ではUIアクションなのでインシデント画面でボタン押下します。
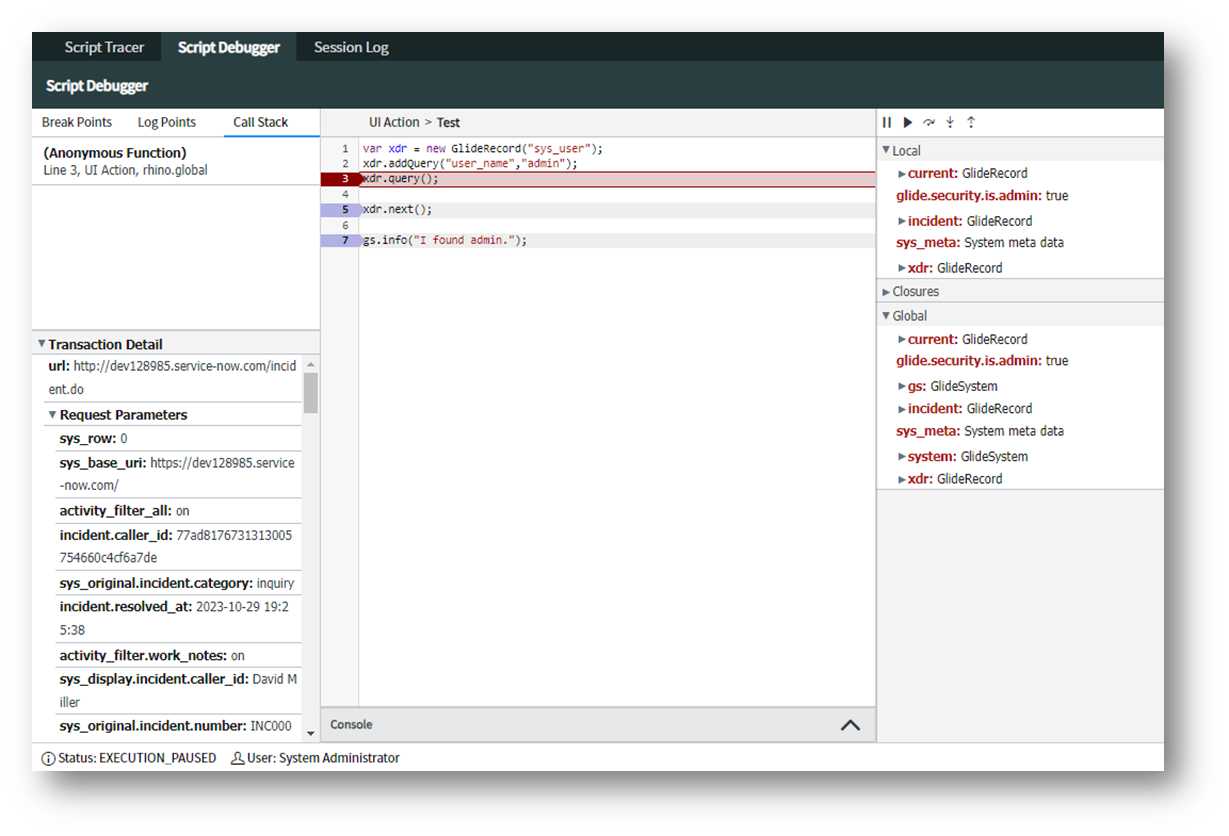
④ Script Debugger上でデバッグが可能になります。
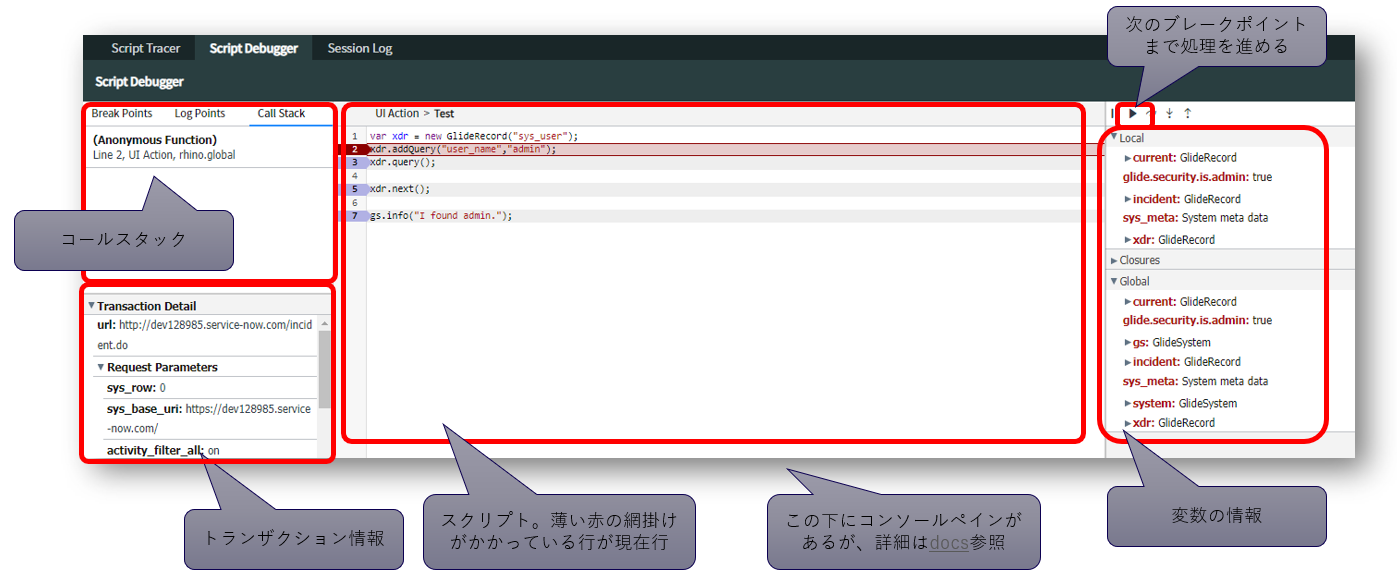
コンソールペインの詳細はこちら
3. おわりに
いかがでしたでしょうか。
Script Debuggerの使い方についてご紹介しました。
便利な機能なのでぜひ使ってみてください。
最後までお読みいただき、ありがとうございました。