課題
plt.bar()で領域は正しく表示されているのに、中身が表示されなくて困った。
import matplotlib.pyplot as plt

A = [10000, 11000, 12000]
B = [2.0, 3.0, 1.0]
plt.bar(A, B)
plt.show()
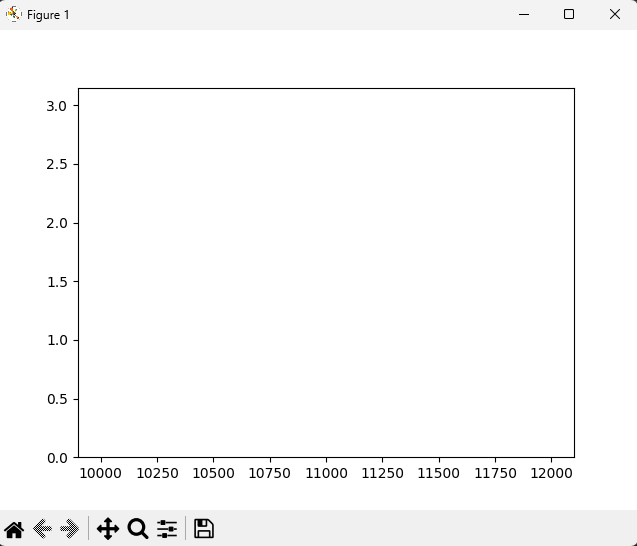
原因
X軸のスケールに対してバーの横幅(width)が小さすぎることが原因。
公式ドキュメント に
width : float or array-like, default: 0.8
と書いてある通り、バーの横幅は(指定しない限り)0.8固定であり、勝手にスケーリングしてくれるわけではない。
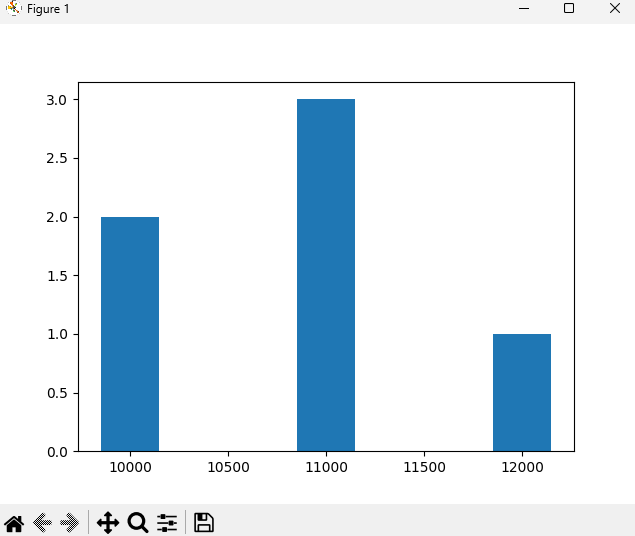
解決策
適当に横幅を指定してやればよい
import matplotlib.pyplot as plt

A = [10000, 11000, 12000]
B = [2.0, 3.0, 1.0]
plt.bar(A, B,width=300)
plt.show()