参考資料
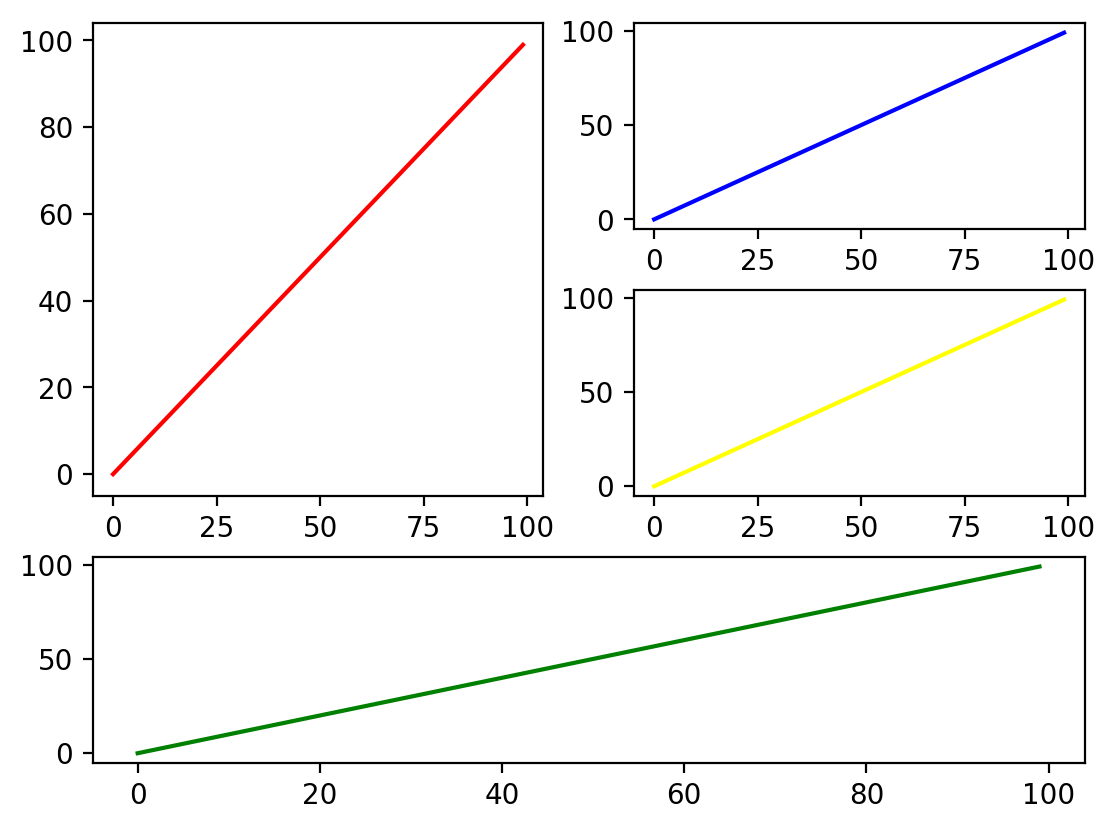
GridSpecを使って大きさの違う図を1つの図に入れる
import numpy as np

import matplotlib as mpl
import matplotlib.pyplot as plt
%matplotlib inline
from matplotlib.gridspec import GridSpec, GridSpecFromSubplotSpec

figure = plt.figure(dpi=200)#figsize=(10,48))
gs_master = GridSpec(nrows=3, ncols=2, height_ratios=[1, 1, 1],
                     width_ratios=[1,1],  hspace=0.3)

gs_1 = GridSpecFromSubplotSpec(nrows=2, ncols=1, subplot_spec=gs_master[:2,  0])
axes_1 = figure.add_subplot(gs_1[:, :])
axes_1.plot(range(100), range(100), color='red')

gs_1 = GridSpecFromSubplotSpec(nrows=1, ncols=1, subplot_spec=gs_master[0, 1])
axes_1 = figure.add_subplot(gs_1[:, :])
axes_1.plot(range(100), range(100), color='blue')

gs_1 = GridSpecFromSubplotSpec(nrows=1, ncols=1, subplot_spec=gs_master[1, 1])
axes_1 = figure.add_subplot(gs_1[:, :])
axes_1.plot(range(100), range(100), color='yellow')

gs_1 = GridSpecFromSubplotSpec(nrows=1, ncols=2, subplot_spec=gs_master[2, :])
axes_1 = figure.add_subplot(gs_1[:, :])
axes_1.plot(range(100), range(100), color='green')
全体のタイトル
plt.suptitle()で付けられます。
一部に色を塗りたい
plt.axvspan(30, 45, color = "coral", zorder=-1, alpha=0.5)
など。
色について
順番に重ねたい
引数にzorderを加えます。これが大きいほど後から上にプロットされます。
垂直・水平線を書く
plt.axvline()
plt.axhline()
色を指定する。

公式サイトより。
color = 'black'
として指定することで使うことが出来ます。
また、以下の主要な色は一文字で指定できます。
| b | 青 (Blue) |
|---|---|
| g | 緑 (Green) |
| r | 赤 (Red) |
| c | シアン (Cyan) |
| m | マゼンタ (Magenta) |
| y | 黄 (Yellow) |
| k | 黒 (Black) |
| w | 白 (White) |
エラーバー付きでプロット
y = data.mean(axis= ? )
y_err = data.std(axis= ? )

plt.fill_between(x, y - y_err, y + y_err, facecolor='lightblue', alpha=0.5,
plt.plot(x, y, color='b')
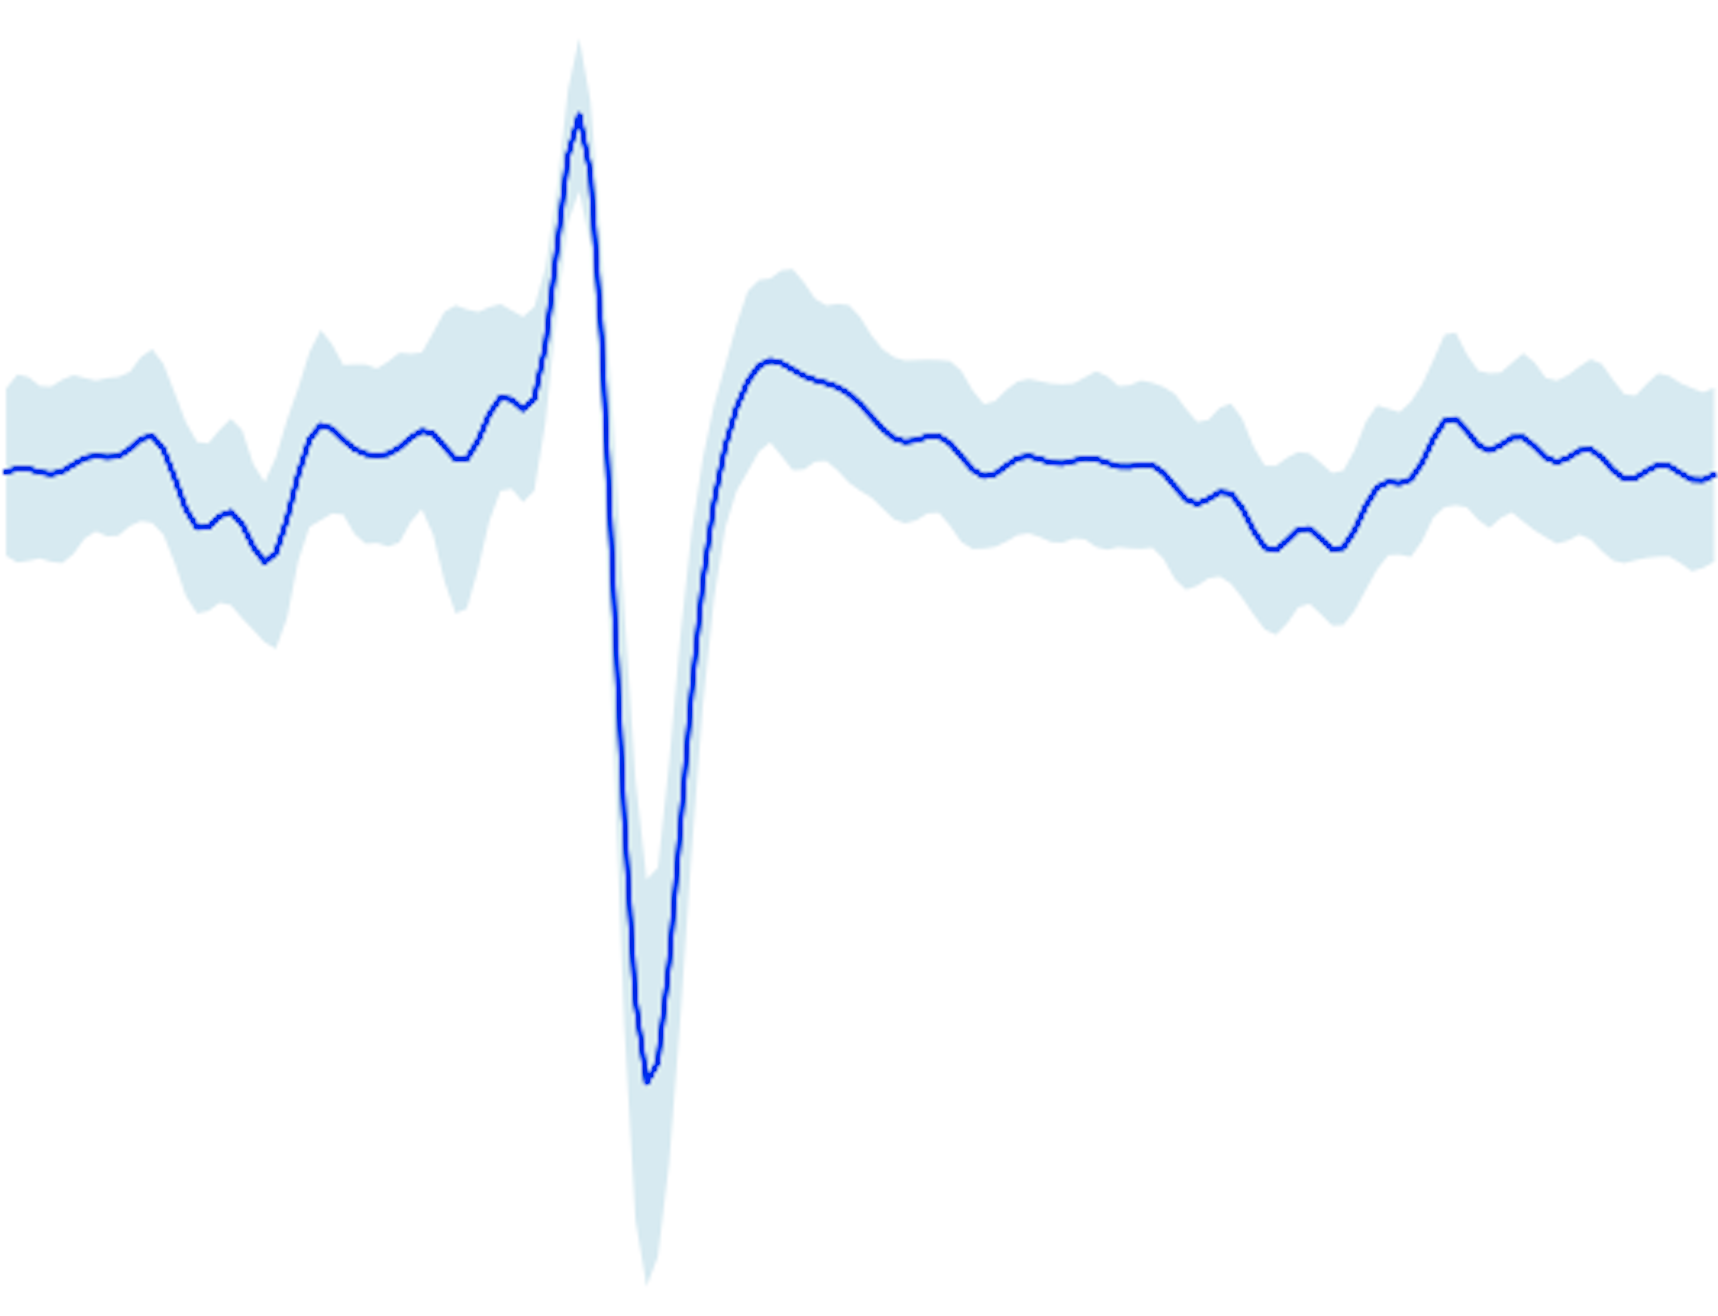
色合いは、
| color | ecolor |
|---|---|
| g | mediumseagreen |
| r | lightcoral |
| b | lightblue |
などの組み合わせが良さそうです。
軸を消す
消したい軸目盛りラベルの位置=Falseで消える。
plt.tick_params(labelbottom=False,
                labelleft=False,
                labelright=False,
                labeltop=False)
消したい軸目盛り線の位置=Falseで消える。
plt.tick_params(bottom=False,
                left=False,
                right=False,
                top=False)