目的
DEG解析で出てきた遺伝子の機能を逐一見て行くとき
違うDBにかけたBlastの結果やら、他の実験での発現量やらを見れたら便利!+ラボ内で手軽に共有できたらいいよね。
→作りました。
とりあえずRで以下を打てば動きます。サンプルファイルもgithubに上げたのでよろぴこ
library(shiny)
runGitHub("maedat/shiny_GeneBank")
これを、ラボの共有mac mini に入れて、他のPCからは
IP+ポート番号でアクセスできるようにする。
サンプル遺伝子IDは
Ljchlorog3v0000020.1
Ljchlorog3v0000040.1
Ljchlorog3v0000060.1
Ljchlorog3v0000080.1
Ljchlorog3v0000110.1
が入っている

「とりあえず動けばいい」という精神でやっていきます。最適化?なにそれ
説明もなんとなく通じればいいやという精神なので、正しい表記がいる人はちゃんとしたページを読んでくれよな。
こことかがおすすめです。
-Shiny100本ノック!初級者から上級者まで使えるテクニックを一挙公開
http://www.randpy.tokyo/archive/category/Shiny100%E6%9C%AC%E3%83%8E%E3%83%83%E3%82%AF
RStudio Shiny チュートリアル レッスン1 ようこそ Shiny へ
https://qiita.com/hoxo_m/items/c8365117f3444fb51df4
-RとShinyで作るWebアプリケーション
https://www.amazon.co.jp/R%E3%81%A8Shiny%E3%81%A7%E4%BD%9C%E3%82%8BWeb%E3%82%A2%E3%83%97%E3%83%AA%E3%82%B1%E3%83%BC%E3%82%B7%E3%83%A7%E3%83%B3-%E6%A2%85%E6%B4%A5-%E9%9B%84%E4%B8%80/dp/4863542577
関数化とかもあんましないで、上から読んでく感じで書きます。
読者はTidyverse系の基本が使えることを前提とします。
R+Shinyの準備
ShinyはRのパッケージーで、WebアプリをRで作れるようにしてくれます。
''install.packages("shiny")''
をR Studioで打ってインストールしましょう
用意するデータ
全部はいらないですが、色々あったほうが楽しいです
1,まとめ用アノテーション情報 (summary.txt)
代表的な結果(refseq tophitやK id)のタブ区切りファイル
2, Blast fmt6の結果データ (swissprot_out_fmt6.txt)
複数データあるとたのしい。
swissprotやDBが整備されている近縁種に対するBlast結果など。
3, Interproscan HTML形式の結果データ
きれいでたのしry、ドメイン構造を見られるようにinterproscanの結果をとってきます。
解凍して、"遺伝子ID".htmlのファイルが沢山ある状態にしてhtmlディレクトリに入れておきましょう。
また解凍してできたresourcesディレクトリはhtmlディレクトリから出して置きましょう。
そして2つ("html", "resources")をwwwディレクトリに入れて置きます。
4, 発現情報データ
FPKMなどお好みに正規化されたデータファイルから、ggplotで図をかいて発現量をグラフィカルに表示できるようにしていきます。
書いていく
0.基本ページ
実際にコードしていきます
1,適当にディレクトリを作ってshiny と名付けます(どんな名前もOK)
2,R studioから「既存ディレクトリからプロジェクト作成」を選んで、作ったshinyディレクトリを選びます
3,新規スクリプト作成ボタンを押して、Shiny Web Appを選びます。

4,Application nameを指定しろと言われるので適当につけます(shiny_testなど)
5,Application type は Multiple Fileにします(お好みですが、本説明はmultiple fileベースです)
6,2つのファイルが自動で作られます。
ui.R:ブラウザ画面に表示するデザインなど記述する
server.R: 表示するデータの処理を記述する
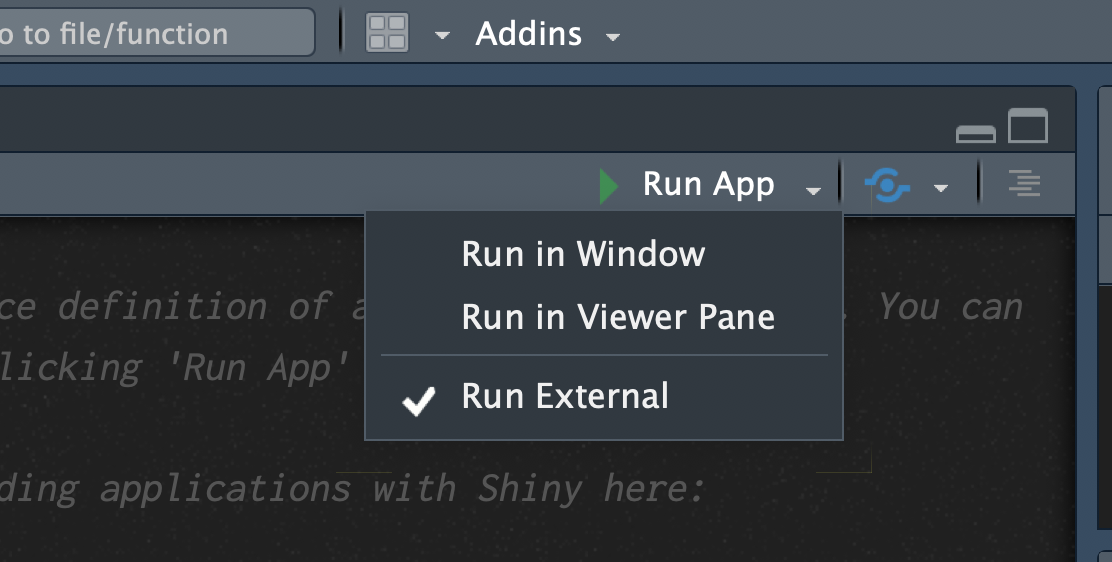
作られたファイルにはデモ用のプログラムが書いてあるので、とりあえず動かしてみる。
右上のRun App から Run externalでブラウザで起動(他の選択肢ではR studio上で動かすこともできる)
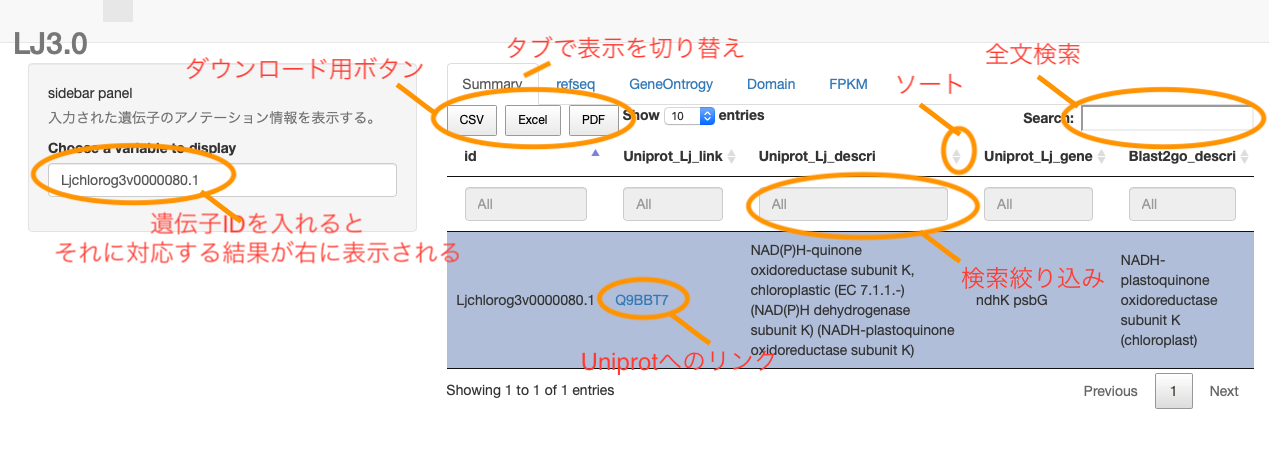
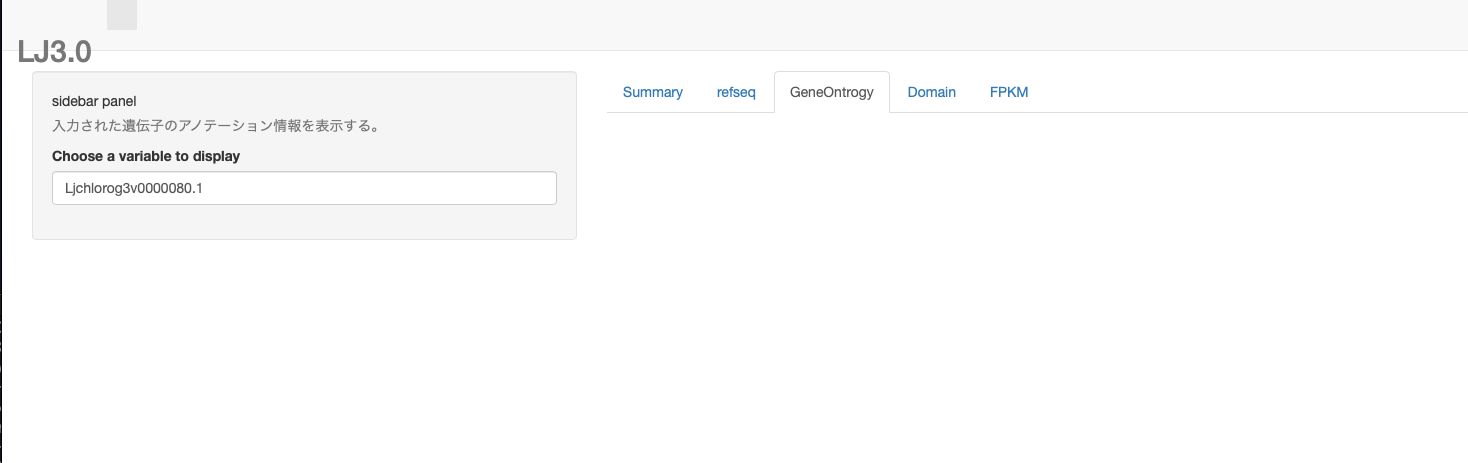
1.画面デザイン
動くのを確認したら、自分用にデザインしていきましょう
ui. RファイルにGUIデザインを書きます
今回は左側(sidebar)に遺伝子ID入力用のボックスをおき、右側(mainpanel)にその結果を出力する形にします。
結果の内容はタブで切り替えられるようにします。
↓こんなかんじ
ではスクリプトです
library(shiny) #shinyを使うためにlibrary shinyをインポートします
library(DT) #表形式の出力をよしなにやるためにDTライブラリも入れます

shinyUI(  #shinyUI関数内にuiの内容を書いていきます。
navbarPage( #トップ項目を宣言します(ここをさらに割ることで、複雑な構造のページを作れます。詳しくはまたこんど

  titlePanel("LJ3.0"), #ぺージタイトルを入れます(画面に表示されるタイトルです)

  sidebarLayout(  #sidebarを使うことを宣言します。ユーザー入力用です
    sidebarPanel( #sidebarPanaelを使うことを宣言し、表示する内容を書きます
      "sidebar panel",  #sidebarのIDを入力します
      helpText("入力された遺伝子のアノテーション情報を表示する。"), #画面に表示される案内用テキストです。
      textInput("id",  #textInbutボックスを使うことを宣言し、idという名前を入れます。server.r側で、入力された内容を参照するためにこの名前が使われます。
                  label = "Choose a variable to display",  #画面に表示される案内用テキストです。
                  value = "Ljchlorog3v0000080.1") #初期値があるときは、このように入れます。
      ),
    mainPanel(    #mainPanelを使うことを宣言します。結果出力用です
      tabsetPanel(type = "tabs", #タブ形式で複数の項目を切り替えできるようにします。表示内容などは結構柔軟に変えられるのでよしなに。
                  tabPanel("Summary", #タブその1の設定です 名前をSummaryとします。この名前はタブの部分に表示されます。
                           includeText("./summary_method.txt"), #説明用のテキストを表示することにします(option) summary_method.txt内に書いた内容がテーブルの上に表示されます
                           DT::dataTableOutput("table1")),  #テーブルの表示の仕方を設定します。DT::dataTableOutputで、出力内容がDTの形式であることを示しています。名前をtable1とします。これがserver.r側で出力先を参照するときに使われます。
                  tabPanel("swissprot", #上と同様にタブその2を設定します。
                           DT::dataTableOutput("table2")),
                  tabPanel("GeneOntrogy",
                           DT::dataTableOutput("table3")),
                  tabPanel("Domain", #タブその4(名前Domain)にはinterproscanのhtml出力をそのまま表示するようにします。
                           htmlOutput("Pfam")),  #htmlOutputを使うことで出力内容がhtmlであることを知らせています
                  tabPanel("FPKM",   #タブその5(名前FPKM)にはFPKM値をggplotを使って図にした内容を表示することにします。
                           plotOutput("FPKMplot"),  #plotOutputを使うことで出力内容がplotであることを知らせています
                          downloadButton(outputId = "down", label = "Download as pdf"))  #図をダウンロードしたいとき用にボタンを作っておきます。
      )
  )
)
))
以上でユーザーインターフェースのデザインができました。
Runしてみると、とりあえずuiの様子が見られるはずです。
2.処理内容
出力する内容をどのように準備するかを
server. Rファイル上に書いていきます。
ui.R上で記述した、以下の情報を抑えておきましよう。
遺伝子入力boxの名前:id
タブその1のテーブルの名前:table1
タブその2のテーブルの名前:table2
タブその3のテーブルの名前:table3
タブその4のhtml出力領域の名前:Pfam
タブその5のggplot出力領域の名前:FPKMplot
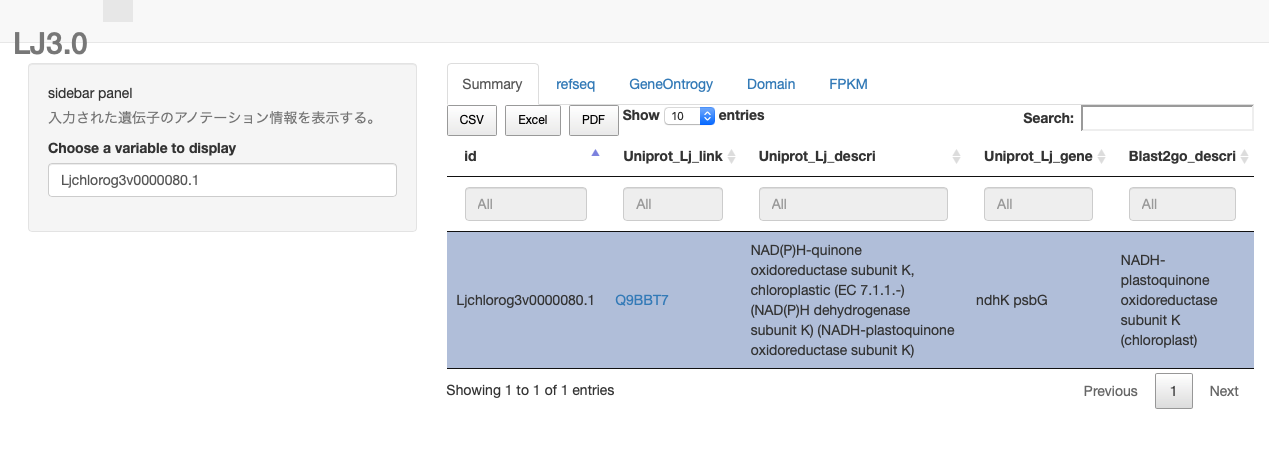
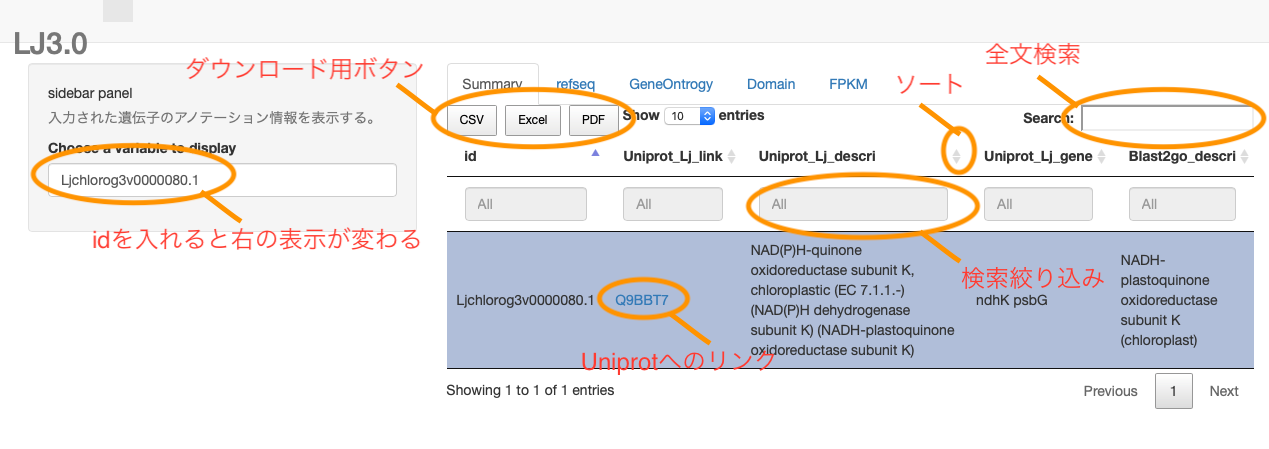
2-1.表データの表示
まず「1,まとめ用アノテーション情報 (summary.txt)」だけを表示する場合を考えます。
library(shiny)
library(DT)
library(tidyverse)
library(stringr)
library(ggbeeswarm)

## タブその1に表示するデータの読み込みをします。
df1_sum <- read_tsv("./summary.txt") #データを読み込みます ./はserver.Rファイルがあるディレクトリです

## タブその1に表示する予定のsummary項目の整形
##  予め整形したファイルを用意してよみこむのでも良いですが、柔軟に項目を変えられるように今回はShiny内に書きました。その分ちょっと起動が遅くなってるかもだけど、まあきにすんな。
df1_sum_mod <-
  df1_sum %>%
  mutate(Uniprot_Lj_link=str_c("<a href='https://www.uniprot.org/uniprot/",
                               Uniprot_Lj_hit,
                               "'",
                               "target = '_blank'",
                               ">",
                               Uniprot_Lj_hit,
                               "</a>")  #uniprotにリンクで飛べるようにしておきます。
  )%>%
  select(id,Uniprot_Lj_link, Uniprot_Lj_descri, Uniprot_Lj_gene, Blast2go_descri) #出力する項目順に整形しておきます。

shinyServer( #実際に入力boxになにか記述されたときの処理の内容を書きます
  function(input, output)
  {
    output$table1 <- #出力するターゲットはoutput$(名前)で指定します。今回はTable1が出力ターゲットです
      DT::renderDataTable( #table1で受け取るために形式を整えます。扱うデータの形式によって関数が異なります。今回はデータフレームなのでDT::renderDataTableを使います。
        {df1_sum_mod %>% filter(id == input$id)}, #出力するデータを{}で挟んで記述します。今回は同時にinput$idの項目を使って絞り込み(id項目が入力された遺伝子IDと同じ行だけを出力)をしています。input$(名前)で、入力された内容にアクセスできます。
        rownames = FALSE,
        extensions = c('Buttons'),
        escape = FALSE, #これでhtmlタグが項目に入っていたとき(今回は<a href=>)htmlとして解釈されてから表示されます。無いとそのまま文字列として表示されてしまいます。
        options = list(dom = 'Blfrtip',
                       buttons = c('csv', 'excel', 'pdf')
                       )
        )
})
以上の内容でRunしてみると以下のようになります。
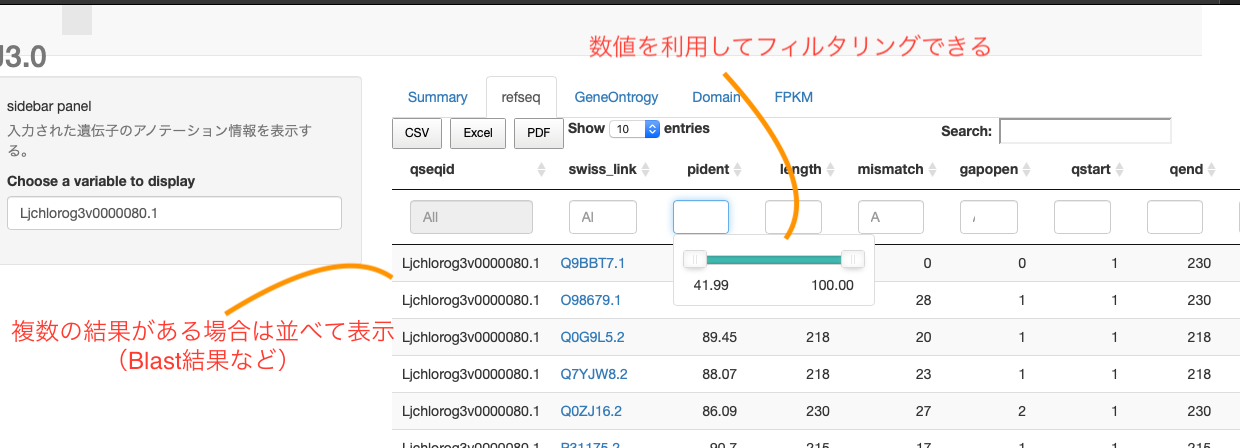
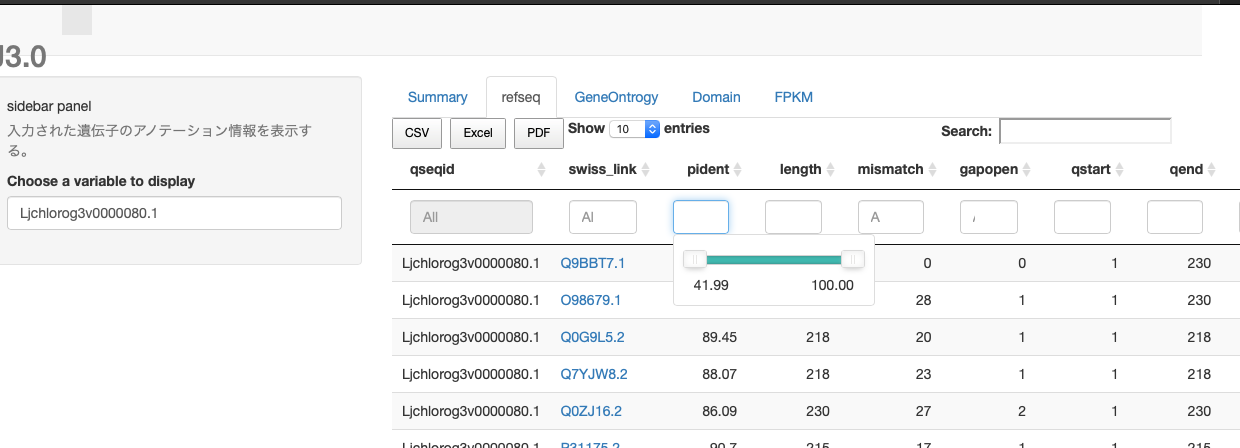
2-2.blast fmt6 データの埋め込み
今度は「Blast fmt6の結果データ (swissprot_out_fmt6.txt)」も表示する場合を考えます。
前回のデータは1遺伝子1行のデータですが、今回は1遺伝子複数行です。
なので、E-value でのフィルタリング(特定の値以上だけ表示する)などもできるようにします。数値データはスライダーで指定できたりもしますが、細かくやりたければ左のサイドウインドウに新しくスライダーコントローラーをつけたほうが良いでしょう(やり方は今度)
library(shiny)
library(DT)
library(tidyverse)
library(stringr)
library(ggbeeswarm)


df1_sum <- read_tsv("./summary.txt")
df2_swissprot <- read_tsv("./swissprot_out_fmt6.txt")

df1_sum_mod <-
  df1_sum %>%
  mutate(Uniprot_Lj_link=str_c("<a href='https://www.uniprot.org/uniprot/",
                               Uniprot_Lj_hit,
                               "'",
                               "target = '_blank'",
                               ">",
                               Uniprot_Lj_hit,
                               "</a>")
  )%>%
  select(id,Uniprot_Lj_link, Uniprot_Lj_descri, Uniprot_Lj_gene, Blast2go_descri)

## タブその2に表示する予定のswissprot blast hit項目の整形
df2_swissprot_mod<-
  df2_swissprot %>%
  mutate(swiss_link=str_c("<a href='https://www.uniprot.org/uniprot/",
                          sseqid,
                          "'",
                          "target = '_blank'",
                          ">",
                          sseqid,
                          "</a>")  #uniprotにリンクで飛べるようにしておきます。
  )%>%
  select(qseqid, swiss_link, pident,length,mismatch,gapopen,qstart,qend,sstart,send,evalue,bitscore) #出力する項目順に整形しておきます。


shinyServer( #入力がなされたときの処理の内容を書きます
  function(input, output)
  {
    output$table1<-
    DT::renderDataTable(
      {df1_sum_mod %>% filter(id == input$id)},
      rownames = FALSE,
      extensions = c('Buttons'),
      escape = FALSE,
      options = list(dom = 'Blfrtip',
                     buttons = c('csv', 'excel', 'pdf')
      )
    )


    output$table2 <- #table1のときと同じです。ただ今回は複数行がヒットする点がちがいます。
      DT::renderDataTable({df2_swissprot_mod %>% filter(qseqid == input$id)},
                          filter='top',
                          rownames = FALSE,
                          escape = FALSE,
                          extensions = c('Buttons'),
                          options = list(dom = 'Blfrtip',
                                         buttons = c('csv', 'excel', 'pdf')
                          )
      )
  }
)
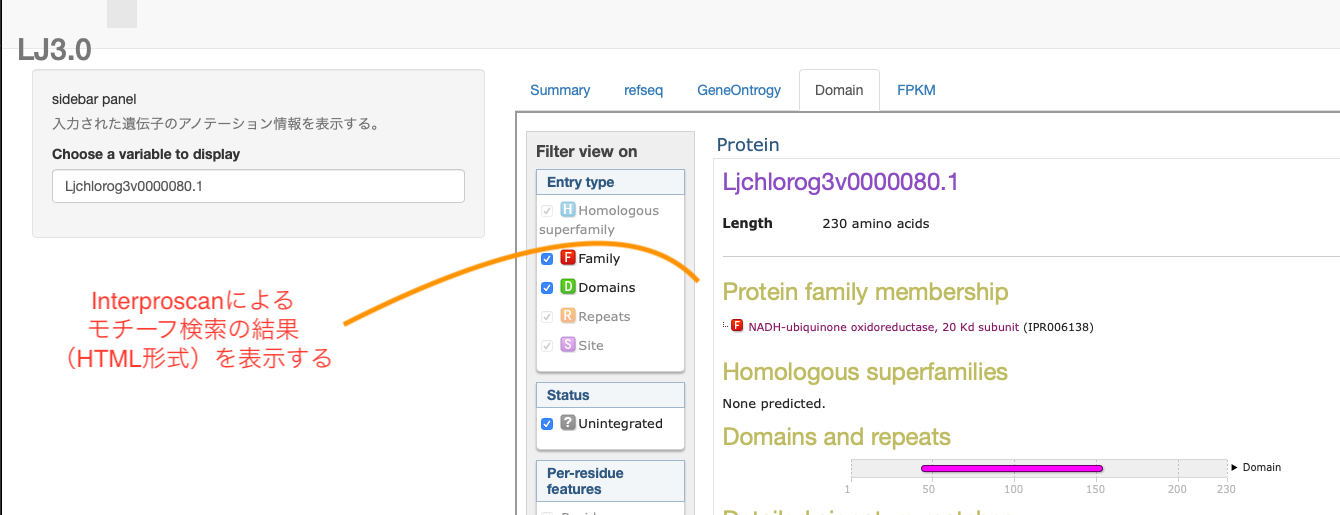
2-3.htmlファイルの埋め込み
今度は「3, Interproscan HTML形式の結果データ」を表示する場合を考えます。
これは、遺伝子ID名ごとのhtmlファイルになっているはずなので、ファイル名と入力された遺伝子IDが一致したらそのファイルを表示するということにします。

<shinyServer外は省略します>

shinyServer(
  function(input, output)
  {
    output$Pfam <-renderUI ({  #HTMLのデータはrenderUIで処理してPfamに渡します
                            my_file<-str_c("html/",
                                           input$id,
                                           ".html") %HTMLへのパスをinput$idと合わせて指定します


                            tags$iframe(  #tagsを使うことで、ファイルの内容を特定のHTMLタグに挟んで渡すことができます。今回はiframeで挟んでわたします。出力するファイルはsrc=で指定します。
                            seamless="seamless",
                            width="900", #iframeのサイズを指定します。このくらいでいい感じと思います。
                            height="1200",
                            src=my_file)
      })
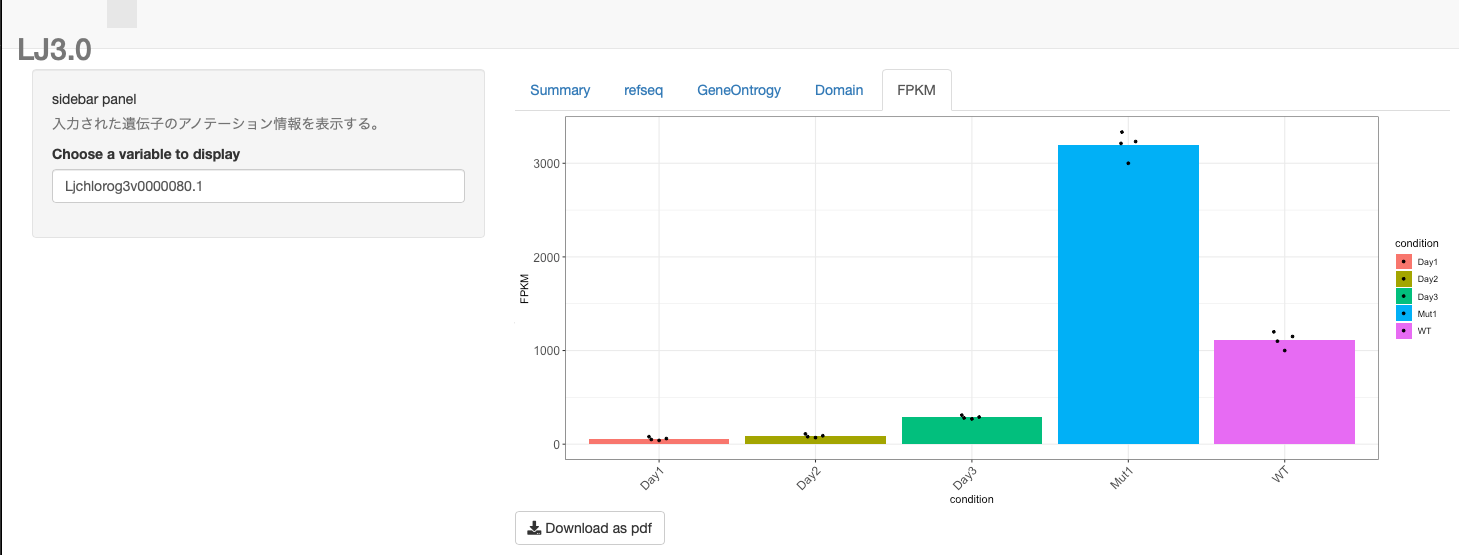
2-4.ggplotの埋め込み
「4, 発現情報データ」を表示します。
ggplot形式での出力をそのまま表示して、さらにボタンでその図をダウンロードできるようにします。
library(shiny)
library(DT)
library(tidyverse)
library(stringr)
library(ggbeeswarm)


df1_sum <- read_tsv("./summary.txt")
df2_swissprot <- read_tsv("./swissprot_out_fmt6.txt")

df1_sum_mod <-
  df1_sum %>%
  mutate(Uniprot_Lj_link=str_c("<a href='https://www.uniprot.org/uniprot/",
                               Uniprot_Lj_hit,
                               "'",
                               "target = '_blank'",
                               ">",
                               Uniprot_Lj_hit,
                               "</a>")
  )%>%
  select(id,Uniprot_Lj_link, Uniprot_Lj_descri, Uniprot_Lj_gene, Blast2go_descri)

## タブその2に表示する予定のswissprot blast hit項目の整形
df2_swissprot_mod<-
  df2_swissprot %>%
  mutate(swiss_link=str_c("<a href='https://www.uniprot.org/uniprot/",
                          sseqid,
                          "'",
                          "target = '_blank'",
                          ">",
                          sseqid,
                          "</a>")  #uniprotにリンクで飛べるようにしておきます。
  )%>%
  select(qseqid, swiss_link, pident,length,mismatch,gapopen,qstart,qend,sstart,send,evalue,bitscore) #出力する項目順に整形しておきます。

FPKM_data <- read_tsv("./fpkm.txt")  %>%
  tidyr::gather(key = sample, value = FPKM, -id)%>%
  mutate(condition = str_replace(sample, "_1|_2|_3|_4", ""))


shinyServer( #入力がなされたときの処理の内容を書きます
  function(input, output)
  {
    output$table1<-
    DT::renderDataTable(
      {df1_sum_mod %>% filter(id == input$id)},
      rownames = FALSE,
      extensions = c('Buttons'),
      escape = FALSE,
      options = list(dom = 'Blfrtip',
                     buttons = c('csv', 'excel', 'pdf')
      )
    )


    output$table2 <- #table1のときと同じです。ただ今回は複数行がヒットする点がちがいます。
      DT::renderDataTable({df2_swissprot_mod %>% filter(qseqid == input$id)},
                          filter='top',
                          rownames = FALSE,
                          escape = FALSE,
                          extensions = c('Buttons'),
                          options = list(dom = 'Blfrtip',
                                         buttons = c('csv', 'excel', 'pdf')
                          )
      )

        output$Pfam <-renderUI ({  #HTMLのデータはrenderUIで処理してPfamに渡します
                            my_file<-str_c("html/",
                                           input$id,
                                           ".html") #HTMLへのパスをinput$idと合わせて指定します


                            tags$iframe(  #tagsを使うことで、ファイルの内容を特定のHTMLタグに挟んで渡すことができます。今回はiframeで挟んでわたします。出力するファイルはsrc=で指定します。
                              seamless="seamless",
                              width="900", #iframeのサイズを指定します。このくらいでいい感じと思います。
                              height="1200",
                              src=my_file)
                            })

        output$FPKMplot <-renderPlot({
        ggplot(FPKM_data %>%
                 filter(id == input$id),
               aes(x = condition, y = FPKM,  fill=condition))+
          stat_summary(fun.y = "mean", geom = "bar")+
          geom_quasirandom(width=0.1,cex = 1)+
          theme_bw()+
          theme(
            axis.text.x = element_text(angle = 45, hjust = 1),
            axis.text=element_text(size=12)
          )
        })

        output$down <- downloadHandler(
          filename =  "output.pdf",
          content = function(file) {
            ggsave(file,
                   ggplot(FPKM_data %>%
                            filter(id == input$id),
                          aes(x = condition, y = FPKM,  fill=condition))+
                     stat_summary(fun.y = "mean", geom = "bar")+
                     geom_quasirandom(width=0.1,cex = 1)+
                     theme_bw()+
                     theme(
                       axis.text.x = element_text(angle = 45, hjust = 1),
                       axis.text=element_text(size=12)
                     ))
          })
  })
3 別PCからもアクセスできるようにする
自分だけで使う場合は以上で十分ですが、データの共有などをする場合は以下の記述をlibrary()の下などに書いておき、IPを自分のパソコンのIPにしてポートを指定しておく。
options(shiny.port = 7775) options(shiny.host = "0.0.0.0")