iOS専門で色々やってたはずが、万屋になってきた私です。
おはこんばんちわ。
前回、Vue.jsを使いつつOpenStreetMapを表示することをやってみました。
今回は前回記事のコードを元にクリックしたポイントにマーカーを表示してみます。
Mapを表示する
今回使うコンポーネントは前回と同じく2つです。元のコンポーネントをそのまま記載します。
詳しい内容については、前回記事を参照してください。
前回はMapをクリックするとクリップしたポイントの緯度経度情報をconsole.logとして吐き出すということまで行っています。
<template>
    <div id='BaseView'>
        <MapView v-on:panretMessage="messageLog" ref="map"/>
    </div>
</template>
<script>
import MapView from './MapView.vue'


export default {
    name: 'mapview',
    data: function () {
        return {
            selectLonLat: null
        }
    },
    components: {
        MapView,
    },
    methods: {
        messageLog() {
            console.log("parent");
            console.log(this.selectLonLat)
        }
    },
    mounted() {
        this.$refs.map.initialize()
    }
}
</script>

<style scoped>

# BaseView {
    width: 100vw;
    height: 100vh;
}
</style>
<template>
    <div id='OSMCanvas'>
    </div>
</template>
<script>
import 'ol/ol.css'
import {toLonLat , transform} from 'ol/proj'
import Map from 'ol/Map'
import View from 'ol/View'
import TitleLayer from 'ol/layer/Tile'
import OSM from 'ol/source/OSM'

export default {
    name: 'mapview',
    components: {},
    data: function () {
        return {
            mapview: null
        }
    },
    methods: {
        initialize () {
            this.createMap()
            this.mapview.on("click", ev => {
                var lonlat = transform(ev.coordinate, 'EPSG:3857', 'EPSG:4326')
                this.$parent.selectLonLat = lonlat
                this.$emit('panretMessage')
            })
        },
        createMap () {
            this.mapview = new Map ({
                target: 'OSMCanvas',
                layers: [
                    new TitleLayer({
                        source: new OSM()
                    })
                ],
                view: new View({
                    center:[0,0],
                    zoom:0
                })
            })
        }
    }
}
</script>

<style scoped>
# OSMCanvas {
    width: 100%;
    height: 100%;
}
</style>
クリック位置にマーカーを表示する
今回はMapView.vueのコードを一部改良して、Map上にマーカーを描画します。
前回までのコード
methods: {
    initialize () {
        this.createMap()
        this.mapview.on("click", ev => {
            var lonlat = transform(ev.coordinate, 'EPSG:3857', 'EPSG:4326')
            this.$parent.selectLonLat = lonlat
            this.$emit('panretMessage')
        })
    },
}
元のコードでは、クリック時イベントとして渡ってくるX,Y座標をメートルで表したEPSG:3857形式を緯度経度形式のEPSG:4326に変換し、親コンポーネントに用意したselectLonLatという名称の変数に対して緯度経度座標を渡しています。その後、親コンポーネントのメソッドであるpanretMessageで、先ほど渡した緯度経度をconsole.logで表示していました。
このクリックイベント発火時、Map上にマーカーを表示するようにするメソッドを追加で書きます。
マーカー描画するコード
import 'ol/ol.css'
import {toLonLat , transform} from 'ol/proj'
import Map from 'ol/Map'
import View from 'ol/View'
import TitleLayer from 'ol/layer/Tile'
import OSM from 'ol/source/OSM'

//今回新たに追加で読み込み
import Point from 'ol/geom/Point'
import Feature from 'ol/Feature'
import VectorSource from 'ol/source/Vector'
import VectorLayer from 'ol/layer/Vector'

export default {
    name: 'mapview',
    components: {},
    data: function () {
        return {
            mapview: null,
            markers: null,
            vectorLayer: null //追加
        }
    },
    methods: {
        initialize () {
            this.createMap()
            this.mapview.on("click", ev => {
                var lonlat = transform(ev.coordinate, 'EPSG:3857', 'EPSG:4326')
                this.$parent.selectLonLat = lonlat
                this.$emit('panretMessage')
                this.addFeatureByCoord(ev.coordinate)
            })
        },
        //新しく追加
        //緯度経度を元にマーカーを表示させるメソッド
        // lonlat ... [lon , lat]
        addFeatureByLL(lonlat) {
            let coordinate = transform(lonlat , 'EPSG:4326' , 'EPSG:3857')
            addFeatureByCoord(coordinate)
        },
        //新しく追加
        //EPSG:3857形式の座標を元にマーカーを表示させるメソッド
        // coord ... [x , y]
        addFeatureByCoord(coord) {
            //MapViewが生成済みの時に実行する
            if (this.mapview) {
                //すでにVectorLayerがある場合は、取り除く
                if (this.vectorLayer) {
                    this.mapview.removeLayer(this.vectorLayer)
                }
                //描画したいポイントを生成
                let point = new Point(coord)
                //Featureを生成
                let feature = new Feature(point)
                //VectorSourceを生成
                let vectorSource = new VectorSource()
                //生成したVectorSourceに対してFeatureを追加
                vectorSource.addFeature(feature)
                //VectorSourceを描画するVectorLayerを生成
                this.vectorLayer = new VectorLayer()
                //VectorLayerにソースを追加する
                this.vectorLayer.addSource(vectorLayer)
                //マップに対してレイヤーを追加する
                this.mapview.addLayer(this.vectorLayer)
            }
        },
        createMap () {
            let latlon = transform([137.6850225,38.258595], 'EPSG:4326' , 'EPSG:3857')
            this.mapview = new Map ({
                target: 'OSMCanvas',
                layers: [
                    new TitleLayer({
                        source: new OSM()
                    })
                ],
                view: new View({
                    center:latlon,
                    zoom:5
                })
            })
        }
    }
}
追加メソッド部分
//新しく追加
//緯度経度を元にマーカーを表示させるメソッド
// lonlat ... [lon , lat]
addFeatureByLL(lonlat) {
    let coordinate = transform(lonlat , 'EPSG:4326' , 'EPSG:3857')
    addFeatureByCoord(coordinate)
},
//新しく追加
//EPSG:3857形式の座標を元にマーカーを表示させるメソッド
// coord ... [x , y]
addFeatureByCoord(coord) {
    //MapViewが生成済みの時に実行する
    if (this.mapview) {
        //すでにVectorLayerがある場合は、取り除く
        if (this.vectorLayer) {
            this.mapview.removeLayer(this.vectorLayer)
        }
        //描画したいポイントを生成
        let point = new Point(coord)
        //Featureを生成
        let feature = new Feature(point)
        //VectorSourceを生成
        let vectorSource = new VectorSource()
        //生成したVectorSourceに対してFeatureを追加
        vectorSource.addFeature(feature)
        //VectorSourceを描画するVectorLayerを生成
        this.vectorLayer = new VectorLayer()
        //VectorLayerにソースを追加する
        this.vectorLayer.setSource(vectorSource)
        //マップに対してレイヤーを追加する
        this.mapview.addLayer(this.vectorLayer)
    }
}
**addFeatureByLL()とaddFeatureByCoord()**を追加しています。
今回クリックイベントで直接EPSG:3857形式の座標取得ができますので、**addFeatureByLL()は使用しません。任意の緯度経度座標を持つポイントを何らかのイベント時に表示したい時に使えるようaddFeatureByLL()**を用意しています。
**addFeatureByCoord()**に対して任意の座標を引数で渡すと、既存のレイヤーがある場合Map上から取り除き、新しいポイントのFuatureを含むVectorLayerをMapに表示します。
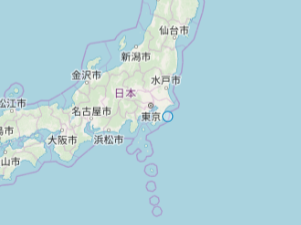
デフォルトでは、下記の画像のように青い半透明の円が描画されます。
メソッド以外にもPointClassなど追加で4つのクラスを読み込んでいますので、こちらの追加も忘れずに。
//今回新たに追加で読み込み
import Point from 'ol/geom/Point'
import Feature from 'ol/Feature'
import VectorSource from 'ol/source/Vector'
import VectorLayer from 'ol/layer/Vector'
Featureのスタイルを変更する
標準では、上記の画像のように青い半透明の円ですがスタイルを定義することでGoogleMapなどのピンのような形にすることも可能です。
下記のようなicon用のStyleをFeatureに対して割り当てることで、ピンとして表示することができます。
//追加インポート
import {Style , Icon} from 'ol/style'
//Pinの画像はassetsから読み込みます
import pinIcon from '@/assets/pin_icon.png'

//~~~~~~~~~~途中省略~~~~~~~~~~

addFeatureByCoord(coord) {
    //MapViewが生成済みの時に実行する
    if (this.mapview) {
        //すでにVectorLayerがある場合は、取り除く
        if (this.vectorLayer) {
            this.mapview.removeLayer(this.vectorLayer)
        }
        //描画したいポイントを生成
        let point = new Point(coord)
        //Featureを生成
        let feature = new Feature(point)
        //VectorSourceを生成
        let vectorSource = new VectorSource()
        //IconStyleを取得
        let iconStyle = this.getIconStyle()
        //featureに対してStyleを割り当てる
        feature.setStyle(iconStyle)
        //生成したVectorSourceに対してFeatureを追加
        vectorSource.addFeature(feature)
        //VectorSourceを描画するVectorLayerを生成
        this.vectorLayer = new VectorLayer()
        //VectorLayerにソースを追加する
        this.vectorLayer.setSource(vectorSource)
        //マップに対してレイヤーを追加する
        this.mapview.addLayer(this.vectorLayer)
    }
},
//新規追加
//FeatureのIconStyleを生成するメソッド
//return Icon Style
getIconStyle () {
    return new Style({
        image: new Icon (({
            anchor: [0.5, 1],
            anchorXUnits: 'fraction',
            anchorYUnits: 'fraction',
            src: pinIcon
        }))
    })
}
Featureのスタイル変更後のソース
import 'ol/ol.css'
import {toLonLat , transform} from 'ol/proj'
import Map from 'ol/Map'
import View from 'ol/View'
import TitleLayer from 'ol/layer/Tile'
import OSM from 'ol/source/OSM'

//今回新たに追加で読み込み
import Point from 'ol/geom/Point'
import Feature from 'ol/Feature'
import VectorSource from 'ol/source/Vector'
import VectorLayer from 'ol/layer/Vector'
import {Style , Icon} from 'ol/style'

//Pinの画像はassetsから読み込みます
import pinIcon from '@/assets/pin_icon.png'

export default {
    name: 'mapview',
    components: {},
    data: function () {
        return {
            mapview: null,
            markers: null,
            vectorLayer: null //追加
        }
    },
    methods: {
        initialize () {
            this.createMap()
            this.mapview.on("click", ev => {
                var lonlat = transform(ev.coordinate, 'EPSG:3857', 'EPSG:4326')
                this.$parent.selectLonLat = lonlat
                this.$emit('panretMessage')
                this.addFeatureByCoord(ev.coordinate)
            })
        },
        //新しく追加
        //緯度経度を元にマーカーを表示させるメソッド
        // lonlat ... [lon , lat]
        addFeatureByLL(lonlat) {
            let coordinate = transform(lonlat , 'EPSG:4326' , 'EPSG:3857')
            addFeatureByCoord(coordinate)
        },
        addFeatureByCoord(coord) {
            //MapViewが生成済みの時に実行する
            if (this.mapview) {
                //すでにVectorLayerがある場合は、取り除く
                if (this.mapview != null) {
                    this.mapview.removeLayer(this.vectorLayer)
                }
                //描画したいポイントを生成
                let point = new Point(coord)
                //Featureを生成
                let feature = new Feature(point)
                let iconStyle = this.getIconStyle()
                feature.setStyle(iconStyle)
                //VectorSourceを生成
                let vectorSource = new VectorSource()
                //生成したVectorSourceに対してFeatureを追加
                vectorSource.addFeature(feature)
                //VectorSourceを描画するVectorLayerを生成
                this.vectorLayer = new VectorLayer()
                //VectorLayerにソースを追加する
                this.vectorLayer.setSource(vectorSource)
                //マップに対してレイヤーを追加する
                this.mapview.addLayer(this.vectorLayer)
            }
        },
        //新規追加
        //FeatureのIconStyleを生成するメソッド
        //return Icon Style
        getIconStyle () {
            return new Style({
                image: new Icon (({
                    anchor: [0.5, 1],
                    anchorXUnits: 'fraction',
                    anchorYUnits: 'fraction',
                    src: pinIcon
                }))
            })
        },
        createMap () {
            let latlon = transform([137.6850225,38.258595], 'EPSG:4326' , 'EPSG:3857')
            this.mapview = new Map ({
                target: 'OSMCanvas',
                layers: [
                    new TitleLayer({
                        source: new OSM()
                    })
                ],
                view: new View({
                    center:latlon,
                    zoom:5
                })
            })
        }
    }
}
おわりに
今回は、特定のポイントに対してPinを落とすことを目的にしていましたが、レイヤーの作り方、FeatureへのStyleの割り当てを活用することで、OSMに対して各社が持っているPOIデータなどを表示することも可能です。POIデータ面など欠落していて、まだまだ活用できないけどデータはある。そんな時に上記のような独自レイヤーを展開しOSMで不足しているデータを補填することで活用性はより広がっていきます。
今後もこのようなメモ書き程度ですが、サービス開発時のポイントをいくつか書き続けていきます。
無知な部分もございますので、その際はご指摘いただけますと幸いです。
最後までお読みいただきありがとうございました。