環境
- MacOS Mojave
- Julia version 1.0.3
- Plots v0.23.0
Juliaのインストール手順は以前の記事参照。
手順
下記の3ステップで行います。
1. Animationオブジェクトの初期化
using Plots
anim = Animation()
2. フレームの保存
for i=1:100
    plt = plot(...)
    frame(anim, plt)
end
3. フレームからアニメーションへの変換(gif,mp4など)
gif(anim, "test.gif", fps = 30)
参照元:https://docs.juliaplots.org/latest/animations/
実例
複素関数 $w = z^3$を描いてみます。
$$
z = x + iy
$$
$$
z^3 = (x^3-3xy^2) + i(3x^2y-y^3)
$$
$u(x,y)$を実部、$v(x,y)$を虚部とすると、
$$
u(x,y) = x^3-3xy^2
$$
$$
v(x,y) = 3x^2y-y^3
$$
yを動かした時の曲線を、異なるxごとにグラフを描いてアニメーションで表示します。
# パッケージのインポート
using Plots
gr()

# uとvの定義
function u(x,y)
    return x^3 - 3*x*y^2
end

function v(x,y)
    return 3*y*x^2 - y^3
end

# yの範囲設定
y = [i*0.1 for i in -100:100]

# アニメーションのインスタンス生成
anim = Animation()

# xを-10から10まで0.5刻みで動かしてグラフを描き、フレーム画像として保存
for x0=-20:20
    x = x0*0.5
    u_result = map(u,[x for i in 1:length(y)],y)
    v_result = map(v,[x for i in 1:length(y)],y)
    plt = plot(u_result,v_result,label="x=$x",
                xlims=(-1000, 1000), ylims=(-500, 500),
                xlabel="u",ylabel="v")
    frame(anim, plt)
end

# gifに変換
gif(anim, "test.gif", fps = 5)
簡単ですね。
Jupyter上でも動くのが便利。
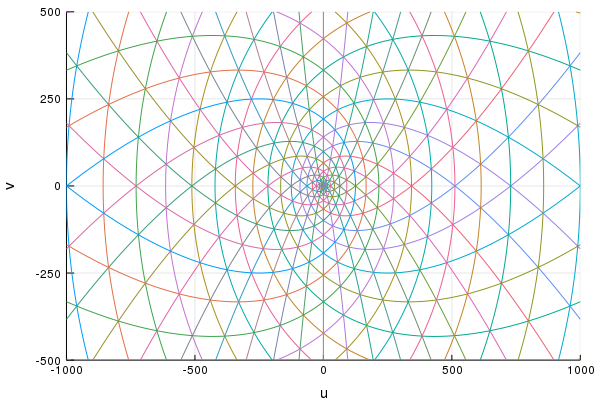
ちなみに重ね書きすると以下のようになります。
y = [i*0.1 for i in -100:100]

for x0=-20:20
    x = x0*0.5
    u_result = map(u,[x for i in 1:length(y)],y)
    v_result = map(v,[x for i in 1:length(y)],y)
    if x0==-20
            plot(u_result,v_result,label="x=$x",
                xlims=(-1000, 1000), ylims=(-500, 500),
                xlabel="u",ylabel="v")
    else
        plot!(u_result,v_result,label="x=$x",
                xlims=(-1000, 1000), ylims=(-500, 500),
                xlabel="u",ylabel="v")
    end
end
plot!(legend=:none)
savefig("test.png")
マクロを使った方法
@animateや@gifというマクロを使った方法もあるそうです。
参照元:https://docs.juliaplots.org/latest/animations/
anim = @animate for i=1:100
    plot(...)
end
gif(anim, "/tmp/anim_fps15.gif", fps = 15)
@gif for i=1:100
    plot(...)
end every 10
試していませんが、とりあえずメモ。