はじめに
これまでにRでスペクトルデータの前処理や多変量解析の記事を書いてきたので、せっかくだからShinyアプリとして実装してみた。
アプリにすることで、前処理条件の変化が最終的なモデルにどのような影響を及ぼすのか視覚的に掴みやすくなるといったメリットがある。(膨大な条件の中から最適化するという目的には不向き。)
アプリ
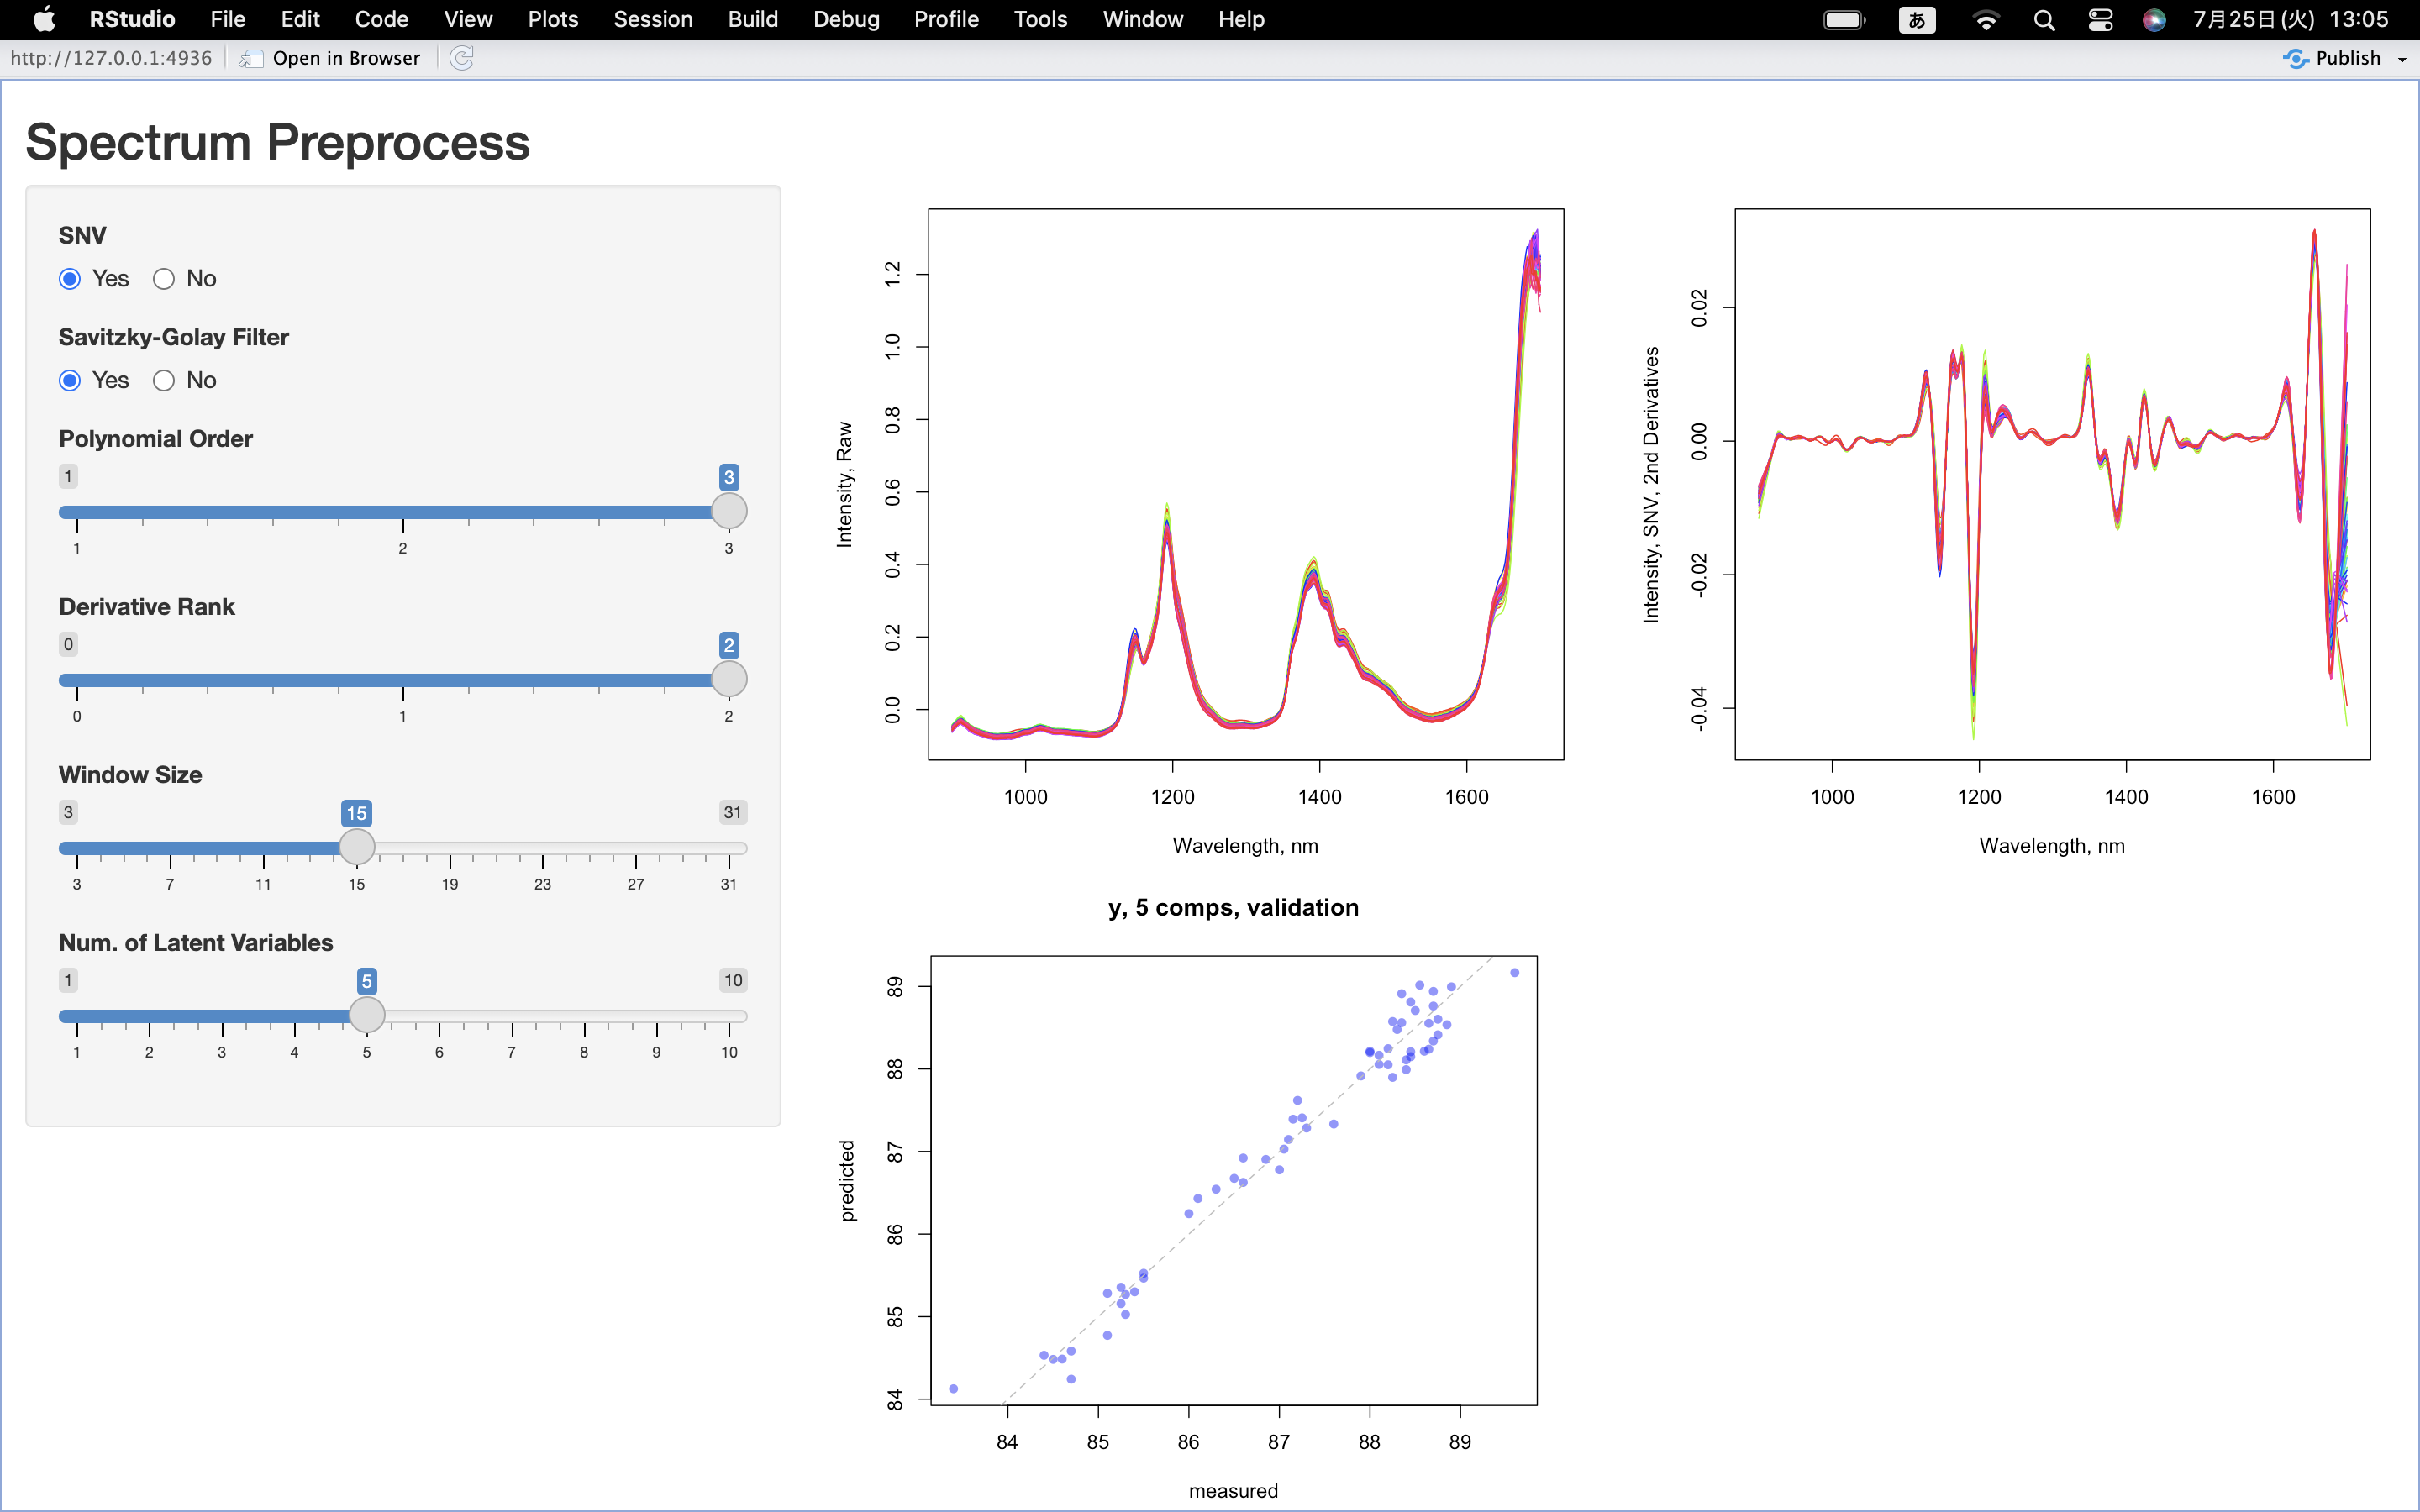
今回つくったアプリは以下のような感じ。サイドバーには前処理としてSNV(Standard Normal Variate)とSavitzky-Golayフィルタによる微分処理の有無やハイパーパラメータの設定、そしてPLSモデルのValidationプロットにおける潜在変数の数などの設定を配置した。SNVおよびフィルタ処理の有無はラジオボタンで選択でき、フィルタのパラメータや潜在変数の数はスライダーで変更できる。
メインパネルには、{pls}パッケージに含まれるgasolineデータ中のNIRスペクトルデータの生データと前処理済みのデータを並べて、その下に選択した前処理データを用いた得られたPLSモデルのバリデーションプロットを配置した。
コード
コードは、以下のとおり。{shiny}のほか、フィルタ処理のための{signal}とPLSモデリングのための{pls}を読みこんでいる。
前処理済みのスペクトルデータは、プロットとPLSモデリングの両方に使用するため、独立したリアクティブな変数として用意しており、UI側から渡される設定値に変更があるとリアクティブに反応する。
PLSモデリングの際の潜在変数の数は、10とした。
library(shiny)
library(signal)
library(pls)
data(gasoline)

ui <- fluidPage(

  titlePanel("Spectrum Preprocess"),

  sidebarLayout(
    sidebarPanel(
      radioButtons("snv", "SNV", choices = c("Yes", "No"), selected = "Yes",
                   inline = TRUE, width = "100%"),
      radioButtons("sg", "Savitzky-Golay Filter", choices = c("Yes", "No"), selected = "Yes",
                   inline = TRUE, width = "100%"),
      sliderInput("sg_p", "Polynomial Order",
                  min = 1, max = 3, value = 3, step = 1, width = '100%'),
      sliderInput("sg_m", "Derivative Rank",
                  min = 0, max = 2, value = 2, step = 1, width = '100%'),
      sliderInput("sg_n", "Window Size",
                  min = 3, max = 31, value = 15, step = 2, width = '100%'),
      sliderInput("LV", "Num. of Latent Variables",
                  min = 1, max = 10, value = 5, step = 1, width = "100%")
    ),
    mainPanel(
      fluidRow(
        column(6, plotOutput("raw")),
        column(6, plotOutput('preprocessed'))
      ),
      fluidRow(
        column(6, plotOutput("results")),
        column(6)
      )
    )
  )
)


server <- function(input, output) {

  NIR <- gasoline$NIR
  wl <- seq(900, 1700, 2)

  output$raw <- renderPlot({
    par(mar = c(4,4,1,1))
    matplot(wl, t(NIR), type = 'l', lty = 1, col = rainbow(60),
            xlab = 'Wavelength, nm', ylab = 'Intensity, Raw')
  })


  df_preprocessed <- reactive({
    data <- NIR
    if (input$snv == "Yes") {
      data <- scale(t(gasoline$NIR), center = T, scale = T)
      data <- t(data)
    }
    if (input$sg == "Yes") {
      data <- apply(data, 1, sgolayfilt, p = input$sg_p, m = input$sg_m, n = input$sg_n)
      data <- t(data)
    }
    return(data)
  })


  output$preprocessed <- renderPlot({
    label <- "Intensity"
    if (input$snv == "Yes") label <- paste0(label, ", SNV")
    if (input$sg == "Yes") {
      if (input$sg_m == 0) label <- paste0(label, ", Smoothing")
      if (input$sg_m == 1) label <- paste0(label, ", 1st Derivatives")
      if (input$sg_m == 2) label <- paste0(label, ", 2nd Derivatives")
    }
    data <- df_preprocessed()
    par(mar = c(4,4,1,1))
    matplot(wl, t(data), type = 'l', lty = 1, col = rainbow(60),
            xlab = 'Wavelength, nm', ylab = label)
  })


  plsObj <- reactive({
    df <- list(x = df_preprocessed(), y = gasoline$octane)
    model <- plsr(y ~ x, data = df, ncomp = 10, validation = "LOO")
    return(model)
  })


  output$results <- renderPlot({
    plot(plsObj(), ncomp = input$LV, pch = 16, col = '#0000FF80')
    abline(a = 0, b = 1, lty = 2, col = 'gray')
  })
}

# Run the application
shinyApp(ui = ui, server = server)
おわりに
今回は、{pls}パッケージに含まれるデータを用いて簡単にスペクトルデータの前処理やPLSモデリングを行うアプリをShinyで実装してみた。これくらいのアプリだと10分もあればできてしまうので、RだけでウェブアプリをつくれるShinyは非常に便利だと感じた。今回のアプリに、ファイルの読み込み機能やハイパーパラメータの最適化処理のためのアルゴリズムなどをのっけるなど好きに拡張することもできる。