はじめに
みなさまGWいかがお過ごしでしょうか。私は普段の5倍量酒を飲んではお腹を壊す生活です。"ゴールデン"ウィークと言うくらいなので、金麦ばかり飲んじゃいますよね。そうでもないですか。
前回の記事で化合物の合成容易性をGooglecolabで計算する方法をご紹介しました。そこにSCScoreという別の指標を追加し、比較できるアプリを開発しましたのでご紹介します。
前回記事
開発したアプリ
まずは開発したアプリをご紹介します。streamlitで作成しています。
requirments
- streamlit 1.43.2
- rdkit-pypi 2024.9.6
- pandas 2.2.3
- numpy 2.2.4
実装機能
- SMILESまたはCSVで分子構造を入力
- SAScoreとSCScoreを同時に算出
- 色分け付きの表で比較
- 分子構造を画像付きで表示
- スコアの解説(折りたたみ形式)
アプリ画面
見た目は以下のようになっています。上からスコアの解説(クリックで開くようにしています)、スコアの指標、入力方法、計算実行ボタンとなっています。
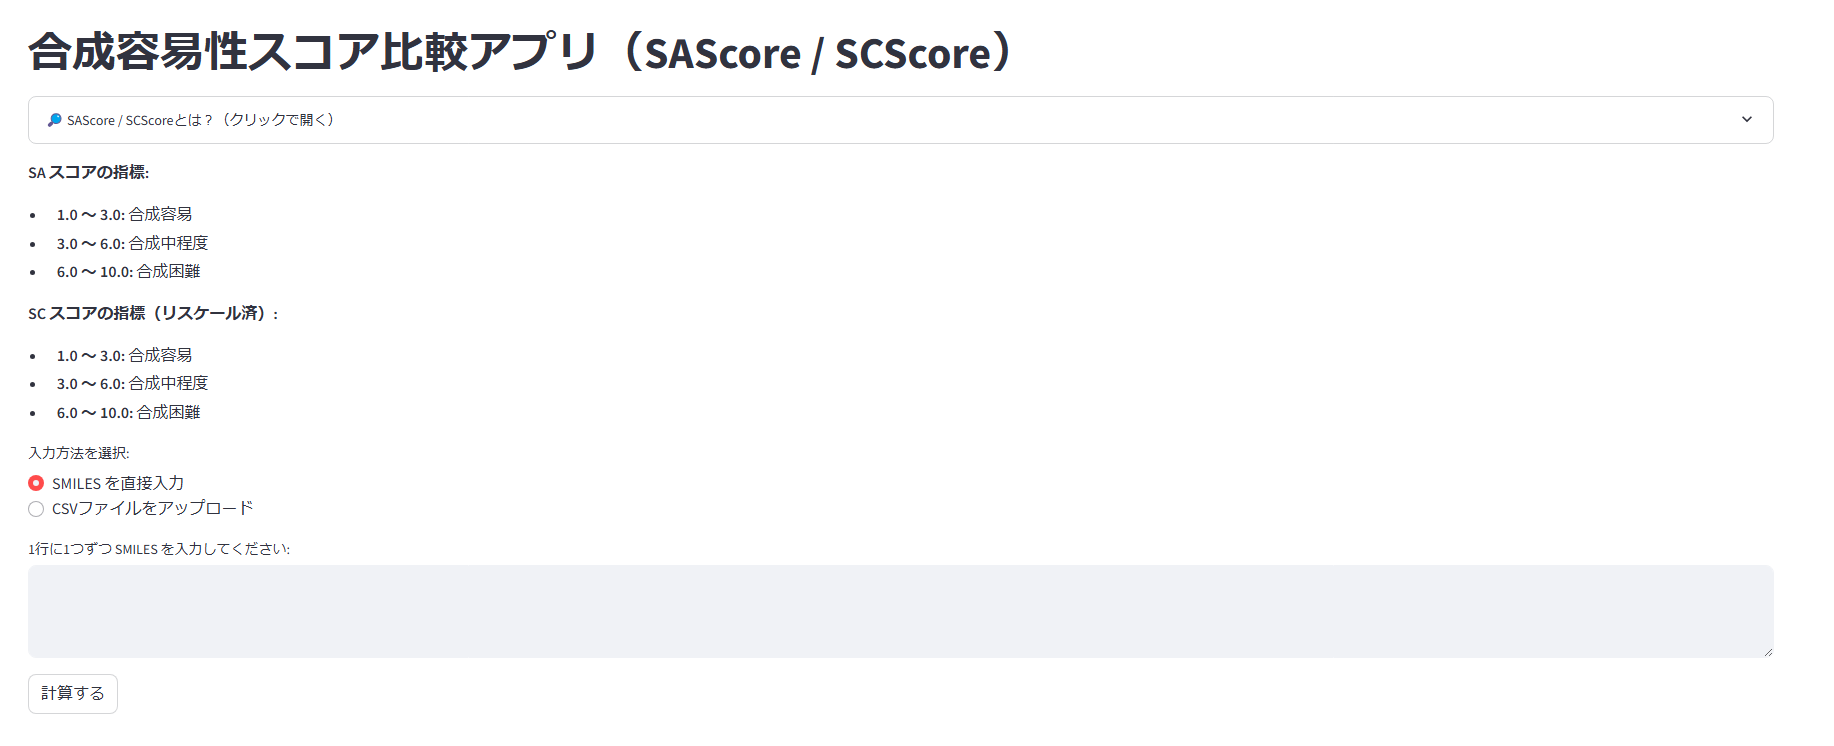
【スコアの解説】
それぞれのスコアに関して解説を入れています。


【スコアの指標】
SCScoreは元の論文では1~5段階評価ですが、SAScore(1~10段階評価)と比較しやすいように1~10段階にスケーリングしています。
【入力方法】
直接SMILESを入力する方法と、CSVでアップロードする方法を選べるようにしました。単発で調べたい場合は直接入力、スクリーニングなどで多くの計算が必要な場合はCSVでアップロード、そんな使い方をイメージしています。
CSVファイルは「SMILES」というカラム名を持つ列があればOKです。

【計算】
SMILESを入力(もしくはCSVをアップロード)し、計算ボタンを押すとSAScoreとSCScoreを同時に計算し、表形式で表示します。また、スコアの範囲で色分けをし、視覚的にぱっと見で難易度を把握できるようにしています。
表の下部には分子構造とスコアを並べて表示するようにしました。

コード解説
SAScoreとSCScoreの準備
それぞれgithubで公開されています。
SAScoreで必要なのはsascorer.pyとfpscores.pkl.gzです。
SCScoreはnumpyで動作するスタンドアロンモデルがあります。自前のデータで再トレーニングする場合はtensorflowが必要になりますが、今回は実装速度を優先してスタンドアロンモデルを使用します。
実装
まずは必要なモジュールのインポートです。rdkitはSMILESをmolファイルに変換し、分子構造の描画とSAScoreの計算に渡す用です。
import streamlit as st
import pandas as pd
from rdkit import Chem
from rdkit.Chem import Draw
from rdkit.Chem import Descriptors
from sascorer import calculateScore
from scscore_numpy import SCScorer

# ページ設定
st.set_page_config(page_title="合成容易性スコア比較", layout="wide")
st.title("合成容易性スコア比較アプリ(SAScore / SCScore)")

with st.expander("🔎 SAScore / SCScoreとは?(クリックで開く)"):
    st.markdown("""
### 🧪 SAScore(Synthetic Accessibility Score)

- **構造的な見た目・珍しさ・サイズ・対称性**などに基づき、分子の「作りやすさ」を評価

---省略---
スコアの指標をMarkdownで記述しておきます。
st.markdown("""
**SA スコアの指標:**
- **1.0 ~ 3.0:** 合成容易
- **3.0 ~ 6.0:** 合成中程度
- **6.0 ~ 10.0:** 合成困難

**SC スコアの指標(リスケール済):**
- **1.0 ~ 3.0:** 合成容易
- **3.0 ~ 6.0:** 合成中程度
- **6.0 ~ 10.0:** 合成困難
""")
SCScoreは元の論文では1~5段階評価ですが、SAScore(1~10段階評価)と比較しやすいように1~10段階にスケーリングします(別にしなくてもいいです)。
# SCScoreを1〜10にスケーリング
def rescale_scscore(score, old_min=1.0, old_max=5.0, new_min=1.0, new_max=10.0):
    score = float(score)
    scaled = (score - old_min) / (old_max - old_min) * (new_max - new_min) + new_min
    return max(min(scaled, new_max), new_min)
スコアの計算です。SAScoreはSMILESをrdkitでmolファイルにして渡してあげます。SCScoreはSMILESのまま渡して大丈夫です。
# スコア計算関数
def calculate_scores(smiles):
    try:
        mol = Chem.MolFromSmiles(smiles)
        sa_score = calculateScore(mol)
        sc_score_raw = sc_model.get_score_from_smi(smiles)[1]
        sc_score = rescale_scscore(sc_score_raw)
        mw = Descriptors.MolWt(mol)
        return sa_score, sc_score, mw
    except:
        return None, None, None
入力です。st.radioでSMILESの直接入力かCSVのアップロードかユーザーが選べるようにしています。
# 入力
input_method = st.radio("入力方法を選択:", ("SMILES を直接入力", "CSVファイルをアップロード"))

if input_method == "SMILES を直接入力":
    smiles_input = st.text_area("1行に1つずつ SMILES を入力してください:")
    if st.button("計算する"):
        smiles_list = [s.strip() for s in smiles_input.splitlines() if s.strip()]
        data = []
        mols = []
        for smi in smiles_list:
            sa, sc, mw = calculate_scores(smi)
            if sa is not None:
                data.append((smi, sa, mw, sc))
                mols.append(Chem.MolFromSmiles(smi))

        df = pd.DataFrame(data, columns=["SMILES", "SA Score", "Molecular Weight", "SC Score"])
        st.dataframe(df.style
            .applymap(highlight_score, subset=["SA Score"])
            .applymap(highlight_score, subset=["SC Score"]))

        st.subheader("分子構造(スコア付き)")
        legends = [f"SA: {sa:.2f}, SC: {sc:.2f}" for _, sa, _, sc in data]
        img = Draw.MolsToGridImage(mols, legends=legends, subImgSize=(300,300), molsPerRow=6)
        st.image(img)
CSVをアップロードした場合は、「SMILES」という名前の列を抜き出してスコア計算関数に渡すようにします。
elif input_method == "CSVファイルをアップロード":
    uploaded_file = st.file_uploader("CSVファイルを選択(SMILES列を含む必要あり)")
    if uploaded_file is not None:
        df_in = pd.read_csv(uploaded_file)
        if "SMILES" not in df_in.columns:
            st.error("CSVに 'SMILES' カラムが必要です。")
        else:
            df_out = []
            mols = []
            for i, row in df_in.iterrows():
                smi = row["SMILES"]
                sa, sc, mw = calculate_scores(smi)
                if sa is not None:
                    df_out.append((smi, sa, mw, sc))
                    mols.append(Chem.MolFromSmiles(smi))

            df = pd.DataFrame(df_out, columns=["SMILES", "SA Score", "Molecular Weight", "SC Score"])
            st.dataframe(df.style
                .applymap(highlight_score, subset=["SA Score"])
                .applymap(highlight_score, subset=["SC Score"]))

            st.subheader("分子構造(スコア付き)")
            legends = [f"SA: {sa:.2f}, SC: {sc:.2f}" for _, sa, _, sc in df_out]
            img = Draw.MolsToGridImage(mols, legends=legends, subImgSize=(300,300), molsPerRow=6)
            st.image(img)

            # ダウンロードリンク
            csv = df.to_csv(index=False).encode('utf-8')
            st.download_button("結果をCSVでダウンロード", csv, "scores.csv", "text/csv")
完成です。
おわりに
今回は合成容易性(SAScore、SCScore)を計算し、比較するアプリを開発しました。世の中には他にもRAScoreやSYBAなど指標がまだあるので、これらも同様に実装して比較できるようにしていきたいです。
それでは次の記事でお会いしましょう (┐「ε:)
参考