js内で完結する場合は今回のような対応は必要ないと思いますが、
データ自体は別から持ってきて、目盛りのmax値も自動更新にしたい且つmax値を揃えたい場合に使いました。
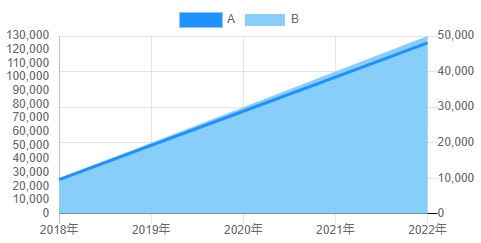
↓最大値を何も設定せずに普通に作ったグラフ。
Aの目盛りの最大値が130,000、Bの目盛りの最大値が50,000となっています。

現時点でのコードは下記になります。
const ctx = document.getElementById('myChart');
let myChart = new Chart(ctx, {
	type: 'line',
	data: {
		labels: ['2018年', '2019年', '2020年', '2021年', '2022年'],
		datasets: [{
			label: 'A',
			tension: 0,
			fill: false,
			data: [25000, 50000, 75000, 100000, 125000],
			yAxisID: 'y-axis-1',
			borderColor: '#1E90FF'
		}, {
			label: 'B',
			tension: 0,
			data: [10000, 20000, 30000, 40000, 50000],
			yAxisID: 'y-axis-2',
			backgroundColor: '#87CEFA',
			borderColor: 'transparent'
		}]
	},
	options: {
		tooltips: {
			mode: 'nearest',
			intersect: false,
		},
		responsive: true,
		elements: {
			point:{
				radius: 0
			}
		},
		scales: {
			yAxes: [{
				id: 'y-axis-1',
				type: 'linear',
				position: 'left',
				ticks: {
					min: 0,
					stepSize: 10000,
					callback: function(val){
						return val.toString().replace(/\B(?=(\d{3})+(?!\d))/g, ',');
					}
				},
				gridLines: {
					display: false,
				}
			}, {
				id: 'y-axis-2',
				type: 'linear',
				position: 'right',
				ticks: {
					min: 0,
					stepSize: 10000,
					callback: function(val){
						return val.toString().replace(/\B(?=(\d{3})+(?!\d))/g, ',');
					}
				},
				gridLines: {
					zeroLineColor: '#000',
					drawBorder: false,
				}
			}]
		}
	}
});
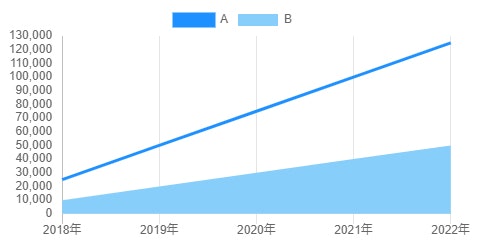
Aの方が目盛りの最大値が大きいので、今回はBをAに合わせていきます。
まずは、Aの目盛りの最大値を取得します。
const yAxis1Index = myChart.controller.boxes.findIndex((u) => u.id === 'y-axis-1'); // 3
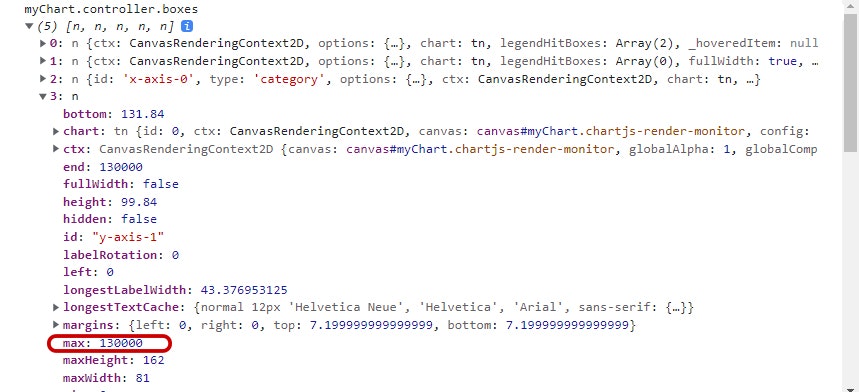
const yAxis1Max =  myChart.controller.boxes[yAxis1Index].max; // 130000
myChart.controller.boxesで取得できるもの↓

下記の記述を追加する。
const yAxis2Index = myChart.options.scales.yAxes.findIndex((u) => u.id === 'y-axis-2');
myChart.options.scales.yAxes[yAxis2Index] = {
	ticks: {
		display: false, // 目盛りの値が重複してしまうので非表示にする
		max: yAxis1Max
	},
	gridLines: {
		display: false,
	}
};
myChart.update(); // グラフを更新

